December 2019 Investment Commentary & Performance Review
•
0 likes•27 views

The document provides an investment commentary for December 2019. It discusses the strong performance of the broader market in 2019 but notes increasing valuations. It summarizes the portfolio manager's long-standing optimistic yet cautious outlook. The commentary describes adjustments made to the portfolio in the fourth quarter, including reducing the technology sector weighting and selling Apple, to take profits and find less expensive opportunities. It reiterates the manager's commitment to its value investment process and focus on capital preservation over the short term while maintaining an optimistic long-term view.

Recommended
Recommended
More Related Content
What's hot
What's hot (20)
Similar to December 2019 Investment Commentary & Performance Review
Similar to December 2019 Investment Commentary & Performance Review (20)
More from Anthony A. Lombardi, CFA
More from Anthony A. Lombardi, CFA (20)
Recently uploaded
Recently uploaded (20)
December 2019 Investment Commentary & Performance Review
- 1. ¹Comments and opinions expressed reflect solely the personal views of Anthony Lombardi as of 12/31/19, and not any other individual or firm. Such views are not a recommendation to buy or sell any security, fund or portfolio. Any investment decision should be made in consultation with a financial advisor. DECEMBER 2019 INVESTMENT COMMENTARY1
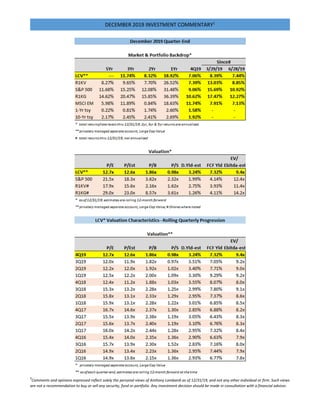
- 2. ¹Comments and opinions expressed reflect solely the personal views of Anthony Lombardi as of 12/31/19, and not any other individual or firm. Such views are not a recommendation to buy or sell any security, fund or portfolio. Any investment decision should be made in consultation with a financial advisor. DECEMBER 2019 INVESTMENT COMMENTARY1 “An Apple a Day Helps Keep….”; But There Are Other Fruits and Vegetables in The Garden The broader market (S&P 500) ended 2019 +31.5% and generated a 10-year total annualized return of 13.5%, compared to 15.2% and 11.8% for the Russell 1000 Growth and Value Indices, respectively. Forward P/E’s for each of these respective benchmarks expanded further during the year, ending at ~18x, ~23x and ~16x, an elevation that helped contribute to the overall market’s bull run. Regular readers of our commentary know we have had a long-standing optimistic view but one increasingly where our guard has been up during the past 18-months. As we have highlighted in prior commentary, not only have multiples expanded but valuation disparity between Growth and Value has continued to materially diverge. As illustrated below, entering 2020 there was an 11-point multiple gap in trailing P/E, a greater-than 6-point gap in P/B and a near 3-point gap in EV/EBITDA, disparities that are pinned on relatively high aggregate multiples. While only one part of a broader mosaic, such data points have increasingly served to drive our intense focus upon capital protection measures in our portfolio actions during the past 12-18 months, despite having generated underperformance in our portfolio returns in the short-term. While we remain near fully invested in our concentrated LCV strategy, we have continued to actively desensitize certain cyclicality when appropriate, Source: Harvard Health Publishing
- 3. ¹Comments and opinions expressed reflect solely the personal views of Anthony Lombardi as of 12/31/19, and not any other individual or firm. Such views are not a recommendation to buy or sell any security, fund or portfolio. Any investment decision should be made in consultation with a financial advisor. DECEMBER 2019 INVESTMENT COMMENTARY1 been laser-focused on cheapening our portfolio and been undeterred in utilizing process-permitted cash levels to solidify MOS. Despite the close of one decade and start of a new, our process prism, for which we view the dynamic mosaic to crystalize our vision and portfolio positioning, remains unaltered. As we have for three decades in this business, we vigilantly listen--to the market, the macro backdrop, sector and company news flow, and the corresponding swings in investor psychology. At the core, the market is a discounting mechanism, and we remain vigilant as to where the pendulum swings at any given point. As noted in the past, cumulatively, such swings serve as building blocks in our constant assault seeking out opportunities for entry into, and exit from, investment positions. Most importantly, as inoculated value investors, we place a premium on staying true to our investment process with an unrelenting focus on MOS (margin of safety). While balance sheets and underlying growth are favorable attributes, the pendulum swing in concentration, and corresponding valuation, in certain areas of the market has increasingly captured our attention. Case in point, Technology. Specifically, the sector ended 2019 comprising 23.2% of the S&P 500 market capitalization weight. The top 5 stocks, represented by market cap weighting, were AAPL (4.7%), MSFT (4.5%), V (1.2%), MA (1.0%) and INTC (1.0%). Cumulatively, these stocks represented $3.5 trillion of total cap, or individually $1.3 trillion, $1.2 trillion, $0.4 trillion, $0.3 trillion and $0.3 trillion, respectively, with AAPL and MSFT representing ~40% of total sector weight. Also notable is the classification of Visa and Mastercard within the TECH sector as opposed to the Financials. Valuation characteristics of the two leaders were attributed as follows: AAPL: 25X p/e, 23x fwd P/E, 2.0x PEG, 16x EV/EBITDA, 5.3x P/S, 4.3% FCF yield and a 1.1% dividend yield. From a balance sheet perspective, AAPL’s debt totals $108 billion and net cash is $98 billion vs $35 billion and $120 billion, respectively, 5-years earlier. By comparison, MSFT valuation stood at 34x p/e, 29x fwd P/E, 2.5x PEG, 20x EV/EBITDA, 9.3x
- 4. ¹Comments and opinions expressed reflect solely the personal views of Anthony Lombardi as of 12/31/19, and not any other individual or firm. Such views are not a recommendation to buy or sell any security, fund or portfolio. Any investment decision should be made in consultation with a financial advisor. DECEMBER 2019 INVESTMENT COMMENTARY1 P/S, 3.2% FCF yield and a 1.3% dividend yield. From a balance sheet perspective, MSFT’s debt stands at $86 billion with net cash of $51 billion vs $24 billion and $65 billion, respectively, 5-years ago. Not only has the combined market value of AAPL and MSFT hit $2.5 trillion, but Alphabet (parent of Google) and AMZN are not far behind in adding an incremental $2 trillion more, yet sector classification for each is in Communication Services and Consumer Discretionary, respectively. As discussed in our portfolio actions below, our process, value conscience and contrarian instincts dictated the full SALE of AAPL late in the fourth quarter, a position we have held since inception. While a great company with a pristine balance sheet, we believed the time ripe to peel away from AAPL, harvest the gains, and hunt for less expensive nutrients growing in the market’s garden. With our typical investment horizon targeted at ~3-5 years, implicit in such a holding period is not simply low turnover (and low cost), but a time-period integral to an investment discipline undeterred by short-term events and emotions. Given our large cap value process is contrarian, high-conviction, and concentrated, we need not scramble adjusting our long-standing views, or portfolio positioning, due to weekly, monthly or quarterly events. As part of our disciplined implementation, we overlay longer-term secular views pertaining to the broader macroeconomic and market backdrop, resulting in active sector and stock exposures. The foundation of our disciplined investment process and philosophy does not allow for it to be radically altered, nor portfolio stock selection and sector allocation be impacted in the same vein. Given investment backdrops do not formulate overnight, portfolio construction, in our opinion, should be the result of a broader mosaic that does not succumb to near-term emotions and current events. Whether a function of near- or intermediate-term fundamentals, and/or investor psychology, our focus remains on recognizing, assessing and seizing upon valuations that potentially present opportunities, be they BUY or SELL. We like how our portfolio positioning has migrated over the past three years, unwavering on process discipline, and always mindful of the ever-evolving mosaic. Portfolio Positioning & Review Given aggregate market and valuation levels, our guard remained up during 4Q19 with a continued bias for liquidity and intensive focus on solidifying MOS. Notably, our target Cash level increased +100bps during 4Q19, with market value cash hitting an intra-quarter high of nearly 7% during late November as process and our value conscience dictated our actions. By quarter-end, market value cash had been reduced to ~3%. Key sector target weighting reductions in TECH and CS (Staples), were partnered with sector target weighting increases in IND and CommSvc (Communication Services). As contrarians, it does not surprise us that our process and convictions have led us to actively reduced our TECH sector weighting 500bps (22%-->14%) since 3Q18, including the 4Q19 full position sale of AAPL. As noted in prior commentaries we have chosen not to ignore strong long-term performance in our portfolio, coincided against broader equity market appreciation, select underlying valuation multiple expansion, and potentially more challenging forward earnings comparisons during the next two years (2020-21). The upward traction in interest rates appears to have reignited, following a yield-curve related stall. We continue to believe our actions taken in the portfolio serve to reinforce a protective mindset, while still maintaining an optimistic long-term posture in our positioning by remaining near fully invested. By prudently underscoring our focus on overall MOS, the portfolio’s performance was served well during a volatile 2018 and, following our actions during 2019, we believe is positioned well for 2020 and beyond. We are not concerned about our relative underperformance last year, as our focus remains on the long-term horizon, and the risk/reward prism through which we are viewing.
- 5. ¹Comments and opinions expressed reflect solely the personal views of Anthony Lombardi as of 12/31/19, and not any other individual or firm. Such views are not a recommendation to buy or sell any security, fund or portfolio. Any investment decision should be made in consultation with a financial advisor. DECEMBER 2019 INVESTMENT COMMENTARY1 Our LCV portfolio exposure remained allocated to 10 of 11 sectors, emphasizing issues possessing compelling valuation, financial statement strength, and where near-term psychology serves to compensate for risk, providing the inherent MOS we seek when investing over a 3- to 5-year time horizon. Straying to own safety at any price has never been an acceptable paradigm as our value conscience and investment process simply will not allow us to pay any multiple for quality. We have always been hardwired, contrarian, value investors, conscious of risk factors, and continually viewing through a risk/reward prism, in active pursuit of opportunities providing the right balance. We seek companies offering a combination of cheapness, a contrarian view, possessing stable long-term balance sheets and attractive FCF characteristics. That said, we are never married to one view as valuations, sentiment and process drive our decision-making. By way of example, such patience paid dividends during 2H18 & 2019 as we felt the combination of our long-term time horizon and valuation compression in certain defensive areas hit risk/reward levels that became appealing. As opportunities present themselves, we have increasingly nibbled and reallocated our portfolio with a contrarian mindset. Despite having maintained a higher cash target during the past several quarters, we are still finding, buying and remaining owners of cheapness, MOS and compelling free cash flow (FCF), while at the same time we are sellers when valuation criteria or process constraints are breached. As to the latter, our decisions to further reduce our Technology sector weighting via a full position Sale of a long-term holding during the fourth quarter reflected such discipline. In addition to this position sale, there was one new holding added during the quarter. While further reducing our sector weightings in Consumer Staples and Technology, we increased our target weighting in Communication Services and Industrials. Such actions served to underscore our high-conviction, concentrated process and philosophy. Not only has deployment of investable capital in this manner been more acceptable to our contrarian, value-based discipline, but also in recognition that forward long-term returns are typically related to point-of-entry valuation multiples. When juxtaposed against our belief favorable operating leverage opportunities still exist in the economy, and amongst companies we target, we remain steadfast in how we aim to position our LCV portfolio. Clearly, as evidenced by changes during the past two years, in conjunction with the broader macro backdrop, we have not found such opportunities be as vast, nor inexpensive as was the case 5-10 years ago. Key Trades & Attribution We seeded our concentrated LCV strategy during the first quarter 2016. Since inception, as opportunities have been presented, we have made several active portfolio decisions, at both the stock and sector level. During 4Q19, notable actions included: Sector/Cash Target Weighting Changes: o Communication Services (+) o Industrials (+) o Technology (-) o Consumer Staples (-) Position Target Weighting Changes & Rebalance Trades across several sectors: o Industrials o Technology o Consumer Staples o Consumer Discretionary
- 6. ¹Comments and opinions expressed reflect solely the personal views of Anthony Lombardi as of 12/31/19, and not any other individual or firm. Such views are not a recommendation to buy or sell any security, fund or portfolio. Any investment decision should be made in consultation with a financial advisor. DECEMBER 2019 INVESTMENT COMMENTARY1 o Communication Services o Energy o Financials o Healthcare o Materials o Utilities One FULL position SALE & BUY, four sector target weight changes; 25 portfolio holdings. Activity level remained high in the quarter (4Q19) given opportunities presented in the backdrop, allowing us to underscore our convictions and remain steadfast in executing our investment process. While our investment discipline is generally characterized by low turnover, when action is dictated by process, we execute accordingly—there is never hesitation with a stated process. We have repeatedly stated that we neither marry, nor fall in love with any stock or sector, nor attempt to justify going beyond embedded process constraints as reasons for portfolio exposures. Our target sector weightings are influenced by top-down and bottom-up views, while fundamentals, valuation and psychology drive stock level decisions. For the fourth consecutive quarter, we executed a full position SALE, while correspondingly initiating a new target position with our first BUY in 5 quarters. The “imbalance” in SALEs vs BUYs has been due to a combination of increased allocation to existing target positions (given our conviction & sector views), as well as higher Cash utilization. The new BUY and full SALE in 4Q19 was amongst activity including changes to four (4) sector target weightings and numerous rebalance (up and down) trades, cumulatively touching all ten (10) sectors for which the portfolio is exposed. Real Estate remained at 0% allocation (allowed by process), having eliminated this exposure in 1Q19. Given previously stated views of the backdrop, we retained our bias for higher Cash and defensiveness (which includes valuation). During 4Q19, we lowered our target weightings in the Technology and Consumer Staples sectors, while increasing Communication Services and Industrials exposures. Notably, the reduction in Technology follows a similar action we took in 2Q19 and 3Q18. Further, the reduction in Staples was the second consecutive quarter, on the heels of four consecutive quarters of targeted increases. As for Communication Services, our actions represented a continued build in portfolio exposure, given previous increases in sector weighting during 1Q19 and 3Q19. In the process of identifying a new position holding, we made an active decision to increase our Industrial sector weighting near the maximum allowed by process. At the end of 4Q19, the number of target positions held in our LCV portfolio remained at 25, unchanged versus the prior quarter, yet still diversified across 10 of 11 sectors. We view portfolio actions taken during 2018-2019 as a continuation of measured and timely modification to our long-standing optimistic stance, founded upon our investment process for which we have long pre-telegraphed. Indicative of this migration is the combined underweight allocation to HC and CS, which stood at ~ -340bps at quarter-end, a vastly different level compared to nearly -1,200bps at the end of 3Q16; a shift that occurred through a combination of valuation compression and active portfolio allocation decisions. Further indication is presented by an -800bps reduction in our Technology sector weighting, from 22% to 14%, since 3Q18, and an +400bps increase in Communication Services weighting, from 7% to 11%, since 4Q18. On a weighted average basis, the market capitalization of our portfolio holdings was $113.3 billion, a decline of 15% and 9% compared to prior quarter and year-ago, respectively. The decrease in capitalization principally reflects portfolio changes we made in sector and target holding weightings during the past year, inclusive of full position sales and purchases, as well as having had a bias to higher Cash. MOS remains our principal guide for which we are compelled by process to follow. Quarter-end target and market value weights for our LCV portfolio are detailed below.
- 7. ¹Comments and opinions expressed reflect solely the personal views of Anthony Lombardi as of 12/31/19, and not any other individual or firm. Such views are not a recommendation to buy or sell any security, fund or portfolio. Any investment decision should be made in consultation with a financial advisor. DECEMBER 2019 INVESTMENT COMMENTARY1 On a market value basis, we ended 4Q19 with ~2.8% cash, down slightly vs 3Q19. Continuing a trend during 2019, our cash target weighting was raised to 4.0%, +100bps vs 3Q19. Market value cash hit an intra-period high of nearly 7% during late November, an action dictated by our process and value conscience. Recall, from a process perspective, our targeted cash range is designed to provide flexibility, to allow for repositioning within a highly concentrated, yet diversified portfolio. As noted, our LCV portfolio was comprised of 25 total equity positions at quarter-end. While we are long-term investors, we have a stated preference to monetize winners, and/or sell-down positions based on discipline, in so doing avoid placing capital at risk by simply holding investments as place-markers or allowing exposures to become excessive when selective rebalance is more appropriate. MOS is paramount and is critical in limiting potential downside. Holding a position that has attained valuation levels no longer representative of attractive risk/reward only serves to create undo diversification risk and is simply an unacceptable practice. With protection of capital a covenant we are unwilling to break, we firmly believe in utilizing process-permitted cash level when situations dictate, to adhere to this core investment principle. Similarly, significant rebalancing trades we have executed serve to protect capital in very much the same way. And, when process and valuation present opportunity, we look to not only reallocate capital but deploy excess cash levels accordingly. Such discipline is among several key distinguishing characteristics in our process. We simply have no penchant to manage a portfolio structured with individual positions not representative of our high convictions, and firmly believe in a concentrated list of holdings, yet one diversified across market sectors. As we have noted previously, with our sector band targets set at 0.5x to 1.5x respective S&P 500 capitalization weights, should a sector’s size fall materially below certain predefined thresholds our process further allows for optionality for a 0% sector target with redeployment of available capital into other sectors, or Cash. Recall we utilized this 0% optionality with the Real Estate sector during 1Q19, a lever which has been maintained. At quarter-end, the only other sector within this 0% optionality range was Materials.
- 8. ¹Comments and opinions expressed reflect solely the personal views of Anthony Lombardi as of 12/31/19, and not any other individual or firm. Such views are not a recommendation to buy or sell any security, fund or portfolio. Any investment decision should be made in consultation with a financial advisor. DECEMBER 2019 INVESTMENT COMMENTARY1 Investment Performance. For the December quarter, our LCV portfolio generated total return of 7.1% vs the Russell 1000 Value (R1KV) return of 7.4%, and broader S&P 500 return of 9.1%. For the year, our LCV portfolio generated total return of 18.9% vs R1KV return of 26.5% and broader S&P 500 return of 31.5%. During the past five quarters, the swing in portfolio performance has been notable. The negative 4Q18 absolute total return represented the weakest quarter, while the absolute total return of our LCV portfolio in 1Q19 marked the strongest since inception. Despite a modestly positive absolute return in 2Q19, our portfolio’s relative underperformance of ~-295bps (vs R1KV) in 2Q19 was the weakest since inception, while relative underperformance of ~340bps vs the broader market (S&P 500) was the second weakest since inception. For 4Q19, such underperformance tightened to ~-35bps and ~-200bps vs R1KV and S&P 500, respectively. Compared to the R1KV, relative performance in 4Q19 was driven by Security Selection (~-80bps), with Allocation providing an (~45bps) offset. Compared to the S&P 500, Security Selection detracted ~-160bps, while Allocation detracted an additional ~40bps. For the rolling 1-year, our portfolio’s relative underperformance of ~-760bps vs R1KV was driven by weak Security Selection ~-1,020bps, offset by a contribution of ~+260 from Allocation. Compared to the S&P500, rolling 1-year underperformance of ~-1,255bps was driven principally by Security Selection with a modest offset from Allocation. Despite the weaker short-term relative performance, and a market environment characterized by significant volatility, our portfolio’s returns on a rolling 2-year and 3-year basis remain meaningfully above that of our primary style benchmark, the R1KV. As noted in prior commentaries, most critical in our discipline is the ability to protect in downside market environments, by an unrelenting focus on MOS and process, given long-term preservation of capital has much more to do with absolute loss of capital than upside return participation. We remain humbly confident our process and execution will continue to prove beneficial in this dynamic over the long-term. Of note, since inception, in 10 of 15 quarters the R1KV has posted quarterly total return below 5.00%. Our LCV portfolio’s cumulative outperformance for these sub-5.00% R1KV quarters totals ~+415bps. Our portfolio’s characteristics continue to reflect a disciplined, contrarian and value-oriented process. As illustrated in the tables on page one, staying mindful of general market valuation levels, and more importantly that of our LCV portfolio, has long remained paramount. Heading into 2018, the protection offered by the valuation discount in our portfolio versus our primary benchmark and the broader market was significant and served us well during market weakness experienced in the front- and back-end quarters of the year, while also allowing for upside capture during 2Q18 & 3Q18. While generally comfortable with the investment backdrop, during late 4Q17 and throughout 2018 we had alluded our radar remained dialed-up to material, incremental valuation multiple migration without corresponding fundamentals improving. As a result, we made increasingly active moves in the portfolio during 2018 and 2019, to solidify cheapness, as well as desensitize some cyclicality. As evidenced by outperformance in our longer-term comparative investment returns, our re-positioning has proved beneficial in the 2-yr and 3-yr window. Despite this longer-term outperformance, our LCV portfolio remains materially cheaper across nearly every valuation metric, notably boasting higher FCF & dividend yields, lower P/E’s (trailing & forward) and EBITDA multiples, and lower P/S and P/B compared to the broader S&P 500 and R1KV, the latter our primary benchmark. At period-end, meaningful valuation gaps between our LCV portfolio and R1KV remained intact, with FCF yield and EV/EBITDA being notable examples at a ~+340bps premium and ~18% discount (vs R1KV), respectively. In lieu of the interest rate backdrop, and growing appetite by company managements to take on incremental financial leverage, we have continued to keenly monitor balance sheet trends, as well as EBITDA multiples. Having first eclipsed 9x during 3Q18, our portfolio’s EV/EBITDA
- 9. ¹Comments and opinions expressed reflect solely the personal views of Anthony Lombardi as of 12/31/19, and not any other individual or firm. Such views are not a recommendation to buy or sell any security, fund or portfolio. Any investment decision should be made in consultation with a financial advisor. DECEMBER 2019 INVESTMENT COMMENTARY1 multiple hit a new high of 9.4x in 4Q19. Comparatively, however, our portfolio remains at a discount to both the S&P 500 and R1KV EV/EBITDA multiples of ~12.4x and ~11.4x, respectively. Particularly noteworthy is the continued valuation divergence between Growth and Value having attained material levels garnering our attention the past few quarters. From attribution standpoint, 4Q19 Selection drag exceeded positive contribution from Allocation. Specifically, versus the R1KV, Security Selection and Allocation during December quarter amounted to ~-80bps and ~+45bps, respectively. Consumer Discretionary, Communication Services, Real Estate and Financials were the most significant contributors in total attribution, while Staples, Materials, Technology and Industrials were the most significant detractors. By Allocation, Technology, Real Estate and Utilities sectors had the largest positive attribution, while Consumer Discretionary and Healthcare were the largest detractors. By Stock Selection, Consumer Discretionary, Communication Services and Financials were the largest contributors, while Technology, Staples, Materials and Industrials were the largest drags. On an absolute basis, three sectors in our portfolio posted negative returns quarter/quarter, led by Materials, Utilities and Staples. By comparison, only the Real Estate sector in the R1KV was marginally down, sequentially. Our targeted cash position of 4.00% was up 100bps at end of 4Q19 vs 3Q19, as our bias for liquidity remained a compelling proposition considering underlying valuations, the broader backdrop and our desire to have flexibility. Intra-quarter, market value cash peaked at ~7%, the highest since inception but within our permitted process range. For the full quarter our cash position was a drag of ~-25bps given the strong upside performance for the R1KV. Technology: DECREASE weighting -300bps; 1 FULL position sale; 3 rebalance trades: 17.0%-->14% We had been cyclically biased for an extended period, with TECH amongst the most significant sector allocations providing related exposure in our LCV portfolio. During latter part of 2017 and much of 2018 we were active in reallocations and rebalances within TECH given material appreciation in position holdings, all which occurred in the shadow of the broader market’s growth-oriented rally. The fact that we have continued to be active within TECH is not surprising given the sector has been a key market driver and our process forces a natural reallocation amongst portfolio holdings. In conjunction with the full sale of AAPL, we further reduced our Technology sector weighting (-300bps) to 14%. Beginning in 3Q18, we began a methodical, process-driven reduction in Technology from 22% to the current 14%, executed via full SALEs of CA (3Q18, -500bps), CSCO (2Q19, -300bps) and AAPL (4Q19, -300bps), offset by one new full position BUY (3Q18, +300bps). In addition to the sale of AAPL in the most recent quarter, we continued to remain active within TECH, touching all three of our remaining position holdings, two UP and one DOWN to target weight. Cumulatively, our activity in 4Q19 represented ~425bps of aggregate portfolio market value, including the 300bps target weight previously assigned to AAPL. Compared to the S&P 500, our portfolio’s target weight allocation for TECH at the end of 4Q19 represented an underweighting of ~- 920bps, although still a material overweighting of ~775bps versus R1KV. Our process compliant maximum weight for TECH was ~35% at quarter-end, while providing significant headroom in portfolio exposure should compelling opportunities present, increasingly highlights the valuation expansion that has occurred in the sector for which we remain quite mindful. Notable in this regard is ~40% of the market capitalization within the S&P 500 Tech sector is comprised of 2 stocks, AAPL & MSFT, both commanding high valuations. An incremental ~10% of sector capitalization is represented by V & MA, which are not only high multiple stocks, but Financial-oriented business models classified within the TECH sector. Thus, applying a 50% discount to the year-end weighting of the TECH sector (23.2%) results in an effective opportunity set much closer to our current target weight of 14%.
- 10. ¹Comments and opinions expressed reflect solely the personal views of Anthony Lombardi as of 12/31/19, and not any other individual or firm. Such views are not a recommendation to buy or sell any security, fund or portfolio. Any investment decision should be made in consultation with a financial advisor. DECEMBER 2019 INVESTMENT COMMENTARY1 Full Sale of AAPL: For the past 20+ years, we have actively followed and completed detailed research and analysis on the overall Technology sector, and AAPL specifically. At inception of our LCV portfolio in 1Q16, we added AAPL with an initial target weighting of 4.00% (at ~$96), increased to 5.00% target in 3Q16, reduced to 3.00% in 2Q18 and fully exited in 4Q19 (~$265). During our holding period we also executed several rebalances of AAPL, relative to its target weighting. During mid-2013 AAPL had become an increasingly compelling Value opportunity as its shares declined nearly ~50% from 2012 high, resulting in attractive valuation multiples combined with strong balance sheet metrics and innovation potential, the latter having become questioned by sell- and buy- side market participants. Additional concerns centered around the ability of the company to grow (due to skepticism pertaining to the “law of large numbers”) revenues and market capitalization. While the shares recovered to new highs, and valuation expanded into mid-2015, they again presented another compelling Value opportunity in early 2016 when the share price experienced a decline of ~30%, dropping below $100. Having never shared the market concerns regarding AAPL’s ability to innovate or grow, and with an exceptionally strong balance sheet and free cash generation, we took full advantage of this entry level in the shares at inception of our LCV portfolio. Our decision to purchase AAPL was valuation and business model driven. With respect to the latter, AAPL offered as compelling relative to the sector, with a dominant presence in its core smartphone market, a customer base loyal to its ecosystem, significant global footprint, expanding services business and an innovative and shareholder-oriented management. Specifically, at time of our purchase, AAPL was $530 billion in market cap, an AA+-rated balance sheet, possessed $216 billion in cash, $63 billion debt, $9 billion intangibles and was generating nearly 40% gross margins, 22% net margins and $50+ billion in FCF. Such a powerful foundation provided ample financial resources to innovate, grow and/or acquire whatever management/board desired, as well as attend to dividends and share buybacks. Importantly, such financial characteristics, in our opinion, provided an attractive cushion that translated to exceptional MOS in the shares. Despite its sizeable presence in its end markets and capitalization, as well as one of the most prominent sector names, AAPL shares had materially underperformed on an absolute and relative basis during the year leading into our initial purchase. Specifically, compared to -7%, -5%, -6% and -10% for the S&P500, S&P Tech Sector, Russell 1000 Growth and Russell 1000 Value, AAPL posted a total return of -26%. In terms of valuation, at time of purchase, AAPL’s strong balance sheet was joined by compelling multiples: 10.3x P/E, 10.6x P/Est, 0.7x PEG, 2.3x P/S, 4.1x P/B, 2.3% Dividend Yield, 11.6% FCF Yield, 5.0x EV/EBITDA, low cap ex intensity (~5%) and long-term debt/cap < 30%. Sentiment on (widely followed) AAPL was favorable, with 85% BUYs vs 15% HOLD/SELL and 12-month price target 40% above then current levels. Since initial purchase, AAPL materially outperformed the broader market, growth benchmark, our primary Value benchmark and its sector. Specifically, AAPL posted an annualized total return of 33.1% compared to 15.9%, 18.9%, 13.0% and 26.3% for the S&P 500, R1KG, R1KV and the S&P Technology Sector, respectively. At time of sale, the shares reflected ~55% BUY vs 45% HOLD/SELL, a $255 12-month price target, 22.3x P/E, 20.3x P/Est, 1.8x PEG, 4.7x P/S, 13.0x P/B, 1.2% Dividend Yield, 4.8% FCF Yield, 13.5x EV/EBITDA, cap ex intensity (~5%), long- term debt/cap ~ 46%, Net Cash $98 billion and a AA+ credit rating. Revenues have climbed ~10% to $260 billion while gross margins having declined 200bps from ~40% in FY15 to ~38% in FY19, and net margins have similarly declined from 23% in FY15 to ~21% FY19. While management, innovation and balance sheet all remain strong, the market cap sits just shy of $1.5 trillion (~5% of S&P 500) and shares garner a materially higher valuation against modest margin degradation, less bullish sentiment, tailwinds of favorable share buybacks and entry of shareholder Berkshire Hathaway at lower prices. Having materially outperformed the broader market and
- 11. ¹Comments and opinions expressed reflect solely the personal views of Anthony Lombardi as of 12/31/19, and not any other individual or firm. Such views are not a recommendation to buy or sell any security, fund or portfolio. Any investment decision should be made in consultation with a financial advisor. DECEMBER 2019 INVESTMENT COMMENTARY1 sector, in our opinion AAPL no longer represented a compelling, contrarian holding for us. With our radar dialed up, increasing concerns regarding broader market valuation and more compelling opportunities elsewhere, we opted to fully exited our position in the quarter. Great company at a much more appropriate price. The reduction of -300bps in TECH provided opportunity to reallocate elsewhere in the portfolio, notably increased sector weighting in IND and Cash, the latter where our target was increased 100bps to 4.00%. Consumer Staples: DECREASE Sector weighting -100bps; 1 target reduced, 1 rebalance trade: 9.0%-->8.0% For the 2nd consecutive quarter, we reduced our target in CS -100bps, fully allocating funds to Communication Services, where we increased our sector weight +100bps. For Staples, our lower target weight implies a net increase of +300bps during the prior six quarters and places us at an equal weighting vs the S&P and R1KV. Recall our prior increased allocations to Staples followed a long period in which we believed it a fundamentally unattractive and overvalued sector, particularly when viewed in the context of our long-standing bullish view of macroeconomic and corporate profit trends. However, as noted in our September 2018 commentary, we are contrarians, seeking compelling valuations and MOS wherever present. With respect to Staples, we had remained patient and awaited the pendulum to swing increasingly in our direction, while simultaneously maintaining our high conviction level in more attractive cyclical sectors. Our last two quarterly moves to reduce allocation reflects continued recognition we will seek the most compelling value in the context of our fundamental views and investment process. Quite simply, in our opinion, too much optimism returned to the broader universe of stocks within the Staples sector while Comm Svcs offers more attractively valued opportunities, and MOS. Our revised Staples sector target weighting of 8.00% remains below the maximum weighting of ~11% allowed per process, reflective of discipline and our continued belief that more valuation compression, and/or business model stress may be possible. As we have noted in prior commentaries, CS has been among the most bruised defensive sectors given its representation in the S&P 500 was cut in half during the past decade, falling from 14% to less than 7% in 3Q18, before climbing back to end 4Q19 at 7.2%. It’s this same degradation which began presenting some contrarian opportunity, for which we have continued to remain disciplined and patient. Our most recent decrease of -100bps in Staples was in the same target position as in the prior quarter and for which we telegraphed the possibility in our 3Q19 commentary: “Should the market continue to reward this holding with material valuation expansion, we would not hesitate to take further action to reduce this position, including a full sale and potential sector weighting reduction.” In addition to the sector weight reduction, we also utilized available Cash to rebalance a holding UP to target during the quarter. Cumulatively, actions taken in the quarter comprised ~115bps of aggregate portfolio market value. Compared to the S&P 500 and R1KV, our portfolio’s target weight allocation for CS at quarter-end was an overweight of ~+80bps and underweight of ~-85bps, respectively. Communication Services: INCREASE weighting +100bps, 1 Rebalance trade to target: 10.0%-->11.0% Having raised our Comm Svcs sector weighting in 1Q19 and 3Q19, we added further exposure by an additional +100bps in 4Q19. The latest increase puts the portfolio at a slight overweight vs process benchmark weight for the first time. As was the case in 3Q19, we funded the increased allocation with an equal reduction in our Staples sector target weighting. We believe the increased allocation serves to cheapen the portfolio, sustain defensiveness and MOS, while also underscoring our conviction by deploying all the increase to an existing target position. We continue to like the mix of assets that comprise our Comm Svcs sector, as well as the available opportunity set vs more limited universe in Staples. Each of the three business models owned within Comm Svcs
- 12. ¹Comments and opinions expressed reflect solely the personal views of Anthony Lombardi as of 12/31/19, and not any other individual or firm. Such views are not a recommendation to buy or sell any security, fund or portfolio. Any investment decision should be made in consultation with a financial advisor. DECEMBER 2019 INVESTMENT COMMENTARY1 contributes secularly to our overall portfolio in various ways, and with favorable balance sheet and cash flow attributes. Additionally, we continue to believe our allocation provides defensive attributes, as well as leverage to participate in potential upside, to the economy and markets. We are mindful of the constitution of Comm Svcs, which has in its formulation legacy Telecom, Media and Technology. Thus, our continued decrease in Technology sector weight must be juxtaposed against our favorable actions in Comm Svcs. In addition to the target weighting increase, we also executed one rebalance DOWN to target during the quarter. Cumulatively, actions taken in the quarter comprised ~115bps of aggregate portfolio market value. At quarter-end, our target weighting in Comm Svcs represented an overweight of ~+60bps and ~+280bps, compared to the S&P 500 and R1KV, respectively. Given our process maximum weight of 15.6%, there is clearly untapped headroom should opportunity present. Industrials: INCREASE weighting +200bps; 1 new BUY; 1 target wtg decrease, 2 rebalances: 11.0%->13.0% Along with TECH, CD and FIN, the IND sector has comprised a significant part of our portfolio’s cyclical bias. As had been the case in TECH, we acted during the past year to reduce our IND target weighting, serving to desensitize cyclical risks, particularly when viewed in context of increases we made to HC, CS, Comm Svcs, UTES and Cash targets. During 4Q19, however, due to opportunities within and outside the sector, we took multifold action in IND that resulted in a 200bp increase in targeted sector weighting to 13%, a level near process maximum. Specifically, we identified a compelling new position, the BUY for which we allocated a 3.00% target weighting. Funding of this new target was made in part via a -100bps reduction to an existing IND position, as well as 200bps (of 300bps total) from the FULL SALE (and Tech Sector reduction) in AAPL. The reduction to an existing IND holding was necessary in order to remain compliant with our investment process which provides for bands of -0.5x to +1.5x vs the corresponding S&P 500 sector weighting. Additionally, two positions (one UP and one DOWN) were rebalanced to target weights during the quarter, one of which was the same position we ultimately reduced later in the period to fund our new IND holding. As we have stated in prior commentaries, we have continued to actively monitor several potential contrarian opportunities within IND, that were attractive from a fundamental and valuation perspective. The new position added in the quarter met these requirements, as well as fell neatly into key secular themes which we find compelling. At purchase, our new target holding had the following characteristics that are expected to provide downside risk mitigation: 12x P/E, 12x P/Est, 0.8x P/S, 1.8x P/B, ~8% FCF Yield est, ~8x EV/EBITDA est, long-term debt/cap < 40%, Net Debt/EBITDA ~1.5x and a BBB-rated balance sheet. Sentiment on the shares was neutral, with ~55% BUYs vs 45% HOLD/SELL, but down from a 5-year high of nearly 90% BUY-rated. Estimated 12-month price target had also declined ~50% within the past year. Cumulatively, actions we took within the IND sector during 4Q19 comprised ~520bps of aggregate portfolio market value, the largest component of this allocation driven by the new position BUY. Compared to the S&P 500 and R1KV, our newly raised 13% target weight allocation for IND at quarter-end represented an overweight of ~+395bps and ~+335bps, respectively. Cons. Discretionary: No Sector weighting change; 4 Rebalance trades to target: 12.5% Along with TECH, IND, and FIN, the CD sector has comprised a significant part of our portfolio’s cyclical bias. As has been the case in prior quarters, we relied upon compelling valuation and contrarian instincts during 4Q19 in seizing opportunity presented to execute rebalance trades in CD, raising two positions UP to target weightings (one which we did twice in the period) and a third position DOWN to target. While holdings in the CD sector have been a significant source of attribution drag during the past year, and we are cognizant of the fundamental
- 13. ¹Comments and opinions expressed reflect solely the personal views of Anthony Lombardi as of 12/31/19, and not any other individual or firm. Such views are not a recommendation to buy or sell any security, fund or portfolio. Any investment decision should be made in consultation with a financial advisor. DECEMBER 2019 INVESTMENT COMMENTARY1 reasons, our conviction in the positions remains steadfast for the long-term. We also take comfort in our CD rebalances given we have peeled off select cyclical exposure elsewhere in the portfolio, as well as having raised target weights in defensive sectors and cash. Cumulatively, actions taken in 4Q19 comprised ~200bps of aggregate portfolio market value. At quarter-end, our sector target allocation represented an overweight of ~+275bps versus the S&P 500 and ~+665bps versus R1KV. As with TECH, our process compliant maximum weight for CD at quarter-end provides headroom for additional portfolio exposure given an upside limit of ~15%. However, we remain quite mindful that AMZN comprises ~3% of the ~10% aggregate market capitalization weighting in the S&P 500 CD sector. Thus, our current CD target weight is quite full adjusting for this one name. Financials: No Sector weighting change; 2 Rebalance trades to target: 19.0% Along with TECH, CD, and IND, the FIN sector has comprised a significant part of our portfolio’s cyclical bias. Unlike TECH where our actions have been to reduce exposure resulting in a sector weight well below the process maximum, our targets for FIN, IND and CD are at or near upper constraints. As to FIN specifically, our conviction level remains high as we see compelling valuations, healthy balance sheets and contrarian aspects for companies we have targeted for position holdings. While we did not change our sector weighting in 4Q19, we did execute two rebalance trades DOWN to target comprising ~115bps of aggregate portfolio market value. Compared to the S&P 500 and R1KV, our portfolio’s target weight allocation for FIN at quarter-end was an overweight of ~+605bps and an underweight of ~-480bps, respectively. Energy: No Sector weighting change; 2 Rebalance trades to target: 3.0% We have had long-standing concerns with respect to the Energy sector. Select fundamental drivers are unlike any other sector, and we have repeatedly called it out to be a “quintessential value trap”. Our view has been reflected in our continued underweighting of the sector which has compressed meaningfully in its representation as a percentage of the broader market. Specifically, at year-end the S&P 500 Energy weighting was nearly ~4%, an all-time low, a level well off the ~15.0% weighting reached 10-years ago. At year-end our allowable process maximum for the sector was ~6.5% allocation, while the minimum was ~2%. Process has served us well with respect to managing our portfolio’s exposure to the Energy sector, where we ended the year at 3.0% target weight. Notably, we continually honor our investment process and rebalanced both ENE positions UP to target during the period. In 2Q19 we had rounded only one position UP, having not previously executed such a rebalance UP since 4Q17 owing to continued reductions in our sector target weight. While we are not expecting a sea change in terms of near-term fundamentals or radically altering our portfolio’s exposure, a 3-5 year investment horizon juxtaposed against much more appropriate washout in sentiment, select moderation in negative balance sheet and cash flow dynamics, long anticipated write-downs/impairments and record low market capitalization representation now serves to garner some of our contrarian interests. Cumulatively, actions taken in 4Q19 comprised ~70bps of aggregate portfolio market value. At quarter-end, our target weighting in ENE represented an underweight of ~-135bps and ~-520bps, compared to the S&P 500 and R1KV, respectively. Materials: No Sector weighting change; 1 Rebalance trade to target: 3.0% Given its market capitalization representation in the S&P 500, we have had one position holding in Materials (MAT) sector since inception. Compared to the S&P 500 and R1KV, our portfolio’s target weight allocation for MAT at quarter-end was an overweight of ~+35bps and an underweight of ~-130bps, respectively. At less than
- 14. ¹Comments and opinions expressed reflect solely the personal views of Anthony Lombardi as of 12/31/19, and not any other individual or firm. Such views are not a recommendation to buy or sell any security, fund or portfolio. Any investment decision should be made in consultation with a financial advisor. DECEMBER 2019 INVESTMENT COMMENTARY1 3.0% weighting in the S&P 500, the MAT sector presents optionality in our process to have 0% exposure, for which we have not exercised since inception. During 4Q19, we executed a rebalance trade UP to target weighting. Cumulatively, our actions taken in 4Q19 comprised ~45bps of aggregate portfolio market value. Utilities: No Sector weighting change; 1 Rebalance trade to target: 2.5% As noted in our December 2018 commentary, we believed our targeted holdings in Healthcare, Staples, Comm Svcs, along with our Cash allocation, provided defensive attributes against our cyclical exposures in the portfolio. As previously noted, including 4Q19, we have raised our Comm Svcs sector weight in three of the last four quarters. As to UTES, our process led us to make an active decision to increase sector exposure during 3Q19. Given the UTE sector in the S&P 500 was ~3.30% at quarter-end, this implies a 1.65% sector target minimum in our portfolio. Although we have previously stated a negative bias to UTEs exposure given concerns regarding aggregate valuation, long term prospect for rising interest rates and more compelling opportunities elsewhere, we honor the directive of our investment process. During 4Q19, we rebalance our lone UTE holding UP to target weight, cumulatively representing 25bps of aggregate portfolio market value. Combined with HC, Comm Svcs, Staples and Cash, our combined “defensive” allocation comprised ~35.5% at quarter-end, which should serve to solidify aggregate MOS. At 2.50% target weight, our UTEs exposure is an underweight of ~-80bps and ~-410bps compared to S&P 500 and R1KV, respectively. Health Care: No Sector weighting change; 1 Rebalance trade to target: 10.0% Although not nearly as negative as our CS stance, for some time we had viewed the HC sector as fundamentally unattractive in the context of our long-standing bullish view of macroeconomic and corporate profit trends. Its been more than a year (3Q18) since we raised our HC weighting +100bps to its current 10.0%, as the sector began to offer increasingly compelling valuation. We noted, at the time, were wading not diving into HC. That said, we always we remain cognizant of all parts of our process. While no change to sector or position holdings were made in 4Q19, we did execute 1 rebalance trade UP to target weight. For the quarter, rebalance actions in HC cumulatively represented a modest ~20bps of aggregate portfolio market value. Compared to the S&P 500 and R1KV, our portfolio’s HC allocation remains underweight vs both benchmarks, ~-420bps and ~-290bps, respectively. Should opportunity present, there is notable headroom given our process would permit a maximum weighting in HC of 21.3%, vs our current 10.0% target. Four sectors remain at target allocations of 3.00% or lower Our portfolio currently has four of eleven sectors retaining target weightings of 3.00% or less; Energy (3.00%), Materials (3.00%), Utilities (2.50%) and Real Estate (0.00%). Weightings in all these sectors remain in alignment with our broader investment views, expected backdrop, and, process discipline and constraints. Our portfolio actions have been in line with our commentary from 2Q19: “with our radar remained dialed up, our inclination remains one which is more likely to result in further moderation in our cyclical exposure should contrarian opportunities continue to present in traditionally more defensive sectors, implying that most of these sectors, ex- UTEs, are unlikely to be targeted for increased weighting. Cash allocation could also continue to play a part in such moderation.” As noted above, we executed the full sale of AAPL in 4Q19, further reduced our target weight in TECH, and increased our Cash target. We have found opportunity in IND, and the ongoing multi-year hemorrhage in ENE has played out in line with our expectations, to the point our contrarian instincts have been piqued on a selective basis.
- 15. ¹Comments and opinions expressed reflect solely the personal views of Anthony Lombardi as of 12/31/19, and not any other individual or firm. Such views are not a recommendation to buy or sell any security, fund or portfolio. Any investment decision should be made in consultation with a financial advisor. DECEMBER 2019 INVESTMENT COMMENTARY1 Cash target: INCREASE +100bps; in line with bias to MOS and flexibility: 3.0%-->4.0% As noted in our June 2018 commentary, we believed building cash an appealing position heading into 3Q18. During 4Q17, 1Q18 and 2Q18, such actions led to consecutively higher portfolio liquidity at the end of each period but in the context of no target weight change to cash. In 3Q18, however, we made an active decision to increase our portfolio’s cash target +100bps, to 2.50% from 1.50%. During 4Q18 we maintained our target at 2.50% but brought it down in 1Q19 given the late December sell off. With the strong 1H19 market rally and corresponding expansion in valuation multiples, we again took the opportunity in 2Q19 to solidify aggregate MOS in our portfolio with an increase in Cash target to 3.00% from 1.00%. During 4Q19, we further raised our Cash target +100bps, to 4.00%, funded in part by the -300bps full SALE in APPL and corresponding reduction in our TECH sector target weight. From a market value perspective, our Cash level was 2.8% at year-end, versus 3.0% at the end of September. We believe our actions and targeted Cash level continue to provide MOS and flexibility, in the context of a concentrated, 25-position LCV equity portfolio. Market and Economic Backdrop Since inception, we have repeatedly underscored our belief that a good amount of operating leverage existed that could be readily monetized for the benefit of shareholders/consumers should top-line revenue (& GDP) growth move sustainably higher; a dynamic that clearly played out and became consensus over the past four years. However, our vigilance works both ways and, as indicated in our commentaries during 2018-2019, our radar had been increasingly dialed up: “should macro-related conditions deteriorate, or it become(s) increasingly difficult to discover new compelling opportunities; valuation characteristics, balance sheet and/or cash flow attributes become more challenging, we will change course per process discipline.” Process, opportunities and MOS will always be our guide, which our ongoing allocation and rebalance actions reflect. We remain unsurprised by the pendulum action in the market, particularly in lieu of monetary and fiscal backdrops, geopolitical tensions, increased volatility and underlying emotional swings. As noted in our March 2018 commentary, we expected the style-shifting dynamic (Growth to Value) to have the potential to remain an underlying pillar during 2018, which would also align well against our investment process. We further stated in our December 2018 commentary, given the unraveling and unnerving that occurred in 4Q18, we expected this trend would continue in 2019-2020. While the market rebound witnessed during 1H19 fit neatly into these expectations, we maintained our focus upon our process discipline. Whipsaw action in 3Q19, and subsequent record close to the year only sought to affirm staying true to process and convictions was key. With our typical investment horizon of 3-5 years, we continue to believe we are looking squarely into a period that will have data points and fundamental developments serving to impact the underlying mosaic, requiring higher levels of emphasis on MOS for which we believe we remain prudently positioning our LCV portfolio. S&P 500 performance finishes out with record close; Growth surges over Value; Emerging Markets return. Quite a turn in a year. 4Q18’s broad, aggressive market sell-off, made a violent swing back towards beta in the 2019, led by one of the strongest quarters in a decade in 1Q19, with hockey stick strength-building during the remainder of year. Specifically, the broader market’s +13.7% 1Q19 total return was followed by a +4.3% in 2Q19, +1.7% in 3Q19 and +9.1% surge in 4Q19. For the quarter, the market was paced by Technology, Healthcare, Financials and Communication Services which posted total returns of +14.4%, +14.4%, +10.5% and +9.0% respectively. Real Estate was the only S&P 500 sector in the red, posting a -0.5% total return. The Fed’s “Pivot 2.0”, on the heels of its “pivot-to-patience” served as a major catalyst for the market in 2019 given monetary policy easing alleviated concerns about an inverted yield curve, and potential broader macro/earnings
- 16. ¹Comments and opinions expressed reflect solely the personal views of Anthony Lombardi as of 12/31/19, and not any other individual or firm. Such views are not a recommendation to buy or sell any security, fund or portfolio. Any investment decision should be made in consultation with a financial advisor. DECEMBER 2019 INVESTMENT COMMENTARY1 slowdown. Growth (as measured by Russell 1000 Growth Index—R1KG) posted a +10.6% total return in 4Q19, surging ahead of Value by ~+320bps. Emerging Markets (as measured by MSCI EM index) came back strong as well, posting a +11.8% total return on the heels of +9.9%, +0.7% and -4.2% in 1Q19, 2Q19 and 3Q19, respectively. As a result, EM’s rolling 2-year total return managed to escape from its deficit, ending at +0.8%. Global markets (total returns $USD) participated across all geographic theaters: Brazil +14.5% (vs -4.5% 3Q19), China +10.9% vs (-1.6% 3Q19), UK +10.8% (vs -2.3% 3Q19), Germany +9.6% (vs -3.8% 3Q19), Hong Kong +9.1% (vs -7.8% 3Q19), Swiss +8.6% (vs -0.2% 3Q19), Japan +8.1% (vs +2.7% 3Q19), France +7.1% (vs -1.4% 3Q19), Mexico +6.5% (vs -2.7% 3Q19), India +6.0% (vs -3.9% 3Q19) and Australia +5.1% (vs -0.6% 3Q19). On the heels of the prior quarter’s +1.2% the S&P 500 posted a +8.5% price increase, underperforming the R1KG at +10.3% and but well ahead of the R1KV at +6.7%. With respect to domestic markets, Technology, Healthcare, Utilities and Communication Services drove a large part of the positive attribution of Growth over Value. Industrials and Financials were the most significant detractors for Growth vs Value. As we noted in our prior commentaries, when comparing Growth vs Value, any performance differential will likely be driven, principally, by four sectors. Specifically, the most significant positive weighting differentials between Growth and Value at quarter-end remained Technology and Consumer Discretionary, while the most significant underweights were Financials and Energy. Between Growth and Value, Utilities continue to close the weighting gap differential to Energy. Specifically, the continued decline in Energy market capitalization, and underlying strength in Utilities has resulted in a ~660bps positive differential in Value vs Growth UTES weighting, nearing the ~795bps differential for Energy. Yield curve slope melt remains on radar; not a primary concern, but we are mindful of signal. As we have noted in prior commentaries, while mindful of curve inversion, our focus remains upon aggregate interest rate levels, cash flow, balance sheet dynamics, capital allocation and margin trends. Neither the slope of the curve, or it’s dynamics, at this juncture is a primary concern for us in this regard. Far be it from us to be Pollyanna, as our radar has been dialed up for several quarters, and we have highlighted ongoing adjustments in our portfolio positioning, many of which have had an increasingly defensive tilt. Should a sustained inversion pan out and be a function of, or related to, a deterioration in fundamentals, that would cause us to make further adjustments in our thinking and positioning. At the current time, we like the portfolio opportunities we have targeted, as well as the continued pace at which we have made underlying position changes. Across the term structure of the yield curve while there are modestly different dynamics, there is no question a broad melting of upward slope has occurred, signaling a notable change in the backdrop for which markets have reacted. In our 1Q19 commentary, we provided a detailed review of longer-term historical term-structure spreads, highlighting the average slope in the 2yr-10yr has been ~91bps (updated to include 4Q19) during the prior 40+ years, and ended 2019 at +34bps. There have been 4 notable inversion periods in this term structure, with each followed by a recession and each with successively lower absolute levels in the 10yr yield. Of the four inversion periods, the most severe occurred in the late ‘70’s-early ‘80’s, owing to the massive swings in volatility, the absolute level of interest rates (inflation, oil prices, etc.), the extraordinary duration of the inversion and the duration and deepness of the subsequent recession(s), which stretched from 1980-1982. It’s a time period we remember living through quite clearly. What gives us comfort as it relates to the current time period, is the low absolute level of interest rates, low level of inflation, high levels of employment & aggregate growth trends, the strong cash/balance sheet positions of companies in the aggregate, strong capital and liquidity position of banks, credit spreads that have not bubbled up to any of the extremes in prior cycles, ongoing expense/margin focus of
- 17. ¹Comments and opinions expressed reflect solely the personal views of Anthony Lombardi as of 12/31/19, and not any other individual or firm. Such views are not a recommendation to buy or sell any security, fund or portfolio. Any investment decision should be made in consultation with a financial advisor. DECEMBER 2019 INVESTMENT COMMENTARY1 management teams, the US’s more favorable position relative to other countries/markets (Developed & Emerging) and a Fed that hit the pause button and executed policy easing under “Pivot 2.0” to alleviate interim macro concerns. It’s these fundamentals that we will continue to monitor for any degradation, as well as any sustainable impacts from ongoing trade-related policies and negotiations, or any disruption caused by geopolitical fallout. While we believe emotional and psychological forces are contributing to the backdrop, our radar remains dialed up, as does our more intense focus upon aggregate MOS. 10-yr yield ranged 1.53% to 1.94%; higher floor in 4Q19 follows plummet from 7-yr high to near 5-yr low. Given U.S. interest rates and spreads, “pivot-to-patience” and “Pivot 2.0” by the Fed, subsequent policy easing, corresponding action in long rates, extended trade war and polarized political climate, our secular view on rates certainly became more intensely challenged during 2019. Specifically, we have long maintained that an extended path lower in interest rates ended several quarters ago—a view, at the time, founded upon broad expectations for improved economic growth, higher (but not runaway) inflation, and changes in monetary (tighter) and fiscal (expansionary) policy. We have also not shared the market’s concerns regarding short-end curve (upward) pressure and/or potential inversion. While the ~125bps decline in 1-yr Treasury yield since its November 2018 peak has served to affirm the view of less short-end pressure, a more significant inversion was present during 3Q19 given an intra-quarter decline in the 10-year below 1.50%--the bottom end of the range represented a near 180bps decline from November 2018 peak (a 7-year high). Increased uncertainty related to the ultimate outcome of Trade/Tariff negotiations, weaker economic data and a polarized political backdrop served as key drivers of the declining rate backdrop. Notable regarding the dramatic shift since November 2018, the intra- quarter low in 3Q19 did not breach the 5-year low of 1.36%, nor was there such pressure during 4Q19. Concurrent with this evaporation, however, yields continue to respond dynamically to various macroeconomic, fiscal and geopolitical factors—we believe such action will continue, particularly in lieu of “Pivot 2.0”, albeit not in perfect linear fashion. Against this dynamic rate backdrop, major US equity indices have been able to power to numerous record all-time highs, across several broader benchmarks. While this was not the case during 4Q18, as heightened fears of Fed policy error metastasized against the backdrop of a potential slowdown and/or fears of a recession, the powerful rally registered in 1H19 continued in 4Q19, with the S&P 500 attaining yet another new all-time high. 10-Yr Qtr-End 4Q15: 2.27% 2Q16: 1.47% 4Q16: 2.45% 2Q17: 2.31% 4Q17: 2.41% 2Q18: 2.86% 4Q18: 2.69% 2Q19: 2.01% 4Q19: 1.92%
- 18. ¹Comments and opinions expressed reflect solely the personal views of Anthony Lombardi as of 12/31/19, and not any other individual or firm. Such views are not a recommendation to buy or sell any security, fund or portfolio. Any investment decision should be made in consultation with a financial advisor. DECEMBER 2019 INVESTMENT COMMENTARY1 M&A and IPOs. Deal appetite spanning sectors and geographies seem to imply a return of confidence by management and boards to take on risk and allocate capital, while the weak post-IPO performance of new issues continued to reflect increasing blockage in investors digestive track. As we noted in prior commentary, a ramp in significant IPO activity, headlined by numerous, and sizeable issues, was expected to result in a calendar generating ~$1 trillion of new market value during 2019. However, withdraws by certain issuers, combined with shattered post-IPO price performance in a parade of names that only recently came to market served to remind investors about the importance of profitability basics. Perhaps most notable were the two most significant new issues coming to market in 4Q19 were internationally based: the long anticipated, but delayed, Saudi ARAMCO IPO and Alibaba’s Hong Kong debut. Among the headline M&A announcements in 4Q19 were: Xerox/HP Inc. ($32 bil hostile offer), Charles Schwab/TD Ameritrade ($30 bil stock), IFF Inc./DuPont Nutrition Biosciences ($25 bil, cash/stock), LVMH/Tiffany ($18 bil cash) and Fiat Chrysler/Peugeot ($15 bil stock). Dollar pullback following strength, giving back all 3Q19 gain. We have long been of the view that an overly dire outcome for the US Dollar would be an unlikely scenario in the near-to-intermediate term given the confluence of global events, relative strength of the U.S. economic backdrop, and perceived safety of U.S. capital markets. As noted in our March 2018 commentary, implications of any potentially sustained trade-related changes due to tariffs, negative or positive, certainly bears monitoring. For the quarter, the Dollar index (DXY) was on a sustained march down, declining ~3.0%, giving up all its gains in the prior quarter. The Dollar has held up reasonably well the past 4-5 years reflecting, in part, continued undercurrents in DC related to monetary, fiscal and trade-related policy, lower interest rates abroad, and flight to safety from regions outside the US. The Dollar’s strength has had negative impacts on several Emerging Markets during its continued run higher, some which remain under financial duress. The Fed’s “Pivot 2.0” and expectations for lower rates served as a catalyst for the Dollar to weaken during the tail end of 2Q19, while weaker ISM reports, Brexit resolution and China “Phase I” negotiations near completion contributed to pressure in 4Q19. For the rolling 1-year, the Dollar index ended essentially flat at 96.4. As noted in prior comments, the DXY remains well-above financial crisis lows of ~70 reached in 1Q08 and only ~6% off its 10-year high of ~103 in 1Q17. Gold safety = another increase of ~+3% Qtr, ~+18% 1-yr; Oil drops another 8%, and 50% off June 2014 high. As measured from 4Q14, while not hitting another 5-year high as was the case in 3Q19, Gold did tack on an incremental +3%, closing at $1,517. The metal has tended to catch bids on renewed fears and heightened volatility in other asset classes. Gold’s continued rise has occurred against a backdrop of the Fed’s “Pivot 2.0”, declining yields, continued long-term Dollar strength and a VIX that remained contained relative to its massive spikes in the prior 5 years. Despite a modest recovery in 4Q19 of ~+13%, and the recent IPO of Saudi ARAMCO, the front-end contract for WTI remains well-off its highs, closing at $61.06. At quarter-end, the commodity still sits nearly 45% below its June 2014 high. While we have been steadfast in our long-term pessimistic view for oil, underscoring numerous risks to include underlying oligopolistic variables, the Energy equity sector shrinkage to ~4% market cap representation may be finally approaching a decade long wash-out level. 3Q19 Real GDP +2.1% (y/y) and +2.1% (q/q); 4Q19E: +2.2% y/y, +1.9% q/q. Versus FY 2018, forward estimates for FY 2019, 2020 and 2021 are currently +2.3%, +1.8% and +1.9%, respectively, essentially unchanged vs 90 days prior. The slowing in 2020 is driven by a combination of Consumer and Government spending, reduced Investment and increased imports; 2021 is more heavily tilted to continuation of a Government spending
- 19. ¹Comments and opinions expressed reflect solely the personal views of Anthony Lombardi as of 12/31/19, and not any other individual or firm. Such views are not a recommendation to buy or sell any security, fund or portfolio. Any investment decision should be made in consultation with a financial advisor. DECEMBER 2019 INVESTMENT COMMENTARY1 slowdown and rising imports. As we have noted previously, a major infrastructure initiative, if passed, could serve to alter estimates, but we do not expect any material agreements to be solidified in the current political climate, not to mention a Presidential election year. We have repeatedly highlighted the underlying strength of the employment backdrop, which has yet to crack based on latest hiring trends and record low jobless claims. Versus crisis level losses of ~900k/month in 2008-09, the labor market has witnessed sustained improvement, generally posting nonfarm payroll gains of ~150k-300k/month since 2013, with the December print (for Nov figures) coming in at +266k, despite some weaker prints earlier in year due to policy uncertainties. We continue monitoring such releases given economic data points in the US, and globally, have illustrated some weakness during 2019, for which we remain mindful of in the context of portfolio exposures. Forward median forecasted payroll gains for 2019-2021 are in a range of ~108k-175k/month, levels which have held within our expectations, witnessing continued relative stability, despite modest downward revisions on upside of range. The unemployment rate has leveled at a multi-decade low, as well as remaining at post-recession lows of ~3.5%, having declined ~650 bps from its previous peak. Estimates for 2019-2021 have remained at these lower levels and currently stand in a 3.6%-3.7% range. The modest shift in economic data marking some slowdown, pivots by the Fed, elongated trade negotiations and polarizing political climate are all variables in the mosaic that bear continued watching for any sustained level of degradation in growth—all which is in line with our radar being dialed up and ongoing desensitizing of some cyclicality in the portfolio. Despite some spastic convulsions by the market during past year, we would reiterate FOMC commentary has continually underscored policy maker’s data dependency, including viewing through a global lens with eyes (peripherally) on more than just U.S. economic conditions. To this end, trade-related developments will certainly be scrutinized for any longer-term impacts that materially impact anticipated trajectory in growth and inflation, both which remain in the care and custody of the FOMC. We have repeatedly stated, monitoring price and wage inflation metrics remains at the forefront for us given the extended period for which global monetary stimulants have existed, and potential combustion when combined with any injected Fiscal accelerants. Despite occasional soft spots in economic data, we have been steadfast over the past several years that aggregate growth, wage and price pressure would continue to warm. However, inflation still bears the most burden versus history given increasing number of business models founded upon low-cost and/or price competition, a trend indirectly referenced by the Fed Chairman in early 2018 when alluding the Phillips curve having broken down relative to historical relationships. Specifically, many new business concepts successfully introduced within the past decade or two, have been premised upon high-volume, low-margin strategies, where price points and distribution are key competitive differentiators. Tax policy and subsequent corporate actions that led to bonus compensation, wage and hiring increases, and capital/resource investments suggest, however, that operating costs may have reached the point of headwind status, and serve to detract from incremental operating leverage, placing critical focus on monitoring margin trends. This continues to be where we see the more notable risks to the near-to- intermediate backdrop---a higher probability of moderating earnings growth via declining operating leverage, NOT an outright or severely deep economic recession, although this remains a potential risk. Our portfolio positioning actions during the past year have been mindful of these risk factors climbing the probability curve. Monitoring degree of offsets to tailwinds in the Five and Dime earnings picture remains paramount. Heading into 4Q19 earnings season, based on FactSet data, aggregate S&P 500 EPS on a reported basis are estimated to post a year/year decrease of ~-2.0%, vs +20% gains posted for FY18, and lower than the -1.6%, -0.4% and -0.3%
- 20. ¹Comments and opinions expressed reflect solely the personal views of Anthony Lombardi as of 12/31/19, and not any other individual or firm. Such views are not a recommendation to buy or sell any security, fund or portfolio. Any investment decision should be made in consultation with a financial advisor. DECEMBER 2019 INVESTMENT COMMENTARY1 reported declines in 3Q19, 2Q19 and 1Q19, respectively. Thus, this would be the fourth consecutive y/y quarterly earnings decline for the S&P 500. Compared to September 30th, estimated 4Q19 earnings growth for the S&P 500 has declined ~450bps from the +2.5% growth originally projected and continues a downtick trend from the massive jump in expectations witnessed heading into 2018. This is the sixth consecutive quarter in which estimates reverted to a typical trend of heading lower during a quarter. Prior trajectories during past earnings seasons leading into reports, had increased due to a combination of lower cuts by analysts, enacted tax legislation, regulatory climate, a reduced level of negative guidance by companies, and generally easing comps in the more pressured sectors. Prior to tax legislation, some of the easier comps were previously expected to fade but were pushed out due to the tax-related tailwind, serving to help spur momentum on the top and bottom line. Top line 4Q19 revenue growth forecasts of +2.6% have also declined ~100bps vs estimates at the end of 3Q19, implying continuation of incremental negative operating leverage. Furthermore, the current 4Q19 revenue estimate represents a sequential decline from the +3.7%, +4.0%, +5.3%, +7.2%, +9.2% and +10.1% revenue gains in 3Q19, 2Q19, 1Q19, 4Q18, 3Q18 and 2Q18, respectively. At current valuations, we remain biased to be more protective. We had a long-held bullish view on corporate fundamentals but have been more actively pulling in our horns during past 18 months. While aggregate profit margins implied in current forecasts, and overall condition of balance sheets continue to be factors helping to reinforce a relatively positive stance, we have clearly been mindful of offsets to tailwinds in the broader earnings picture, juxtaposed against valuation multiple expansion. Basic math of the market has supported the margin trajectory given the underlying mix and weighting of high-level sector contributors, notably Technology, representing more than ~23% of S&P 500 market cap. As called out in 3Q18, however, post the index reconstitution, TECH’s weighting was reduced due to Communication Services and Consumer Discretionary receivership of allocated market cap. As a result, TECH is currently only ~280 bps below its representation at quarter-end June 2018 due to 2019’s strong growth rally. Conversely, Energy sector’s weighting has been materially compressed over the course of the past few years and currently represents nearly ~4% of S&P 500 market cap, although it has transitioned from the precipice of negative comparisons. Notably, Energy earnings and revenue growth for FY18 were ~+112% and ~ +18%, but for FY19, the sector is expected to be fully out of the “anomaly” period, as estimated earnings and revenue growth dials down to DECLINES of -28% and -5%, respectively; levels well BELOW the broader S&P 500. Outside of Technology, Healthcare and Financials are near equals (14.2% & 13.0%) in market cap representation, with three additional sectors at ~9%-10% weights, but which also possess significant cyclical bias. With Tech, Healthcare, Financials and Communication Services comprising ~60%+ of the S&P market cap; Consumer Staples having absorbed material degradation in revenue, earnings and sentiment; additional tailwind of lower corporate taxes fully embedded in estimates; and resolution of geopolitical issues (notably trade/tariffs); it would appear revenue and earnings to be reasonably well-anchored in the near- to intermediate-term. That said, the current rate of growth for FY19 is closing in at near break-even levels, following prior expectations for a hockey-stick type trajectory. Should earnings decline in 4Q19 as expected, it will represent the 4th quarter in 13 for which there was a negative year-over-year comparison. On a reported earnings basis, only 5 of 11 sectors are expected to be in positive territory for 4Q19, led by Utilities, Financials, Health Care, Communication Services and Real Estate. Utilities is the only sector estimated to post double-digit gains, a result which had been more prevalent for multiple sectors in 2018. Among the weakest sectors will be Energy, Consumer Discretionary, Materials and Industrials. The most attention will remain on TECH due to its 23% sector representation and anchor position in the market’s growth-oriented rally.
- 21. ¹Comments and opinions expressed reflect solely the personal views of Anthony Lombardi as of 12/31/19, and not any other individual or firm. Such views are not a recommendation to buy or sell any security, fund or portfolio. Any investment decision should be made in consultation with a financial advisor. DECEMBER 2019 INVESTMENT COMMENTARY1 Degradation in the earnings outlook for FY19 vs June forecasts places current estimates for top-line growth at ~+3.8% (vs 4.4%) and earnings growth of ~+0.3% (vs ~2.6%), while FY20 has fell modestly to ~5.5% and ~+9.5%, around the levels which we affectionately call a “Five & Dime” market backdrop (5% top and 10% bottom-line growth). As noted in prior commentaries, enacted tax legislation initially generated some spare change, or cushion, against the original baseline sans tax. As quarters and fundamentals have rolled forward, however, the cushion and tailwinds have been eliminated, leading to heightened risks in the backdrop. By sector, the earnings picture has once again become more bifurcated, with Healthcare/Communication Services and Materials/Energy currently at the extreme tails of expectations for FY19. Unlike in prior quarters, the former are not immaterial sectors in market capitalization. With wider and more volatile distribution of earnings expectations across sectors, and with Technology revenue/earnings growth estimates having fallen below the aggregate index, the relevancy of monitoring all sectors has taken on increased importance. All else constant, the basic math of the market’s forward P/E suggests it has fully adjusted to a more expensive valuation based upon the underlying sector mix, alleviation of macro concerns and lower (discount) rate environment: Technology sector’s high profit margins and historically higher growth will remain under close examination at ~22x forward EPS; the Financial sector trading at ~13x forward EPS appears to have taken some comfort with yield curve and credit risks; the benefit of cyclical tailwinds have long played-out within Industrials and Consumer Discretionary, with trade issues and dollar strength adding headwinds; and Energy having witnessed another earnings cut again trades in line with the market average at 18x forward. As previously noted, with revenue and earnings moderation, profit margins in the aggregate and by sector will remain critical to monitor. We believe this to be a key determinant of the market’s ability to sustain and hit record levels or succumb to downside risk and/or subjected to higher volatility. As an active, concentrated LCV equity manager, we will continue our opportunistic pursuit, and do so against how we envision the 3- to 5-year time horizon unfolding. Bottom line: As contrarians, we have been attracted to many facets in the backdrop noted above, particularly those that underscore the fundamental and emotional swings that are part of any natural market environment. It is the short-to-intermediate term fluctuations which provide the right backdrop for us to position our portfolio for the long-term at both the sector and security level. While we repeatedly noted selective areas of the market as expensive, many of the cyclical areas within our value-based discipline had presented as quite compelling for quite some time. If one simply places on blinders, and focuses on the aggregate level of the market, to include broader market earnings growth, valuation metrics, GDP growth, and nominal debt levels the backdrop might have been viewed challenging. We always prefer to go deeper, into sectors and individual stocks, assess related fundamentals and metrics, place broader macroeconomic measures such as GDP growth into context, and break apart aggregate metrics such as debt into more relevant measures such as net debt, interest costs and service coverage ratios, etc. In so doing, we had been quite bullish as to the opportunity set in our concentrated yet diversified large cap value strategy. That is not to say the opportunity set would be the same for other investors in different or less-concentrated strategies. As long-term investors, we remain focused on executing a consistent process, buying cheapness and not over-paying for quality. As disciplined contrarians, mindful of capital protection, we had long found the cyclical sectors, ex-energy/commodities, home to stocks with the most compelling valuations relative to the broader market. Given our contrarian nature, we had also become cognizant of consensus having moved in our direction, although much of the change was back-end loaded post 2016 US elections, and not universal across the macroeconomic, sector or individual stock landscape. Nevertheless, as we have underscored during the past several quarters, we have grown increasingly sensitive
- 22. ¹Comments and opinions expressed reflect solely the personal views of Anthony Lombardi as of 12/31/19, and not any other individual or firm. Such views are not a recommendation to buy or sell any security, fund or portfolio. Any investment decision should be made in consultation with a financial advisor. DECEMBER 2019 INVESTMENT COMMENTARY1 to the shifts that have occurred, for which our portfolio decisions have reflected. With our radar dialed up for changes that cause swings in the pendulum too far in any one direction, we have made it a point to take actions to solidify cheapness in our portfolio and be protective of capital. We are not married to any stock or sector, as underscored by our position SALES during the course of the past 12-18 months (three within TECH), as well as our utilization of process permitted Cash levels. This is a transparent exercise and can clearly be seen in the valuation characteristics of our LCV portfolio as compared to the broader market, our key benchmark (R1KV) and the entire LCV equity peer group. Conviction is key for us and is reflected in our portfolio actions. Most importantly, with any company, it is those possessing characteristics strong in balance sheet and free-cash flow, combined with compelling equity valuation, that garner our attention--these remain the type of roommates we prefer when seeking opportunity and MOS. AAL Document is meant to be used in its entirety. Reference to prior quarterly and monthly publications is noted. Views expressed represent personal assessment of privately managed separate account and market environment as of the date indicated, and should not be considered a recommendation to buy, hold or sell any security, and should not be relied on as research or investment advice. Information is as of the date indicated and subject to change. All market and other related information relied upon and mentioned is from market data sources viewed as reliable. No guarantees are made regarding accuracy. Index returns are for illustrative purposes only. Index performance returns do not reflect any management fees, transaction costs or expenses. Indexes are unmanaged, and one cannot invest directly in an index. Past performance does not guarantee future results. The S&P 500 Index measures the performance of 500 mostly large-cap stocks weighted by market value and is often used to represent performance of the U.S. Stock market. The Russell 1000 Value Index measures the performance of the large-cap value segment of the U.S. equity universe. It includes those Russell 1000 companies with lower price-to-book ratios and lower forecasted growth values. The Russell 1000 Growth Index measures the performance of the large- cap growth segment of the U.S. equity universe. It includes those Russell 1000 companies with higher price-to-book ratios and higher forecasted growth values. Russell Investment Group is the source and owner of the trademarks, service marks, and copyrights related to the Russell Indexes. Russell® is a trademark of the Russell Investment Group. iShares® Funds are distributed by BlackRock Investments, LLC. The iShares Funds are not sponsored, endorsed, issued, sold or promoted by Russell Investment Group. Nor does this company make any representation regarding the advisability of investing in iShares Funds. BlackRock is not affiliated with the company listed above. iShares® and BlackRock® are registered trademarks of BlackRock, Inc., or its subsidiaries. MSCI Emerging Market index is an index created by Morgan Stanley Capital International (MSCI), designed to measure equity market performance in global emerging markets. The Emerging Markets Index is a float-adjusted market capitalization index. MSCI®, and the MSCI index names are registered trademarks of MSCI Inc. or its affiliates. Where noted, S&P 500® Index, Russell 1000® Value Index, Russell 1000® Growth Index, iShares® Russell 1000 Value ETF and MSCI® Emerging Market Index are referenced with abbreviations and respective footnotes. Abbreviations include S&P 500, R1KV, R1KG and MSCI EM. Use of iShares ETF for a respective index is footnoted accordingly and/or mentioned as such. Performance commentary comparisons are made in reference to iShares, unless otherwise noted. Performance quoted represents past performance and does not guarantee future results. Investment return and principal value of an investment will fluctuate, and when sold, may be worth more or less than original cost. Returns for less than one year are not annualized.