June 2019 Investment Commentary & Performance
•
1 like•96 views

Second Quarter 2019 Market & LCV Portfolio Review

Recommended
Recommended
More Related Content
What's hot
What's hot (20)
Similar to June 2019 Investment Commentary & Performance
Similar to June 2019 Investment Commentary & Performance (20)
More from Anthony A. Lombardi, CFA
More from Anthony A. Lombardi, CFA (20)
Recently uploaded
Recently uploaded (20)
June 2019 Investment Commentary & Performance
- 1. ¹Comments and opinions expressed reflect solely the personal views of Anthony Lombardi as of 6/28/19, and not any other individual or firm. Such views are not a recommendation to buy or sell any security, fund or portfolio. Any investment decision should be made in consultation with a financial advisor. JUNE 2019 INVESTMENT COMMENTARY1
- 2. ¹Comments and opinions expressed reflect solely the personal views of Anthony Lombardi as of 6/28/19, and not any other individual or firm. Such views are not a recommendation to buy or sell any security, fund or portfolio. Any investment decision should be made in consultation with a financial advisor. JUNE 2019 INVESTMENT COMMENTARY1 Pivot 2.0, A Toy Story: “Beyond…To Infinity!” Feed Me! The market’s insatiable appetite for protein to fuel its continued growth has not only led to expectations for multiple Federal Reserve interest rate cuts, but a willingness to readily absorb a significant level of IPO activity, as well as increasingly assign ever higher valuation multiples across the traditional growth complex, resulting in expanded multiples versus the rest of the market, notably value. A new form of derivatives are increasingly in play, although not premised on financial instruments, but rather companies with business models that offer plant-based meat; cannabis-oriented products from beverages, recreational-, CBD- and medicinal-oriented; ride-sharing companies offering basic taxi and other delivery services yet providing no clear path to near- or intermediate-term profitability; commercial real estate owner/developers offering shared office space that apparently can easily front-run their IPO with a potential multi-billion dollar credit line; and commitments of billions of dollars to SPACs (where capital may sit idle and not be deployed for years) at the fastest pace since the onset of the global financial crisis. Investment process and conviction remain keys for us, particularly against the backdrop of a playground filled with emotional swings in the market, led in part by a “pivot-to-patience” first signaled by the Fed earlier this year, and more recently “Pivot 2.0” in which the Fed has signaled multiple, potential interest rate cuts having entered the calculus. We remain quite mindful playtime for the kids of the market may be a relatively short recess, with some finding themselves in after school detention for pushing around, and bullying valuations too hard. Infinity is not a good mindset when pricing assets.
- 3. ¹Comments and opinions expressed reflect solely the personal views of Anthony Lombardi as of 6/28/19, and not any other individual or firm. Such views are not a recommendation to buy or sell any security, fund or portfolio. Any investment decision should be made in consultation with a financial advisor. JUNE 2019 INVESTMENT COMMENTARY1 As illustrated below, at the end of 2Q19, the disparity between Growth and Value reached very wide levels, a gap that would be even more significant utilizing our LCV portfolio valuation metrics. While only one part of a broader mosaic, such data points have increasingly served to drive our intense focus upon capital protection measures in our portfolio actions during the past year, even if that generates underperformance in our portfolio returns in the short-term. At the core, the market is a discounting mechanism, and we remain vigilant as to where the pendulum swings at any given point. As noted in the past, cumulatively, such swings serve as building blocks in our constant assault seeking out opportunities for entry into, and exit from, investment positions. Most importantly, as inoculated value investors, we place a premium on staying true to our investment process with an unrelenting focus on MOS (margin of safety). As we have for three decades in this business, we vigilantly listen--to the market, the macro backdrop, sector and company news flow, and the corresponding swings in investor psychology. With our typical investment horizon targeted at ~3-5 years, implicit in such a holding period is not simply low turnover (and low cost), but a time-period integral to an investment discipline undeterred by short-term events and emotions. Given our large cap value process is contrarian, high-conviction, and concentrated, we need not scramble adjusting our long-standing views, or portfolio positioning, due to weekly, monthly or quarterly events. As part of our disciplined implementation, we overlay longer-term secular views pertaining to the broader macroeconomic and market backdrop, resulting in active sector and stock exposures. The foundation of our disciplined investment process and philosophy does not allow for it to be radically altered, nor portfolio stock
- 4. ¹Comments and opinions expressed reflect solely the personal views of Anthony Lombardi as of 6/28/19, and not any other individual or firm. Such views are not a recommendation to buy or sell any security, fund or portfolio. Any investment decision should be made in consultation with a financial advisor. JUNE 2019 INVESTMENT COMMENTARY1 selection and sector allocation be impacted in the same vein. Given investment backdrops do not formulate overnight, portfolio construction, in our opinion, should be the result of a broader mosaic that does not succumb to near-term emotions and current events. Whether a function of near- or intermediate-term fundamentals, and/or investor psychology, our focus remains on recognizing, assessing and seizing upon valuations that potentially present opportunities, be they BUY or SELL. We like how our portfolio positioning has migrated over the past three years, unwavering on process discipline, and always mindful of the ever-evolving mosaic. Portfolio Positioning & Review Having deployed capital advantageously during 1Q19, with liquidity kept on hand by having kept our guard up, we returned to a higher cash bias during 2Q19, further solidifying MOS through a combination of active portfolio changes. Recall, during 4Q17, 1Q18, 2Q18, 3Q18 such actions led to consecutively, yet methodically, higher portfolio liquidity at the end of each period. Notably, in 3Q18, we made an active decision to increase our cash target +100bps, to 2.50% from 1.50%, in combination with an active decision to reduce allocations to TECH, IND, and CD, while increasing allocations to HC and CS (Staples). While our cash target of 2.50% was not raised during 4Q18, we believed it prudent to maintain, while also acting to incrementally desensitize cyclical exposures by further reducing ENE and correspondingly increasing CS sector target weights. The latter continuing our nibbling in a defensive sector that had, at the time, only recently become somewhat compelling. Our contrarian genes and available opportunity set aided in keeping our hand steady in the aftermath of the market’s emotional gyrations in 4Q18, leading us to take additional actions during 1Q19. Notably, we reduced our target Cash level 150bps, eliminated our exposure to the Real Estate sector, while increasing our target weights in CS and Comm Services sectors. Given the strong reversal in the market during 1H19, combined with valuation expansion witnessed, we furthered previous moves in the portfolio during 2Q19 by actively reducing our target weighting in TECH, increasing our weighting in CS (Staples) and raising our Cash target to its highest level since inception (3.00%). As noted in prior commentaries during 2018, we chose not to ignore strong performance in our portfolio, coincided against broader equity market appreciation, select underlying valuation multiple expansion, upward traction in interest rates and potentially more challenging forward earnings comparisons during the next two years. While interest rate traction appears to have stalled for the moment, we continue to believe our actions serve to reinforce a protective mindset, while still maintaining an optimistic long-term posture in our portfolio positioning. By prudently underscoring our focus on overall MOS, the portfolio’s performance was served well during a volatile 2018 and, following our actions in 1Q19 & 2Q19, we believe is positioned well for the second half of 2019 and beyond. We are not concerned about more recent relative underperformance, as our focus remains on the long-term horizon, and the risk/reward prism we are viewing through. Our LCV portfolio exposure remained allocated to 10 of 11 sectors, with an emphasis on issues possessing compelling valuations, financial statement strength, and where near-term psychology serves to compensate for risk, providing the inherent MOS we seek when investing over a 3- to 5-year time horizon. Straying to own safety at any price has never been an acceptable paradigm as our value conscious and investment process simply will not allow us to pay any multiple for quality. We don’t do Growth, we don’t do GARP; it doesn’t mean such styles are without credibility. While important to understand and have perspective of such styles, they are simply not our belief or process approach, nor have they ever been. We have always been hardwired, contrarian, value investors, conscious of risk factors, and continually viewing through a risk/reward prism, in active pursuit of opportunities providing the right balance. We seek companies offering a combination of cheapness, a contrarian view, possessing stable long-term balance sheets and attractive FCF characteristics. That said, we are never
- 5. ¹Comments and opinions expressed reflect solely the personal views of Anthony Lombardi as of 6/28/19, and not any other individual or firm. Such views are not a recommendation to buy or sell any security, fund or portfolio. Any investment decision should be made in consultation with a financial advisor. JUNE 2019 INVESTMENT COMMENTARY1 married to one view as valuations, sentiment and process drive our decision-making. By way of example, such patience paid dividends during 2H18 & 1Q19 as we felt the combination of our long-term time horizon and valuation compression in certain defensive areas hit risk/reward levels that became appealing. As opportunities present themselves, we have increasingly nibbled and reallocated our portfolio with a contrarian mindset. Despite having maintained a higher cash target during the past few quarters, we are still finding, buying and remaining owners of cheapness, MOS and compelling free cash flow (FCF), while at the same time we are sellers when valuation criteria or process constraints are breached. As to the latter, our decision to reduce our Technology sector weighting via a full position Sale of a long-term holding during the second quarter reflected such discipline. Not only has deployment of investable capital in this manner been more acceptable to our contrarian, value-based discipline, but also in recognition that forward long-term returns are typically related to point-of-entry valuation multiples. When juxtaposed against our belief favorable operating leverage opportunities still exist in the economy, and amongst companies we target, we remain steadfast in how we aim to position our LCV portfolio. Clearly, however, as evidenced by our positioning changes during the past year, such opportunities are not as vast, nor inexpensive as was the case 5-10 years ago. Key Trades & Attribution We seeded our concentrated LCV strategy during the first quarter 2016. Since inception, as opportunities have been presented, we have made several active portfolio decisions, at both the stock and sector level. During 2Q19, notable actions included: Sector/Cash Target Weighting Changes: o Cash (+) o Consumer Staples (+) o Information Technology (-) Position Target Weighting Changes & Rebalance Trades across several sectors: o Technology o Consumer Staples o Consumer Discretionary o Communication Services o Materials o Industrials o Financials o Healthcare o Energy One FULL position SALE, two FULL spinoff SALEs, and two sector weight changes; 26 portfolio holdings. Our activity level remained high in the second quarter (2Q19) given opportunities presented in the backdrop, allowing us to underscore our convictions and remain steadfast in executing our investment process. While our investment discipline is generally characterized by low turnover, when action is dictated by process, we execute accordingly—there is never hesitation with a stated process. We have repeatedly stated that we neither date, nor fall in love with any stock or sector, nor attempt to justify going beyond embedded process constraints as reasons for portfolio exposures. Our target sector weightings are influenced by top-down and bottom-up views,
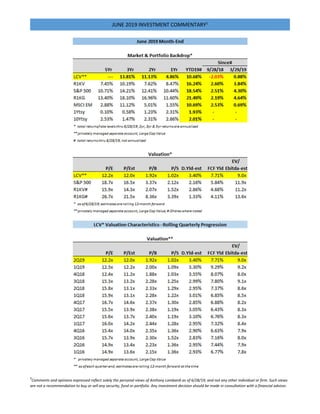
- 6. ¹Comments and opinions expressed reflect solely the personal views of Anthony Lombardi as of 6/28/19, and not any other individual or firm. Such views are not a recommendation to buy or sell any security, fund or portfolio. Any investment decision should be made in consultation with a financial advisor. JUNE 2019 INVESTMENT COMMENTARY1 while fundamentals, valuation and psychology drive stock level decisions. For the second consecutive quarter, we executed full position SALEs (including spin-off related), amongst other activity which included changes to two (2) sector target weightings and numerous rebalance (up and down) trades to position target weightings, cumulatively touching nine (9) sectors. Given the strength of the market rebound off late December levels, combined with broader market valuation levels, we returned to our prior bias for higher Cash and defensiveness. Recall our actions in 2018 to reduce sector weightings in Technology, Industrials, & Consumer Discretionary, while also increasing sector weightings in Consumer Staples and Healthcare. We further built upon this portfolio trend during the first and second quarter of 2019, by eliminating exposure to Real Estate (1Q19), increasing Communication Services (1Q19), increasing our Staples sector weighting (1Q19 & 2Q19), lowering our Technology sector weighting (2Q19), and increasing our Cash target (2Q19). At the end of 2Q19, there were a total of 26 target positions held in our LCV portfolio, diversified across 10 of 11 sectors. We do not view portfolio actions taken during 2018-2019 as wholesale changes, but continuation of measured and timely modification to our long-standing optimistic stance, founded upon our investment process for which we had long pre- telegraphed. Indicative of this migration is the combined underweight allocation to HC and CS, which stood at only -145bps at quarter-end, a vastly different level compared to nearly -1,200bps at the end of 3Q16; a shift that occurred through a combination of valuation compression and active portfolio allocation decisions. Perhaps most notably, we increased our target weighting in CS by 500bps during the past year, a sector we had long abhorred due to valuation and fundamentals. On a weighted average basis, the market capitalization of our portfolio holdings was $136.6 billion, a decline of 5.5% compared to the prior quarter, a level of decline greater than the portfolio’s total return of +0.9% during the same period. The decrease in capitalization reflects portfolio changes we made in sector and target holding weightings during 2Q19, notably a full position sale in Technology where the security’s market cap was ~$240 billion. Further, we increased our Staples weighting +100bps, allocating to an existing security where the market cap was below $100 billion, as well as raising our Cash target. MOS remains our principal guide for which we are compelled by process to follow. Quarter-end target and market value weights for our LCV portfolio are detailed below.
- 7. ¹Comments and opinions expressed reflect solely the personal views of Anthony Lombardi as of 6/28/19, and not any other individual or firm. Such views are not a recommendation to buy or sell any security, fund or portfolio. Any investment decision should be made in consultation with a financial advisor. JUNE 2019 INVESTMENT COMMENTARY1 On a market value basis, we ended 2Q19 with 3.1% cash, significantly higher vs 1.0% in 1Q19. Our cash target weighting had been raised to 2.5% from 1.5% during 3Q18, remain unchanged in 4Q18, reduced during 1Q19 to 1.0% and raised to 3.0% in 2Q19. Recall, from a process perspective, our targeted cash range is designed to provide flexibility, to allow for repositioning within a highly concentrated, yet diversified portfolio. As noted, our LCV portfolio comprised just 26 total equity positions at quarter-end. While we are long-term investors, we have a stated preference to monetize winners, and/or sell-down positions based on discipline, in so doing avoid placing capital at risk by simply holding investments as place-markers or allowing exposures to become excessive when selective rebalance is more appropriate. MOS is paramount for us and is critical in limiting potential downside. Holding a position that has attained valuation levels no longer representative of attractive risk/reward only serves to create undo diversification risk and is simply an unacceptable practice. With protection of capital a covenant we are unwilling to break, we firmly believe in utilizing process-permitted cash level when situations dictate, to adhere to this core investment principle. Similarly, significant rebalancing trades we have executed serve to protect capital in very much the same way. And, when process and valuation present opportunity, we look to not only reallocate capital but deploy excess cash levels accordingly. Such discipline is among several key distinguishing characteristics in our process. We simply have no penchant to manage a portfolio structured with individual positions not representative of our high convictions, and firmly believe in a concentrated list of holdings, yet one diversified across market sectors. As we have noted previously, with our sector band targets set at 0.5x to 1.5x respective S&P 500 capitalization weights, should a sector’s size fall materially below certain predefined thresholds our process further allows for optionality for a 0% sector target with redeployment of available capital into other sectors, or Cash. Recall we utilized this 0% optionality with the Real Estate sector during 1Q19. At quarter-end, the only other sectors near, or within this 0% optionality range included Materials and Utilities. Investment Performance. For the June quarter, our LCV portfolio generated total return of 0.9% vs the Russell 1000 Value (R1KV) return of 3.8%, and broader S&P 500 return of 4.3%. For rolling one year-ended June 2019, our LCV portfolio generated total return of 4.9% vs R1KV return of 8.5% and broader S&P 500 return of 10.4%. During the past three quarter’s, the swing in performance has been notable. The negative 4Q18 absolute total return represented the weakest quarter, while the absolute total return of our LCV portfolio in 1Q19 marked the strongest since inception. Despite a modestly positive absolute return in 2Q19, our portfolio’s relative underperformance of ~-295bps vs R1KV in 2Q19 was the weakest since inception, driven primarily by Security Selection, with a partial offset provided by Allocation. Compared to the broader market (S&P 500), where underperformance of ~-340bps was the second weakest since inception, Security Selection detracted ~-390bps, while Allocation served as a modest offset. For the rolling 1-year, our portfolio’s relative underperformance of ~-360bps vs R1KV was driven by weak Security Selection ~-515bps, offset by a contribution of ~+160from Allocation. Compared to the broader market, rolling 1-year underperformance of ~-560bps was driven by drags in Security Selection of ~-530bps and Allocation of ~-30bp. Despite weak quarterly relative performance in 1Q19 and 2Q19, and a market environment characterized by significant volatility, our portfolio’s returns on a rolling 2- year and 3-year basis remain meaningfully above that of our primary style benchmark, the R1KV. As noted in prior commentaries, most critical in our discipline is the ability to protect in downside market environments, by an unrelenting focus on MOS and process, given long-term preservation of capital has much more to do with absolute loss of capital than upside return participation. We remain humbly confident that our process and execution will continue to prove beneficial in this dynamic over the long-term.
- 8. ¹Comments and opinions expressed reflect solely the personal views of Anthony Lombardi as of 6/28/19, and not any other individual or firm. Such views are not a recommendation to buy or sell any security, fund or portfolio. Any investment decision should be made in consultation with a financial advisor. JUNE 2019 INVESTMENT COMMENTARY1 Our portfolio’s characteristics continue to reflect a disciplined, contrarian, and value-oriented process. As illustrated in the tables on page one, staying mindful of general market valuation levels, and more importantly that of our LCV portfolio, has long remained paramount. Heading into 2018, the protection offered by the valuation discount in our portfolio versus our primary benchmark and the broader market was significant and served us well during market weakness experienced in the front- and back-end quarters of the year, while also allowing for upside capture during 2Q18 & 3Q18. While generally comfortable with the investment backdrop, during late 4Q17 and throughout 2018 we had alluded our radar remained dialed-up to material, incremental valuation multiple migration without corresponding fundamentals improving. As a result, we made increasingly active moves in the portfolio during 2018 to solidify cheapness, as well as desensitizing some cyclicality. As evidenced by outperformance in our longer-term comparative investment returns, our re-positioning has proved beneficial in the 2-yr and 3-yr window. Despite this longer-term outperformance, however, our LCV portfolio still remains materially cheaper across nearly every valuation metric, notably boasting higher FCF & dividend yields, lower P/E’s (trailing & forward) and EBITDA multiples, and lower P/S and P/B compared to the broader S&P 500 and R1KV, the latter our primary benchmark. At period-end, meaningful valuation gaps between our LCV portfolio and R1KV remained intact, with FCF yield and EV/EBITDA being notable examples at a +303bps premium and 20% discount (vs R1KV), respectively. In lieu of the interest rate backdrop, and growing appetite by company managements to take on incremental financial leverage, we have continued to keenly monitor balance sheet trends, as well as EBITDA multiples. Having first eclipsed 9x during 3Q18, our portfolio’s EV/EBITDA multiple hit a new high of 9.2x in 1Q19, driven in part by our decision to increase target weights in Consumer Staples and Communication Services. At end of 2Q19, this multiple remained near its high, at 9.0x. Comparatively, however, our portfolio remains at a discount to both the S&P 500 and R1KV EV/EBITDA multiples of ~12x and ~11x, respectively. Noteworthy is the valuation divergence between Growth and Value which has ascended to levels that have grabbed our attention the past few quarters. From attribution standpoint, 2Q19 drag from Selection far exceeded positive contribution from Allocation. Specifically, versus the R1KV, Security Selection and Allocation during June quarter amounted to ~-370bps and ~+75bps, respectively. Energy, Staples, Communication Services and Real Estate were the most significant contributors in total attribution, while Consumer Discretionary, Financials and Technology were the most significant detractors. By Allocation, Energy, Healthcare and Real Estate sectors had the largest positive attribution, while Energy and Consumer Discretionary were the largest detractors. By Stock Selection, Staples and Communication Services were the largest contributors, while Consumer Discretionary and Financials were the largest drags. On an absolute basis, four sectors in our portfolio posted negative returns quarter/quarter, led by Energy and Consumer Discretionary. By comparison, only the Energy sector in the R1KV posted a sequential decline. Our targeted cash position was increased to 3.00% in 2Q19, up 200bps sequentially, as our bias to build liquidity became a compelling opportunity considering underlying valuations and our target weighting reduction in the Technology sector. For the full quarter our cash position was a negative contributor juxtaposed against a respectful upside performance by the R1KV, resulting in ~-10bps of attribution drag. Technology: DECREASE weighting -300bps; 1 FULL position SALE: 20.0%-->17.0%; 3 rebalance trades: 20.0% We have been cyclically biased for an extended period, with TECH amongst the most significant sector allocations providing related exposure in our LCV portfolio. During latter part of 2017 and much of 2018 we were active in reallocations and rebalances within TECH given material appreciation in position holdings, all which occurred in
- 9. ¹Comments and opinions expressed reflect solely the personal views of Anthony Lombardi as of 6/28/19, and not any other individual or firm. Such views are not a recommendation to buy or sell any security, fund or portfolio. Any investment decision should be made in consultation with a financial advisor. JUNE 2019 INVESTMENT COMMENTARY1 the shadow of the broader market’s growth-oriented rally. The fact that we have continued to be active within TECH is not surprising given the sector has been a key market driver and our process forces a natural reallocation amongst portfolio holdings. During 2Q19, with continuation of a strong rally off December trough, we executed one FULL position SALE and three position rebalances, two down to target, and a third up to target weight. Cumulatively, our activity in the quarter represented ~470bps of aggregate portfolio market value, the largest component of this allocation driven by the FULL SALE of Cisco Systems (CSCO). Full Sale of CSCO: For the past 20 years, we have actively followed and completed detailed research and analysis on the TECH sector, and CSCO specifically. At inception of our LCV portfolio, CSCO was added with an initial target weighting of 4.00%--subsequently increased to 5.00%, and ultimately lowered to 3.00% (in 2 separate - 100bps reductions)--prior to its subsequent sale in 2Q19. More notable, our research and valuation work conducted in mid-2011, with the shares trading at ~$16 (less than 10x forward EPS) ultimately led to an investment position in the company, premised on multiple identified positive investment factors which remained relevant at the time of our LCV portfolio’s seeding in 1Q16. CSCO’s share price performance over the past 10-yrs, and since inception of our LCV portfolio, have performed well against fundamental improvement, successful execution of both an executive management and business model transition (including divestitures, acquisitions and organic investment/growth), combined with favorable balance sheet and cash flow dynamics; to include shareholder friendly capital management. Specifically, at time of sale, CSCO’s 10-yr total return was +261%, compared to +478%, +281% and +224% for the S&P Tech sector, S&P500 and R1KV, respectively. Although generally subpar comparatively over the past 10-years, share price performance improved during our holding period, whereby the stock generated +126% total return, versus +108%, +59% and +47% for the S&P Tech sector, S&P 500 and R1KV, respectively. At time of sale, sentiment on CSCO shares reflected a generally bullish view, with a ~65%/35% Buy/Hold-Sell consensus opinion, as compared to a 40%/60% respective split 10 years ago. Further, consensus 12-month target price for CSCO was $55 versus $37, 2-years prior. During the previous 1.5 years relative to our full sale, consensus EPS had climbed +25%, to $3.83. Although CSCO management has successfully been transitioning the business model to software/services/security, the legacy router/switching business (high margin, high cash flow, low/declining growth) still serves to keep valuation multiples below several other prominent Tech companies. That said, CSCO valuation multiples have climbed materially, evidenced by FCF yield of 5.4%, 14.2x EV/EBITDA, 16x fwd P/E, 21x LTM P/E, 5.8x P/B and 5.0x P/S. Perhaps most notably, the market has rewarded CSCO with high valuation relative to its expected growth, and the company’s net cash position has burned lower owing to aggressive (and favorable) capital management. Specifically, CSCO’s PEG ratio (utilizing FY2 estimates) was 2.1x at time of our sale, versus 1.0x 10-yrs ago and 0.7x at the 2008 low. Net cash as a percentage of market cap was 4.7% at time of sale, versus 20.0% 10 years prior. While we take no issue with management, its execution, nor the quality of the company’s balance sheet and its strong cash flows, CSCO was simply not as compelling, nor contrarian as was the case 10 years ago, nor at time of inception of our LCV portfolio. Our increasing concerns regarding broader market valuation levels, for which Tech has played an integral part, combined with contrarian opportunities elsewhere, led us to reallocate CSCO’s 3.00% target weighting into Staples and Cash. At our newly lowered 17.0%, compared to the S&P 500, our portfolio’s target weight allocation for TECH at the end of June represented an underweighting of ~-445bps, although still a material overweighting of ~1,105bps versus R1KV. Our process compliant maximum weight for TECH was ~32% at quarter-end, providing significant
- 10. ¹Comments and opinions expressed reflect solely the personal views of Anthony Lombardi as of 6/28/19, and not any other individual or firm. Such views are not a recommendation to buy or sell any security, fund or portfolio. Any investment decision should be made in consultation with a financial advisor. JUNE 2019 INVESTMENT COMMENTARY1 headroom in portfolio exposure should compelling opportunities present, while also highlighting the valuation expansion that has occurred in the sector for which we are increasingly mindful. Consumer Staples: INCREASE Sector weighting +100bps; 1 target raised, 2 rebalances to target: 9.0%-->10.0% For the 4th consecutive quarter, we raised our target in CS +100bps, and fully allocated the increase to an existing target position, thus raising our CS target weight +500bps during the past four quarters. We had long believed CS to be fundamentally unattractive and overvalued, particularly when viewed in the context of our long- standing bullish view of macroeconomic and corporate profit trends. However, as noted in our September 2018 commentary, we are contrarians, seeking compelling valuations and MOS wherever present. With respect to CS, we remained patient and awaited the pendulum to swing increasingly in our direction, while simultaneously maintaining our high conviction level in more attractive cyclical sectors. Of note, the increase in Staples weighting was funded by the 300bps made available by our FULL SALE of CSCO in Tech, a reallocation that reflects our contrarian DNA quite strongly. Despite four consecutive quarterly increases, it is notable our CS sector target weighting of 10.00% remains below the maximum weighting of ~11% allowed per process, reflective of discipline and our belief that more valuation compression, and/or business model stress was, and still may be possible. One need not look further than the hemorrhage in shares of Kraft Heinz, Kellogg, Conagra, Kroger and others throughout the sector as proof statement. As we have noted in prior commentaries, CS has been among the most bruised defensive sectors given its representation in the S&P 500 was cut in half during the past decade, falling from 14% to less than 7% in 3Q18. It’s the same degradation that has recently begun presenting some contrarian opportunity, for which we have remained disciplined and patient. In addition to the most recent increase of +100bps allocated to an existing target position, we also rebalanced it up later in the quarter, while also separately rebalancing down another position to target weighting. Cumulatively, actions taken in the quarter comprised ~195bps of aggregate portfolio market value. Compared to the S&P 500 and R1KV, our portfolio’s target weight allocation for CS at quarter-end was an overweight of ~+275bps and ~+125bps, respectively. Materials: No Sector weighting change; 3 Rebalance trades to target, 2 Spin-Off related sales: 3.0% Given the market capitalization representation in the S&P 500, we have had one position holding in the Materials (MAT) sector since inception. Compared to the S&P 500 and R1KV, our portfolio’s target weight allocation for MAT at quarter-end was an overweight of ~+20bps and an underweight of ~-145bps, respectively. At less than 3.0% market cap weighting in the S&P 500, the MAT sector presents optionality in our process to have 0% exposure, for which we have not exercised since inception. During 2Q19, we executed 3 rebalance trades UP to target weighting, 2 which were tied directly to corporate actions resulting in spinoffs of separately traded public companies from our one holding. As the new entities did not align with our fundamental interests from a portfolio construction perspective, and presented undesirable risk/reward, we opted to execute FULL sales of each, and redeploy into our existing MAT holding. Prior to either of the two spins, we had executed the 1st of 3 rebalances in this same holding. Cumulatively, including sales of the “spin co’s”, our actions taken in 2Q19 comprised ~370bps of aggregate portfolio market value, of which ~180bps was related to the sales. Cons. Discretionary: No Sector weighting change; 5 Rebalance trades to target: 12.5% Along with TECH, IND, and FIN, the CD sector has comprised a significant part of our portfolio’s cyclical bias. As has been the case in prior quarters, we relied upon compelling valuation and contrarian instincts during 2Q19 in seizing opportunity presented to execute rebalance trades in CD, raising two positions UP to target weightings,
- 11. ¹Comments and opinions expressed reflect solely the personal views of Anthony Lombardi as of 6/28/19, and not any other individual or firm. Such views are not a recommendation to buy or sell any security, fund or portfolio. Any investment decision should be made in consultation with a financial advisor. JUNE 2019 INVESTMENT COMMENTARY1 both twice in the period. Still yet another position holding was rebalanced DOWN to target. While holdings in the CD sector have been a significant source of attribution drag during the past year, and we are cognizant of the fundamental reasons, our conviction in the positions remains steadfast for the long-term. We also take comfort in our CD rebalances given we have peeled off some cyclical exposure in the portfolio as well has having added to cash target during the past year. Cumulatively, actions taken in 2Q19 comprised ~195bps of aggregate portfolio market value. At quarter-end, our sector target allocation represented an overweight of ~+230bps versus the S&P 500 and ~+655bps versus R1KV. As with TECH, our process compliant maximum weight for CD at quarter-end provides headroom for additional portfolio exposure given an upside limit of ~15%. However, we remain quite mindful that AMZN comprises ~3.5% of the 10% aggregate market capitalization weighting in the S&P 500 CD sector. Thus, our current CD target weight is quite full when adjusting for this one name. Industrials: No Sector weighting change; 2 Rebalance trades to target: 12.0% Along with TECH, CD, and FIN, the IND sector has comprised a significant part of our portfolio’s cyclical bias. As has been the case in TECH, we acted during past year to reduce our IND target weighting, serving to desensitize cyclical risks, particularly when viewed in context of increases to CS, HC, Comm Svcs and Cash targets. That said, we continue to actively monitor several potential contrarian IND opportunities where sentiment is negative, and additions could prove compelling to our portfolio at more attractive valuations. During 2Q19, we executed 2 rebalance trades in IND, both DOWN to target weightings. Cumulatively, actions taken in the quarter comprised ~80bps of aggregate portfolio market value. Compared to the S&P 500 and R1KV, our portfolio’s target weight allocation for IND at quarter-end was an overweight of ~+265bps and ~+230bps, respectively. Financials: No Sector weighting change; 1 Rebalance trade to target: 19.0% Along with TECH, CD, and IND, the FIN sector has comprised a significant part of our portfolio’s cyclical bias. Unlike TECH and IND, however, we have acted during the past year to increase our target weighting in FIN given our conviction level, compelling valuations and healthy balance sheets of the companies we are targeting for position holdings. While we did not change our sector weighting in 2Q19, we did execute one rebalance trade DOWN to target comprising ~50bps of aggregate portfolio market value. Compared to the S&P 500 and R1KV, our portfolio’s target weight allocation for FIN at quarter-end was an overweight of ~+590bps and an underweight of ~-440bps, respectively. Healthcare: No Sector weighting change; 2 Rebalance trades to target: 10.0% While not as negative as our CS stance, for some time we had viewed the HC sector as fundamentally unattractive in the context of our long-standing bullish view of macroeconomic and corporate profit trends. However, in 3Q18 we raised our weighting +100bps to its current 10.0%, utilizing significant appreciation in target holdings in cyclical sectors for redeployment to the underperforming, underweight HC sector which had begun to offer increasingly compelling valuation. At the time, we noted that we had been wading, not diving into the sector. That said, we always we remain cognizant of all parts of our process. While no change to target weights were made during 2Q19, we did execute 2 rebalance trades, one UP and one DOWN to target weight. For the quarter, rebalance actions in HC cumulatively represented ~130bps of aggregate portfolio market value. Compared to the S&P 500 and R1KV, our portfolio’s HC allocation remains underweight vs both benchmarks, ~- 420bps and ~-290bps, respectively.
- 12. ¹Comments and opinions expressed reflect solely the personal views of Anthony Lombardi as of 6/28/19, and not any other individual or firm. Such views are not a recommendation to buy or sell any security, fund or portfolio. Any investment decision should be made in consultation with a financial advisor. JUNE 2019 INVESTMENT COMMENTARY1 Communication Services: No Sector weighting change; 1 Rebalance trade to target: 9.0% As noted in our December commentary, we believed our targeted holdings in Healthcare, Staples, Comm Svcs, along with our Cash allocation, comprising nearly 28% at year-end, provided defensive attributes against our cyclical exposures in the portfolio; and, we have also increasingly nibbled in HC and Staples during 2018-2019 as more compelling, select valuations have arose. On the heels of having raised our Comm Svcs sector weighting in 1Q19, we maintained our target in 2Q19. We did, however, execute one rebalance trade DOWN to target weighting in the quarter, comprising ~50bps of aggregate portfolio market value. We continue to like the mix of assets that comprise our Comm Svcs sector, with each of the three business models owned contributing secularly to our overall portfolio in various ways, and with favorable balance sheet and cash flow attributes. Additionally, we continue to believe our allocation provides defensive attributes, as well as leverage to participate in upside, both to the economy and markets. At quarter-end, our target weighting in Comm Svcs represented an underweight of ~-120bps and overweight of ~+100bps, compared to the S&P 500 and R1KV, respectively. Energy: No Sector weighting change; first rebalance trade UP to target in some time: 3.0% Our fundamental concerns with respect to the Energy sector remain unaltered, and we reiterate our belief the sector to be a quintessential “value trap”. Select fundamental drivers are unlike any other sector. Notably, the S&P 500 Energy weighting at quarter-end was ~5.0%, a level well off the ~15.0% weighting reached 10-years ago; and placing our allowable process maximum for the sector at ~7.6% allocation. The S&P Energy sector would require a market capitalization weight of at least 6% before forcing us to move our allocation higher on a process basis alone. That said, we honor our investment process and rebalanced one ENE position UP to target, the first such move since 4Q17. At quarter-end, our target weighting in ENE represented an underweight of ~-205bps and ~-625bps, compared to the S&P 500 and R1KV, respectively. Four sectors remain at target allocations of 3.00% or lower Our portfolio currently has four of eleven sectors retaining target weightings of 3.00% or less; Energy (3.00%), Materials (3.00%), Utilities (1.50%) and Real Estate (0.00%). Weightings in all these sectors remain in alignment with our broader investment views, expected backdrop, and, process discipline and constraints. With our radar remained dialed up, our inclination remains one which is more likely to result in further moderation in our cyclical exposure should contrarian opportunities continue to present in traditionally more defensive sectors, implying that most of these sectors, ex-UTEs, are unlikely to be targeted for increased weighting. Cash allocation could also continue to play a part in such moderation. Cash target: INCREASED +200bps: 1.00%-->3.00% As noted in our June 2018 commentary, we believed building cash an appealing position heading into 3Q18. During 4Q17, 1Q18 and 2Q18, such actions led to consecutively higher portfolio liquidity at the end of each period but in the context of no target weight change to cash. In 3Q18, however, we made an active decision to increase our portfolio’s cash target +100bps, to 2.50% from 1.50%. During 4Q18 we maintained our target at 2.50% but brought it down in 1Q19 given the late December sell off. With the strong 1H19 market rally and corresponding expansion in valuation multiples, we again took the opportunity in 2Q19 to solidify aggregate MOS in our portfolio with an increase in Cash target to 3.00% from 1.00%, combined with reduction in Tech and increase in Staples sector target weightings. From a market value perspective, our Cash level was 3.1% at quarter-end, versus 1.0% at the end of March.
- 13. ¹Comments and opinions expressed reflect solely the personal views of Anthony Lombardi as of 6/28/19, and not any other individual or firm. Such views are not a recommendation to buy or sell any security, fund or portfolio. Any investment decision should be made in consultation with a financial advisor. JUNE 2019 INVESTMENT COMMENTARY1 Market and Economic Backdrop Since inception, we have repeatedly underscored our belief that a good amount of operating leverage existed that could be readily monetized for the benefit of shareholders/consumers should top-line revenue (& GDP) growth move sustainably higher; a dynamic that clearly played out and became consensus over time. However, our vigilance works both ways and, as indicated in our commentaries during 2018, our radar had been increasingly dialed up: “should macro-related conditions deteriorate, or it become(s) increasingly difficult to discover new compelling opportunities; valuation characteristics, balance sheet and/or cash flow attributes become more challenging, we will change course per process discipline.” Process, opportunities and MOS will always be our guide, which our ongoing allocation and rebalance actions reflect. For much of this elongated recovery, the broader US equity market has been able to absorb a multitude of events, to include the ongoing political landscape at home; political investigations; technology data/privacy concerns; geopolitical tensions and events around the world, to include increasing crystallization on trade and tariffs; ongoing developments in North Korea; Brexit chaos; a fluctuating dollar; spiking market volatility; constant oil price reversals; hemorrhage in Emerging Markets; swings in economic data at home; rising corporate board governance issues; terrorist and civilian-based societal attacks; new Fed Chairman and member mix on FOMC; speed of monetary policy normalization through rate and balance sheet actions; related pivots and patience. More recently, volatility, pessimism and negative headlines arose like the Phoenix in 4Q18, driving a notable market sell-off, and the bifurcation of performance across investment styles and regions that had remained status quo witnessed a notable breakdown, only to be followed by a strong 1H19 reversal. We remain unsurprised by the pendulum action in the market, particularly in lieu of monetary and fiscal backdrops, geopolitical tensions, increased volatility and underlying emotional swings. As noted in our March 2018 commentary, we expected the style-shifting dynamic to have the potential to remain an underlying pillar during 2018, which would also align well against our investment process. As we stated in our December commentary, given the unraveling and unnerving that occurred in 4Q18, we expected this trend would continue in 2019-2020. While the market rebound witnessed during 1H19 fit neatly into these expectations, we maintain focus upon our process discipline. With our typical investment horizon of 3-5 years, we continue to believe we are looking forward squarely into a period that will likely have data points and fundamental developments serving to impact the underlying mosaic, resulting in higher levels of emphasis on MOS. In the context of the domestic political landscape, we find it noteworthy that any investor with a 5-year horizon must now view through a lens encompassing a time frame (2024) that captures, with 100% certainty, an electorate process resulting in a different Presidential administration, as well as mix in members of the US Senate, House and Gubernatorial positions. More specifically, over the next 5 years, the market will be discounting the impacts of subsequent policy agenda that will result from the following political backdrop: o 2020 Elections: Presidential, House (D’s control by 37 seats; all 435 up for vote), Senate (R’s control by 6 seats; 34 up for vote, 22 R, 12 D), Governor (R control by 4, 11 up for vote; 7 R, 4 D) o 2022 Elections: House (435 up), Senate (34 seats up for vote; 22 R, 12 D), Governor (36 up) o 2024 Elections: Presidential, House (435 up), Senate (33 up; 21 D, 10 R, 2 Ind), Governor (resid)
- 14. ¹Comments and opinions expressed reflect solely the personal views of Anthony Lombardi as of 6/28/19, and not any other individual or firm. Such views are not a recommendation to buy or sell any security, fund or portfolio. Any investment decision should be made in consultation with a financial advisor. JUNE 2019 INVESTMENT COMMENTARY1 S&P 500 performance adds to its strong first quarter showing with a 4.3% total return; Growth > Value The fourth quarter’s (2018) broad, aggressive market sell-off, made a violent swing back towards beta in the 1H19, led by one of the strongest quarters in a decade in 1Q19, with continued strength into 2Q19. Specifically, the broader market’s +13.7% total return was followed by a +4.3% total return in 2Q19. By sector, the market was paced by Financials, Materials, Technology and Consumer Discretionary which posted total returns of +8.0%, +6.5%, +6.1% and +5.3% respectively. Energy was the only S&P 500 sector in the red, at -2.8%. The Fed’s “Pivot 2.0” on the heels of its “pivot-to-patience” serverd to alleviate concerns about an inverted yield curve, and potential broader macro/earnings slowdown. Growth (as measured by Russell 1000 Growth Index—R1KG) posted a +4.6% total return, moderately outperforming Value by ~+80bps. Emerging Markets (as measured by MSCI EM index) managed to keep its head slightly above water, at +0.7% on the heels of posting a +9.9% total return in 1Q19. While EM’s rolling 1-year total return finally broke into the black, its comparative return remained well below growth, at ~1,005bps, representing a sizeable swing from its ~400bps rolling 1-year advantage at the end of 2Q17; a distinctive swing in just 2 years. Similarly, Value has also retained an edge over EM due to the depth and length of EM’s underperformance, swinging from a rolling 1-yr deficit of -1,825bps at end of 1Q18 to a favorable ~690bps differential at end of 2Q19; but ½ the advantage vs prior quarter. As to U.S. interest rates and spreads, despite the “pivot-to-patience” and “Pivot 2.0” by the Fed and corresponding action in long rates, our secular view has not changed. Specifically, we have long maintained that an extended path lower ended several quarters ago—a view, at the time, founded upon broad expectations for improved economic growth, higher (but not runaway) inflation, and changes in monetary (tighter) and fiscal (expansionary) policy. We have also not shared the market’s concerns regarding short-end curve (upward) pressure and/or potential inversion, as we have previously stated such concerns would alleviate over subsequent quarters---the near 100bps decline in 1-yr Treasury yield since the Nov 2018 peak has served to affirmed this view. Global markets (total returns $USD) ex-China, continued participating in 1H19 recovery with bifurcation across geographic theaters remaining a theme in the backdrop: Swiss +8.6% (vs +12.5% 1Q19), Brazil +7.7% (vs +2.5% 1Q19), France +7.5% (vs +11.1% 1Q19), Germany +7.1% (vs +7.8% 1Q19), Australia +6.8% (vs +12.4% 1Q19), Japan +3.2%(vs +7.0% 1Q19), India +2.9% (vs +8.0% 1Q19), Mexico +2.8% (vs +5.4% 1Q19), UK +0.9% (vs +11.6% 1Q19), Hong Kong +0.4% (vs +12.6% 1Q19) and China -9.2% vs (+38.0% 1Q19). For the quarter, on the heels of the prior quarter’s +13.1%, the S&P 500 posted a +3.8% price increase, modestly below the performance of the R1KG at +4.3% and slightly ahead of the R1KV at +3.2%. With respect to domestic markets, Technology, Energy and Consumer Discretionary drove a large part of the positive attribution of Growth over Value. Financials were the most significant detractor for Growth vs Value, followed by drags from Industrials and Healthcare. As we noted in our prior commentaries, when comparing Growth vs Value, any performance differential will likely be driven, principally, by four sectors. Specifically, the most significant positive weighting differentials between Growth and Value at quarter-end remained Technology and Consumer Discretionary, while the most significant underweights were Financials and Energy. Between Growth and Value, Utilities continue to close the weighting gap differential to Energy. Specifically, the continued decline in Energy market capitalization, and underlying strength in Utilities has resulted in a ~650bps positive differential in Value vs Growth UTES weighting, nearing the ~890bps differential for Energy. 10-yr yield ranged 1.99% to 2.60%; plummet from 7-yr high to close near low for quarter. Notably, the bottom end of the range, which came near quarter-end, represented a 125bps decline from November 2018 peak (a 7-
- 15. ¹Comments and opinions expressed reflect solely the personal views of Anthony Lombardi as of 6/28/19, and not any other individual or firm. Such views are not a recommendation to buy or sell any security, fund or portfolio. Any investment decision should be made in consultation with a financial advisor. JUNE 2019 INVESTMENT COMMENTARY1 year high). For the quarter, the 10-yr traversed a 61bps range, hitting an early-quarter high of 2.60% in mid- April, prior to its consistent decline in the final two months of the quarter. Increased uncertainty related to the ultimate outcome of Trade/Tariff negotiations remained a key driver of the declining rate backdrop, with macro- related slowdown concerns igniting the Fed’s “Pivot 2.0”. Despite the dramatic shift since November, the close at quarter-end did not breach the 2Q16 quarter-end low, nor the 5-year low of 1.36%. Although it has held at levels above these prior lows, counter to our prior comments, the 10-yr has now given up the entirety of the initial spike during the first few days following the 2016 US Presidential election. Despite this evaporation, yields are responding dynamically to various macroeconomic, fiscal and geopolitical factors—we believe such action will continue, particularly in lieu of “Pivot 2.0”, albeit not in perfect linear fashion. Against this dynamic rate backdrop, major US equity indices have been able to power to numerous record all-time highs, across several broader benchmarks. While this was not the case during 4Q18, as heightened fears of Fed policy error metastasized against the backdrop of a potential slowdown and/or fears of a recession, the powerful rally registered in 1H19 powered the S&P 500 to a yet another new all-time high during 2Q19. 10-Yr Qtr-End 4Q15: 2.27% 2Q16: 1.47% 4Q16: 2.45% 2Q17: 2.31% 4Q17: 2.41% 2Q18: 2.86% 3Q18: 3.06% 4Q18: 2.69% 1Q19: 2.41% 2Q19: 2.01% Yield curve slope melt still on radar; we reiterate we are mindful but it’s still not a primary concern. As we have noted in prior commentaries, while aware of potential curve inversion, our focus remains upon aggregate interest rate levels, cash flow, balance sheet dynamics, capital allocation and margin trends. Neither the slope of the curve, or it’s dynamics, at this juncture is a primary concern for us in this regard. Far be it from us to be Pollyanna, as our radar has been dialed up for several quarters, and we have highlighted ongoing adjustments in our portfolio positioning—largely which have been process and valuation driven. Should an inversion pan out and is a function of, or related to, a deterioration in fundamentals, that would cause us to make further adjustments in our thinking and positioning. At the current time, we like the portfolio opportunities we have targeted, as well as the pace at which we have made changes. Across the term structure of the yield curve there are modestly different dynamics, but generally there has been a broad melting of upward slope. Thus, there has been a notable change in the backdrop for which markets have reacted. Of note, we provided a detailed review of longer-term historical term-structure spreads in our first-quarter commentary. As we highlighted, over the prior 40+ years, the average slope in the 2yr-10yr has been ~95bps (updated to include 2Q19). There have been 4 notable inversion periods in this term structure, with each followed by a recession and each with successively lower absolute levels in the 10yr yield. Of the four inversion periods, the most severe occurred in the late ‘70’s- early ‘80’s, owing to the massive swings in volatility, the absolute level of interest rates (and inflation, oil prices, etc.), the extraordinary duration of the inversion and the duration and deepness of the subsequent recession(s),
- 16. ¹Comments and opinions expressed reflect solely the personal views of Anthony Lombardi as of 6/28/19, and not any other individual or firm. Such views are not a recommendation to buy or sell any security, fund or portfolio. Any investment decision should be made in consultation with a financial advisor. JUNE 2019 INVESTMENT COMMENTARY1 which stretched from 1980-1982. It’s a time period we remember living through quite clearly. What gives us comfort as it relates to the current time period, is the low absolute level of interest rates, low level of inflation, high levels of employment & aggregate growth trends, the strong cash/balance sheet positions of companies in the aggregate, strong capital and liquidity position of banks, credit spreads that have not bubbled up to any of the extremes in prior cycles, ongoing expense/margin focus of management teams, the US’s more favorable position relative to other countries/markets (Developed & Emerging) and a Fed that has hit the pause button, and signaled “Pivot 2.0”. It’s these fundamentals that we will continue to monitor for any degradation, as well as any sustainable impacts from ongoing trade-related policies and negotiations. While our prior comments stated we didn’t assign a high probability to monetary policy in which the Fed would cut rates, we did note that: “overnight, the Fed could easily (pivot once again) restore positive slope in the curve if it were inclined by its internal forecasts.” It is increasingly apparent “Pivot 2.0” will serve to help restore the positive slope, potentially alleviating macro concerns. It remains about expectations. We continue to believe data dependency will remain among the foundational pillars of monetary policy. For us, our thinking has not changed, in fact it has solidified, given we feel our expectations played out in prior quarters. We highlighted in past: “As previously noted, we are 10 years out from the global financial crisis, and on more stable economic ground, with improved conditions for corporate and consumer fundamentals. At this stage of the domestic economic, monetary and fiscal policy cycles, we remain less focused upon unit count of rate increases anticipated by the market and more biased to the level of potential rate changes, and the corresponding impact such step-changes could serve to vastly exceed market expectations….we would not be surprised to see a more fluid pace of change regarding monetary policy should situations warrant….and/or more action steps than currently discounted by the market.” To us, the market had an epiphany during 4Q18 and finally realized there was potential the Fed chair might indeed be leading the FOMC on a more rapid path to policy normalization (via combination of rates and/or balance sheet) than was generally assumed by consensus. As a result, expectations required adjustment as consensus was clearly surprised by the magnitude of the gap between potential and actual. The music and chairs reversed during 1Q19, as it was the Fed who had an epiphany, deciding to pivot, pause and be patient. During 2Q19, the Fed further shifted with “Pivot 2.0” as all indications point to a potential rate cut (cycle). We believe our comments in our 4Q18 commentary served to underscore such change and our investment philosophy and discipline: “Whether rate and balance sheet policy previously anticipated by the FOMC remain on course or are altered in some fashion based upon financial market signals, the wake-up call in 4Q18 on its own had value as a discount mechanism. As noted previously, a market with a swinging pendulum, rife with emotion, fits neatly into our process” The accelerated compression, and inversion at certain term structures, in the yield curve is just one example of more fluid changes in the backdrop versus a stale dynamic the market had been previously accustomed during much of the 10-year recovery. So too has been the related rise in equity market volatility whereby 2018-2019 has witnessed more severity than 2016-2017. Going forward, our expectations remain the same. Specifically, magnitude of changes in policy are expected to be justified by the macroeconomic backdrop—the latter which we have been positively disposed for some time and are expected to continue driving interest rate movements and broader policy agenda over the intermediate and long-term. As we have repeatedly noted, the underlying mosaic and interplay of Fed leadership, economic data points (domestic and international), Fiscal policy agenda and spending discipline, corporate balance sheet and profit trends will continue to be monitored. Secondary to
- 17. ¹Comments and opinions expressed reflect solely the personal views of Anthony Lombardi as of 6/28/19, and not any other individual or firm. Such views are not a recommendation to buy or sell any security, fund or portfolio. Any investment decision should be made in consultation with a financial advisor. JUNE 2019 INVESTMENT COMMENTARY1 these forces will be any longer-term impacts of sustained trade tariffs/negotiations across individual market sectors, which may, or may not change primary variables in the economic and business profit equations. Changes in capital allocations and management priorities remain key front-burners, playing out as expected. Our expectations had long been corporate actions would lead to a re-ranking of capital management priorities given a more a favorable tax code, increasing deregulation, improving economic activity and executive management confidence, along with a corresponding increase in capital and human resource investments. While such changes could have negative implications for the level and/or pace of share repurchases and dividend increases witnessed during the earlier stages of recovery, they also vary by sector. Continued strong underlying performance of the stock market and simple mathematics suggest lower marginal buying power of previously approved, and remaining buyback authorizations. Still further yet, Finance 101 suggests higher valuation multiples present as less appetizing to corporate CFO’s and treasurers, acting as an incremental constraint to share buybacks. Intermittent periods such as the broad decline in 4Q18, across market capitalizations and sectors, may temporarily present valuation multiples that are more appetizing for astute buyback activity. That said, we reiterate that with large repatriations of internationally domiciled cash, the possibility exists that some companies may still deploy part of this dry powder into “high multiple” buybacks. Technology is where a lot of liquidity resides, with several companies boasting cash-rich balance sheets, and several large acquisitions have been announced in the sector during the past 1-2 years. As we have previously alluded, however, one caveat with respect to Technology sector is the potential risks (and opportunities) related to data security/privacy which requires monitoring given it may increasingly cause redirection of cash for investment and/regulatory purposes. Material change to business models, particularly expectation for long term future growth and margins, remains notable to monitor, no matter the sector, or company. As is typically the case, earnings and free cash flow generation will serve as key drivers of the ultimate determinant of capital allocation across sectors and industries, led by the respective fundamental backdrops of each. The political winds that have stirred more recently about the inserting the hand of government into the capital allocation pot we find to be more about speculative drama, versus leading to real restrictions. M&A and IPOs. Deal appetite spanning sectors and geographies continues to reflect high confidence of management and boards to take on risk and allocate capital. Among the more notable M&A announcements in 2Q19 were: United Technologies/Raytheon ($90 bil stock), AbbVie/Allergan ($84 bil cash/stock), Occidental Petroleum/Anadarko Petroleum ($55 bil cash/stock), Eldorado Resorts/Caesars Entertainment ($27 bil cash/stock), Global Payments Inc/Total System Services ($25 bil stock), salesforce.com Inc/Tableau Software ($14 bil stock) and Pfizer Inc/Array BioPharma ($11 bil cash). The continued mix of sectors involved in deals during the quarter remains among a key highlight of deal activity. But, as we noted last quarter, perhaps the most notable news item has been the return of the IPO market in backdrop, headlined by numerous new and sizeable issues that in total are expected to result in an IPO calendar generating ~$1 trillion of new market value during 2019. Amongst the parade of names coming to market in 2Q19 on the heels of Lyft and Levi’s in 1Q19: Uber Technologies ($8bil), Chewy Inc ($1 bil), Slack Technologies ($1 bil via direct listing) and Crowdstrike Holdings ($0.7 bil). Pivots in volatility appear to track Trade, Fed and rates. 2Q19 volatility witnessed its most severe spike in early May on the heels of tweet activity by President Trump that more tariff hikes were likely on Chinese goods. As
- 18. ¹Comments and opinions expressed reflect solely the personal views of Anthony Lombardi as of 6/28/19, and not any other individual or firm. Such views are not a recommendation to buy or sell any security, fund or portfolio. Any investment decision should be made in consultation with a financial advisor. JUNE 2019 INVESTMENT COMMENTARY1 was the case in 1Q18, the beast seemed to be calmed with the signaling of “Pivot 2.0” by the Fed’s, as well as the renewed possibility that trade negotiations would get back on track with the help of a meeting of the minds at G-20 meeting late in the quarter in Japan. As measured by the CBOE (VIX), market volatility spiked midway through the quarter, hitting a high of ~23 following an early quarter low of ~11, before closing at ~15, which was the average for 2Q19. As we have noted previously, since 1990, a year marked by the precipice of a multiyear financial crisis (and recession) involving S&L’s and commercial banks, the low mark on the VIX has been ~9, and the average, ~19. Interestingly, the average level for the VIX actually declines, to ~15, when the time horizon is narrowed to just 2016-forward--a period that includes a February 2018 spike (to 50), an immediate, post-UK “Brexit” vote increase in late June 2016 (to ~26), November 2016 US election spike (~23) and the most recent 4Q18 spike (~36). During the current 10-year equity bull market, there have been only 5 periods in which the VIX spiked above 40, a level not breached by the 4Q18 market tantrum. In fact, the VIX had been relatively well- contained against prior FOMC decisions; confirmation of a (then) new Fed Chair, intra-meeting commentary regarding rate/balance sheet policy; swirling, divisive and emotional political winds blowing in Washington, tax legislation/enactment and reduced regulation, geopolitical events including trade/tariffs & disruptions across the globe, intermittent sell-offs in Tech (long the market’s anchor tenant), speculative swings in crypto currencies, cannabis plays and the recent return of the IPO market. Dollar trended modestly higher through May, before ending lower for quarter. We have long been of the view that an overly dire outcome for the US Dollar is an unlikely scenario in the near-to-intermediate term given the confluence of global events, relative strength of the U.S. economic backdrop, and perceived safety of U.S. capital markets. As noted in our March 2018 commentary, implications of any potentially sustained trade-related changes due to tariffs, negative or positive, certainly bears monitoring. For the quarter, the Dollar index (DXY) declined ~1%, giving up an intra-quarter gain of ~1% through late May. The Dollar has largely been holding up reasonably well the past 4-5 years reflecting in part, continued undercurrents in DC related to monetary, fiscal and trade-related policy, lower interest rates abroad, and flight to safety from regions outside the US. The Dollar’s strength has had negative impacts on several Emerging Markets during its continued run higher, some which remain under financial duress. The Fed’s “Pivot 2.0” and expectations for lower rates served as a catalyst for the Dollar to give back its intra-quarter appreciation during 2Q19. For the rolling 1-year, the Dollar index posted a modest 1% rise to 96.1. As noted in prior comments, the DXY remains well-above financial crisis lows of ~70 reached in 1Q08 and remains only ~7% off its 10-year high of ~103 in 1Q17. Gold safety good for another ~10%; Oil drops another 5%. As measured from 2Q14, Gold hit a 5-year high late in 2Q19, equal to $1,439. The metal has tended to catch bids on renewed fears and heightened volatility in other asset classes. During 2Q19 Gold built upon its +9% increase over the previous two quarters, rising +10% at the close. Gold’s rise occurred against a backdrop of the Fed’s Pivot 2.0, declining yields, continued Dollar stability and a VIX that remained contained relative to its massive spike in 4Q18. Following a nearly 40% decline in 4Q18, and +33% increase in 1Q19, oil’s performance reversed lower with the front-end contract for WTI finishing down 5%, closing at $58.47. More notable, crude declined nearly 18% intra-quarter, prior to rallying in the tail-end of the period. At the quarter-end price, the commodity still sits nearly 46% below its 5-year high (June 2014). As we noted in our September commentary, outages, logistic constraints and sanction-related constraints clearly had an impact on crude’s short-term move higher during 2018 but was not something for which we would peg any long-term modeling. Beyond risks and concerns we have previously highlighted with respect to inventories,
- 19. ¹Comments and opinions expressed reflect solely the personal views of Anthony Lombardi as of 6/28/19, and not any other individual or firm. Such views are not a recommendation to buy or sell any security, fund or portfolio. Any investment decision should be made in consultation with a financial advisor. JUNE 2019 INVESTMENT COMMENTARY1 technological benefits and change, potential production cut slippage amongst OPEC, and production triggers being pulled by U.S. producers, a further constraint on materially higher price levels is potential headwinds to economic growth that could metastasize with such a corresponding rise in WTI. Against this backdrop we have remained steadfast in our long-term pessimistic view, particularly for the Energy equity sector. As evident in our 300bp reduction in sector allocation during 2017-18 and Energy’s modest ~5% S&P 500 market capitalization representation, we remain in no rush to add portfolio exposure to a sector where process limits our maximum allocation (~7.5%), and compelling opportunities exist elsewhere without risks of certain oligopolistic variables. 1Q19 Real GDP +3.2% (y/y) and +3.1% (q/q); 2Q19E: +2.6% y/y, +1.8% q/q. Versus FY 2018, forward estimates for FY 2019, 2020 and 2021 are currently +2.5%, +1.8% and +1.9%, respectively, stable vs 90 days prior. The slowing in 2020 is driven by a combination of Consumer and Government spending, reduced Investment and increased imports, while 2021 is more heavily tilted to continuation of a Government spending slowdown. A major infrastructure initiative, if passed, could serve to alter estimates. We have repeatedly highlighted the underlying strength of the employment backdrop, which has yet to crack based on latest hiring trends and record low jobless claims. Versus crisis level losses of ~900k/month in 2008-09, the labor market has witnessed continued improvement, generally posting nonfarm payroll gains of ~150k-300k/month since 2013, with the June print (for May figures) coming in at 75k, the second sub-100K report in 2019, likely due to a variety of policy uncertainties during 1H19. We do not dismiss theses below average figures given economic data points in the US, and globally, have illustrated some weakness during the first half, for which we remain mindful of in the context of portfolio exposures. Forward median forecasted payroll gains for 2019-2021 are in a range of ~120k- 165k/month, levels which have witnessed continued stability and upside trajectory as we expected. The unemployment rate has leveled at a multi-decade low, as well as remaining at post-recession lows of 3.6%-3.7%, having declined ~650 bps from its previous peak. Estimates for 2019 and 2020 have remained at these lower levels and currently stand at 3.7% each, with expectations of a modest rise to 3.9% in 2021. As noted in prior commentaries, acceleration in aggregate economic growth had long-proved difficult despite an improving labor market backdrop. However, 2017’s breach above 3% (Q/Q) real GDP was a notable change which we called-out, a level which came without fiscal policy injection at the time. Given subsequent enactment of tax legislation and corresponding response by companies regarding capital management and resource plans, the underlying traction and lift in GDP that followed was unsurprising. The latest shift in the data marking some slowdown, the pivots by the Fed, and ongoing trade policy negotiations and bipartisanship at home are all variables in the mosaic that bear watching for any sustained level of degradation in growth—all which is in line with our radar being dialed up and ongoing desensitizing of some cyclicality in the portfolio. Despite the market’s spastic convulsions over the past couple quarters, we would reiterate FOMC commentary has continually underscored policy maker’s data dependency, including viewing through a global lens with eyes (peripherally) on more than just U.S. economic conditions. To this end, trade-related developments will certainly be scrutinized for any longer-term impacts that materially impact anticipated trajectory in growth and inflation, both which remain in the care and custody of the FOMC. We have repeatedly stated, monitoring price and wage inflation metrics remains at the forefront for us given the extended period for which global monetary stimulants have existed, and when combined with injected Fiscal accelerants. Despite occasional soft spots in economic data, we have been steadfast that aggregate growth, wage and price pressure would continue to warm. However, inflation still bears the most burden versus history given increasing number
- 20. ¹Comments and opinions expressed reflect solely the personal views of Anthony Lombardi as of 6/28/19, and not any other individual or firm. Such views are not a recommendation to buy or sell any security, fund or portfolio. Any investment decision should be made in consultation with a financial advisor. JUNE 2019 INVESTMENT COMMENTARY1 of business models founded upon low-cost and/or price competition, a trend indirectly referenced by the Fed Chairman in early 2018 when alluding to the Phillips curve having broken down relative to historical relationships. Specifically, many new business concepts successfully introduced within the past decade or two, have been premised upon high-volume, low-margin strategies, where price points and distribution are key competitive differentiators. Tax policy and subsequent corporate actions that led to bonus compensation, wage and hiring increases, and capital/resource investments suggest, however, that operating costs may have reached the point of headwind status, and serve to detract from incremental operating leverage, placing critical focus on monitoring margin trends. This continues to be where we see some of the more notable risks to the near-to- intermediate backdrop---a higher probability of moderating earnings growth via declining operating leverage, NOT an outright or severely deep economic recession. Our portfolio positioning actions during the past year have been mindful of this risk. Monitoring the degree of offsets to tailwinds in the Five and Dime earnings picture remains paramount. Heading into 2Q19 earnings season, based on FactSet data, aggregate S&P 500 EPS on a reported basis are estimated to post a year/year decrease of ~-3%, versus +20% gains posted for FY18, and lower than the -0.3% reported decline in 1Q19. Thus, this would be the second consecutive y/y earnings decline for the S&P 500. Compared to March 31st, estimated 2Q19 earnings growth for the S&P 500 has declined over 200bps from the -0.5% growth originally projected and continues a downtick trend from the massive jump in expectations witnessed heading into 2018. This is now the fourth consecutive quarter in which estimates reverted to a typical trend of heading lower during a quarter. Prior trajectories during past earnings seasons leading into reports, had increased due to a combination of lower cuts by analysts, enacted tax legislation, regulatory climate, a reduced level of negative guidance by companies, and generally easing comps in the more pressured sectors. Prior to tax legislation, some of the easier comps were previously expected to fade but were pushed out due to the tax- related tailwind, serving to help spur momentum on the top and bottom line. Top-line 2Q19 revenue growth forecasts of +3.8% have also declined nearly 100bps vs estimates at the end of 1Q19, implying incremental negative operating leverage. Furthermore, the current 2Q19 revenue estimate represents a sequential decline from the +5.3%, +7.2%, +9.2% and +10.1% revenue gains in 1Q19, 4Q18, 3Q18 and 2Q18, respectively. We had a long-held bullish view on corporate fundamentals but have been slowly pulling in our horns during past 12-18 months. While aggregate profit margins implied in current forecasts, and overall condition of balance sheets continue to be factors helping to reinforce a relatively positive stance, we have clearly been mindful of offsets to tailwinds in the broader earnings picture. Basic math of the market has supported the margin trajectory given the underlying mix and weighting of high-level sector contributors, notably Technology, representing nearly ~22% of S&P 500 market cap. As called out in 3Q18, however, post the index reconstitution, TECH is ~400 bps below its representation at quarter-end June 2018 despite 1H19’s strong growth rally. Conversely, Energy sector’s weighting has been materially compressed over the course of the past few years and currently represents ~5% of S&P 500 market cap but has transitioned from the precipice of negative comparisons. Notably, Energy earnings and revenue growth for FY18 were ~+112% and ~ +18%, but for FY19, the sector is expected to be fully out of the “anomaly” period, as estimated earnings and revenue growth dials down to DECLINES of -11% and -3%, respectively; levels well BELOW the broader S&P 500. Outside of Technology, Healthcare and Financials are near equals (14.2% & 13.1%) in market cap representation, with three additional sectors at ~9%-10% weights. Most notable within Financials, we continue to believe the banks have a favorable
- 21. ¹Comments and opinions expressed reflect solely the personal views of Anthony Lombardi as of 6/28/19, and not any other individual or firm. Such views are not a recommendation to buy or sell any security, fund or portfolio. Any investment decision should be made in consultation with a financial advisor. JUNE 2019 INVESTMENT COMMENTARY1 runway with green lights on capital plans, strong credit, a strong and/or expanding economy, prospect for rising interest rates over the intermediate-to-long term, ability to manage the term structure of rates, reduced regulation as well as the tailwind of lower tax burden and generally domestic-centric business models. Consolidation is a wildcard. With Tech, Healthcare, Financials and Communication Services now comprising ~60% of the S&P market cap; Consumer Staples having absorbed material degradation in revenue, earnings and sentiment; additional tailwind of lower corporate taxes fully embedded in estimates; it would appear revenue and earnings to be reasonably well-anchored in the near- to intermediate-term, with some incremental support potentially coming from potential resolution of geopolitical issues. That said, the current rate of growth for FY19 is premised on a quarterly hockey stick trajectory, and due to negative expectations in 2Q19, is only at low-single digits for the year. Should earnings decline in 2Q19 as expected, it will represent the 2nd quarter in 12 for which there was a negative year-over-year comparison. On a reported earnings basis, only 5 of 11 sectors are expected to be in positive territory for the quarter, led by Utilities, Healthcare, Comm Svcs, Financials and Real Estate. Not one sector is estimated to post double-digit gains, which had been more typical throughout 2018. Materials and Technology are expected to be among the weakest, with the most attention being on TECH due to its 22% sector representation. Energy’s renewed fallout, despite only a 5% market weight, will garner a spotlight as well. Degradation in the earnings outlook for FY2019 vs March forecasts places current estimates for top-line growth at ~4% (vs 5%) and earnings growth of ~2.6% (vs ~3.2%), while FY20 has dropped moderately to ~5% and ~11%, around the levels which we affectionately call a “Five & Dime” market backdrop (5% top and 10% bottom-line growth). As noted in prior commentaries, enacted tax legislation initially generated some spare change, or cushion, against the original baseline sans tax. As quarters and fundamentals have rolled forward, however, the cushion and tailwinds have thinned—there is no more cushion or tailwind. By sector, the earnings picture has once again become more bifurcated, with Financials and Energy currently at the extreme tails of expectations for FY19. Unlike in prior quarters, these are not immaterial sectors in market capitalization. With wider and more volatile distribution of earnings expectations across sectors, and with Technology revenue/earnings growth estimates below the aggregate index, the relevancy of monitoring all sectors has taken on increased importance. All else constant, we believe the basic math of the market’s forward P/E suggests, given the recent rally, it has adjusted to a more rich valuation based upon the underlying sector mix, macro concerns and lower (discount) rate environment: Technology sector’s high profit margins and historically higher growth will be closely examined at 20x forward EPS; the Financial sector trading at ~12x forward EPS appears to be discounting a flat to inverted curve and some credit risks; the benefit of cyclical tailwinds have played-out within Industrials and Consumer Discretionary; and Energy having witnessed another earnings cut again trades in line with the market average at 17x forward. As previously noted, with revenue and earnings moderation, profit margins in the aggregate, and by sector, will remain critical to monitor in the current and subsequent quarters. We believe this to be a key determinant of the market’s ability to sustain and hit record levels or succumb to further downside and/or be subjected to higher levels of volatility. As an active, and concentrated, LCV manager, we will continue our opportunistic pursuit, and do so against what we envision in the unfolding 3- to 5-year time horizon. Bottom line: As contrarians, we have been attracted to many facets in the backdrop noted above, particularly those that underscore the fundamental and emotional swings that are part of any natural market environment. It is the short-to-intermediate term fluctuations which provide the right backdrop for us to position our portfolio for the long-term at both the sector and security level. While we repeatedly noted selective areas of the market
- 22. ¹Comments and opinions expressed reflect solely the personal views of Anthony Lombardi as of 6/28/19, and not any other individual or firm. Such views are not a recommendation to buy or sell any security, fund or portfolio. Any investment decision should be made in consultation with a financial advisor. JUNE 2019 INVESTMENT COMMENTARY1 as expensive, many of the cyclical areas within our value-based discipline had presented as quite compelling to us for quite some time. If one simply places on blinders, and focuses on the aggregate level of the market, to include broader market earnings growth, valuation metrics, GDP growth, and nominal debt levels the backdrop might have been viewed challenging. We always prefer to go deeper, into sectors and individual stocks, assess related fundamentals and metrics, place broader macroeconomic measures such as GDP growth into context, and break apart aggregate metrics such as debt into more relevant measures such as net debt, interest costs and service coverage ratios, etc. In so doing, we had been quite bullish as to the opportunity set in our concentrated yet diversified large cap value strategy. That is not to say the opportunity set would be the same for other investors in different or less-concentrated strategies. As long-term investors, we remain focused on executing a consistent process, buying cheapness and not over-paying for quality. As disciplined contrarians, mindful of capital protection, we have long found the cyclical sectors, ex-energy/commodities, home to stocks with the most compelling valuations relative to the broader market. Given our contrarian nature, we are also cognizant of consensus having moved in our direction, although much of the change was back-end loaded post 2016 US elections, and not universal across the macroeconomic, sector or individual stock landscape. Nevertheless, as we have underscored during the past several quarters, we have grown increasingly sensitive to the shifts that have occurred, for which our portfolio decisions have reflected. With our radar dialed up for changes that cause swings in the pendulum too far in any one direction, we have made it a point to take actions during the past several quarters to solidify cheapness in our portfolio and be protective of capital. We are not married to any stock or sector, as our increased exposure to Staples, Healthcare, Communication Services and Cash, and reduced allocations to Technology, Industrials, Consumer Discretionary, Energy and Real Estate indicate. This is a transparent exercise and can clearly be seen in the valuation characteristics of our LCV portfolio as compared to the broader market, our key benchmark (R1KV) and the entire LCV equity peer group. Conviction is key for us and is reflected in our portfolio actions. Most importantly, with any company, it is those possessing characteristics strong in balance sheet and free-cash flow, combined with compelling equity valuation, that garner our attention--these remain the type of roommates we prefer when seeking opportunity and MOS. AAL Document is meant to be used in its entirety. Reference to prior quarterly and monthly publications is noted. Views expressed represent personal assessment of privately managed separate account and market environment as of the date indicated, and should not be considered a recommendation to buy, hold or sell any security, and should not be relied on as research or investment advice. Information is as of the date indicated and subject to change. All market and other related information relied upon and mentioned is from market data sources viewed as reliable. No guarantees are made regarding accuracy. Index returns are for illustrative purposes only. Index performance returns do not reflect any management fees, transaction costs or expenses. Indexes are unmanaged, and one cannot invest directly in an index. Past performance does not guarantee future results. The S&P 500 Index measures the performance of 500 mostly large-cap stocks weighted by market value and is often used to represent performance of the U.S. Stock market. The Russell 1000 Value Index measures the performance of the large-cap value segment of the U.S. equity universe. It includes those Russell 1000 companies with lower price-to-book ratios and lower forecasted growth values. The Russell 1000 Growth Index measures the performance of the large- cap growth segment of the U.S. equity universe. It includes those Russell 1000 companies with higher price-to-book ratios and higher forecasted growth values. Russell Investment Group is the source and owner of the trademarks, service marks, and copyrights related to the Russell Indexes. Russell® is a trademark of the Russell Investment Group.
- 23. ¹Comments and opinions expressed reflect solely the personal views of Anthony Lombardi as of 6/28/19, and not any other individual or firm. Such views are not a recommendation to buy or sell any security, fund or portfolio. Any investment decision should be made in consultation with a financial advisor. JUNE 2019 INVESTMENT COMMENTARY1 iShares® Funds are distributed by BlackRock Investments, LLC. The iShares Funds are not sponsored, endorsed, issued, sold or promoted by Russell Investment Group. Nor does this company make any representation regarding the advisability of investing in iShares Funds. BlackRock is not affiliated with the company listed above. iShares® and BlackRock® are registered trademarks of BlackRock, Inc., or its subsidiaries. MSCI Emerging Market index is an index created by Morgan Stanley Capital International (MSCI), designed to measure equity market performance in global emerging markets. The Emerging Markets Index is a float-adjusted market capitalization index. MSCI®, and the MSCI index names are registered trademarks of MSCI Inc. or its affiliates. Where noted, S&P 500® Index, Russell 1000® Value Index, Russell 1000® Growth Index, iShares® Russell 1000 Value ETF and MSCI® Emerging Market Index are referenced with abbreviations and respective footnotes. Abbreviations include S&P 500, R1KV, R1KG and MSCI EM. Use of iShares ETF for a respective index is footnoted accordingly and/or mentioned as such. Performance commentary comparisons are made in reference to iShares, unless otherwise noted. Performance quoted represents past performance and does not guarantee future results. Investment return and principal value of an investment will fluctuate, and when sold, may be worth more or less than original cost. Returns for less than one year are not annualized.