September 2018 Investment Commentary & Performance
•
1 like•85 views

Third Quarter 2018 Market & LCV Portfolio Review

Recommended
Recommended
More Related Content
What's hot
What's hot (19)
Similar to September 2018 Investment Commentary & Performance
Similar to September 2018 Investment Commentary & Performance (20)
More from Anthony A. Lombardi, CFA
More from Anthony A. Lombardi, CFA (20)
Recently uploaded
Recently uploaded (20)
September 2018 Investment Commentary & Performance
- 1. ¹Comments and opinions expressed reflect solely the personal views of Anthony Lombardi as of 9/30/18, and not any other individual or firm. Such views are not a recommendation to buy or sell any security, fund or portfolio. Any investment decision should be made in consultation with a financial advisor. SEPTEMBER 2018 INVESTMENT COMMENTARY1
- 2. ¹Comments and opinions expressed reflect solely the personal views of Anthony Lombardi as of 9/30/18, and not any other individual or firm. Such views are not a recommendation to buy or sell any security, fund or portfolio. Any investment decision should be made in consultation with a financial advisor. SEPTEMBER 2018 INVESTMENT COMMENTARY1 High Noon Clock Bongs While the proverbial broken clock is right twice a day, the market pendulum, along with participant’s emotions and behaviors, always ticks and tocks. As noted in the past, cumulatively, such swings serve as a building block in our constant assault seeking out opportunities for entry into, and exit from, investment positions. Most importantly, as inoculated value investors, we place a premium on staying true to our investment process with an unrelenting focus on MOS (margin of safety). As we have for nearly three decades in this business, we vigilantly listen--to the market, the macro backdrop, sector and company news flow, and the corresponding swings in investor psychology. With our typical investment horizon targeted at ~3-5 years, implicit in such a holding period is not simply low turnover (and low cost), but a time-period integral to an investment discipline undeterred by short-term events and emotions. Given our large cap value process is contrarian, high-conviction, and concentrated, we need not scramble adjusting our long-standing views, or portfolio positioning, due to weekly, monthly or quarterly events. As part of our disciplined implementation, we overlay longer-term secular views pertaining to the broader macroeconomic and market backdrop, resulting in active sector and stock exposures. The foundation of our disciplined investment process and philosophy does not allow for it to be radically altered, nor portfolio stock selection and sector allocation be impacted in the same vein. Given investment backdrops do not formulate overnight, portfolio construction, in our opinion, should be the result of a broader mosaic that does not succumb to near-term emotions and current events. Whether a function of near- or intermediate-term fundamentals, and/or investor psychology, our focus remains on recognizing, assessing and seizing upon valuations that potentially present opportunities, be they BUY or SELL. Source: Wikipedia
- 3. ¹Comments and opinions expressed reflect solely the personal views of Anthony Lombardi as of 9/30/18, and not any other individual or firm. Such views are not a recommendation to buy or sell any security, fund or portfolio. Any investment decision should be made in consultation with a financial advisor. SEPTEMBER 2018 INVESTMENT COMMENTARY1 Numerous highs reached during the third-quarter despite TNT and pending midterms. While we continue to believe the fuse on trade/tariffs may be longer and lead to a much smaller stockpile than generally perceived, there remains a high level of angst and tension as to resolution. In a nation where the first word is “United”, the growing proximity of midterm congressional elections has served to ramp the political divide increasingly to new heights. The “A’s have it”, as the combined market value of Apple and Amazon hit $2 trillion, with Alphabet (parent of Google) and Microsoft not far behind in adding an incremental $2 trillion more. Employment, confidence and GDP levels are at highs. Merger and acquisition activity continued to flow, with several energy-related transactions entering the fray, but the notable deal was Comcast’s “sky-high” premium for international distribution assets, in a winner take all weekend auction with the Fox. The S&P 500, Russell 1000 Growth, NASDAQ Composite, Dow Jones Industrials, Russell 2000 and Russell 3000 all hit record highs. Michael Dell, who decades earlier was known as the innovative, young gun, entrepreneurial game-changer of his time, but who eventually decided privatization was best, appears to be changing course and desires to re-emerge into the spotlight of the public markets. Tilray, a cannabis company with ~$155 million in estimated 2019 revenues, climbed nearly 1,200% in less than 60 days, reaching a market capitalization of more than $15 billion, perhaps driven by some bitcoin being cashed-in to fund the heightened speculation. Without question, however, the most notable high came in the form of some smoke & mirrors, as a sleep- and free cash flow-deprived founder of TSLA lit-up a firestorm of issues with a smoke-fest podcast and a now infamous tweet regarding privatization, which subsequently led to an SEC settlement, including a mandated unseating from his role as chairman. We continue to like our current portfolio positioning, are unwavering on process discipline and we always listen to the bong of the market by being mindful of the ever-evolving mosaic. Portfolio Positioning & Review Within the purview of our concentrated, contrarian LCV strategy, we have held a long-standing optimistic perspective of the opportunities seen across several sectors of the US stock market, despite broader valuation multiples of major indices. However, we have been mindful not to let our guard down, and simply ride the market’s swell. With our radar increasingly dialed up over the course of the past few quarters, we have taken the opportunity afforded in our investment process to liquidate full-position winners, while also raising interim cash levels when we deemed appropriate through targeted rebalancing. During 4Q17, 1Q18 and 2Q18, such actions led to consecutively higher portfolio liquidity at the end of each period but in the context of no target weight change to our cash position. In 3Q18, however, we made an active decision to increase our cash target +100bps, to 2.50% from 1.50%. With strong performance in our portfolio, coincided with broader equity market appreciation, select underlying valuation multiple expansion, upward traction in interest rates and potentially more challenging forward earnings comparisons during the next two years, we believed it prudent to underscore our focus on solidifying overall MOS. As discussed in detail below, taken in combination, our actions to reduce allocations to TECH, IND, and CD; increase allocations to HC and CS (where we have been patiently awaiting more compelling valuation and/or negative sentiment); and raise target weighting Cash, all serve to reinforce a protective mindset, while still maintaining an optimistic posture in our portfolio positioning. We like the portfolio, we honor the investment process and we believe retaining higher cash an appealing position heading into the final quarter of 2018. Source: Getty Images
- 4. ¹Comments and opinions expressed reflect solely the personal views of Anthony Lombardi as of 9/30/18, and not any other individual or firm. Such views are not a recommendation to buy or sell any security, fund or portfolio. Any investment decision should be made in consultation with a financial advisor. SEPTEMBER 2018 INVESTMENT COMMENTARY1 Our LCV portfolio remains fully exposed to all 11 sectors of the market, with a favorable disposition to traditionally cyclical areas, possessing compelling valuations, financial statement strength, and where near- term psychology serves to compensate for risk, providing the inherent MOS we seek when investing over a 3- to 5-year time horizon. Straying to own safety at any price has never been an unacceptable paradigm as our value conscious and investment process simply will not allow us to pay any multiple for quality. While conscious of risk factors, we are investors viewing through a risk/reward prism, in active pursuit of opportunities providing the right balance. We seek companies offering a combination of cheapness, a contrarian view, possessing stable long-term balance sheets and attractive FCF characteristics. As regular readers of our commentary are fully aware, we have long found “traditionally defensive” areas of the large-cap market simply too rich. A notable example, we continually called out the ongoing decline of Consumer Staples sector, which fell below 7% (vs nearly 11% 1Q16) representation in the S&P 500 during June 2018 quarter. In large part, the lack of traditionally defensive attributes to contribute downside protection, such as the case in CS, we believe has been due to valuation multiples across such sectors having been at, or above, the market, particularly when viewed on a purely GAAP basis. Throw in some growth, margin and increasing competitive issues and it is clear why such sectors have not presented as compelling in our process. More importantly, we had no issue readily identifying quality, balance sheet strength, and cash flows at much cheaper levels, in various other sectors providing consistency with our long-standing, bullish/cyclical view. Not only has deployment of investable capital in such areas been more acceptable to our contrarian, value-based discipline, but also in recognition that forward long- term returns are typically related to point-of-entry valuation multiples. That said, we are never married to one view as valuations, sentiment and process drive our decision-making. Such patience paid dividends during 3Q18 as we felt the combination of our 3- to 5-year time horizon and valuation compression in certain defensive areas hit risk/reward levels that became appealing. Given opportunities came our way, as contrarians, we began to nibble and reallocate within our portfolio. While we increased our cash target, we are still finding, buying and remaining owners of cheapness, MOS and compelling free cash flow (FCF), while at the same time we are sellers when valuation criteria or process constraints are breached. When juxtaposed against our belief favorable operating leverage opportunities still exist in the economy, and amongst companies we target, we remain steadfast in how we aim to position our LCV portfolio. Key Trades & Attribution We seeded a concentrated LCV strategy during the first quarter 2016. Since inception, as opportunities have been presented, we have made several active portfolio decisions, at both the stock and sector level. During 3Q18, notable actions included: 2 Position Sales o Technology o Industrials 2 New Position Purchases o Technology o Consumer Stapes
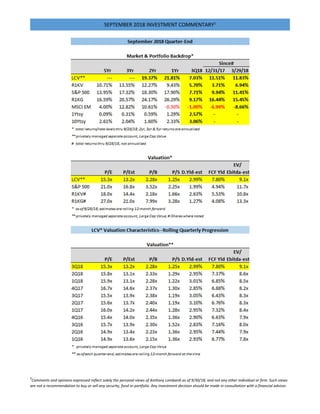
- 5. ¹Comments and opinions expressed reflect solely the personal views of Anthony Lombardi as of 9/30/18, and not any other individual or firm. Such views are not a recommendation to buy or sell any security, fund or portfolio. Any investment decision should be made in consultation with a financial advisor. SEPTEMBER 2018 INVESTMENT COMMENTARY1 Sector & position target weighting changes; rebalance trades across several sectors; Cash o Technology o Consumer Discretionary o Industrials o Healthcare o Consumer Staples o Financials o Materials o Cash target New sector allocated within process constraints o Communications Services It was a busy quarter marked by several items reaching trigger levels. The backdrop set the stage for activity level across the portfolio to be the most significant since inception, owing to targeted opportunities that underscored our convictions, and where we were steadfast in our investment process disciplines. While our investment discipline is characterized by low turnover, when action is dictated by our investment process, we execute accordingly; we neither date, nor fall in love with any stock or sector, nor attempt to justify going beyond embedded process constraints. Recall we had made numerous changes heading into 2018 and during the 1H18, citing the economic and market backdrop, as well as absolute and relative performance of individual holdings in our LCV portfolio during the prior two and a half years. In hindsight, these active decisions proved timely, and we believe the same holds true for actions undertaken in the most recent quarter. Our target sector weightings are influenced by top-down and bottom-up views, while fundamentals, valuation and psychology drive stock level decisions. During the quarter, we executed two (2) full position SALEs and two (2) new position BUYs. Additionally, we made active changes to five (6) sector target weighting allocations, as well as our Cash target weighting. Notably, these changes were separate and distinct from the newly created Communications Services sector, which drew reallocation of market capitalization from the Technology, Consumer Discretionary and Telecom Services sectors. We further executed five (5) target holding position weighting changes across several sectors, as well as rebalanced (up & down) numerous individual holdings, cumulatively touching eight (8) sectors in the portfolio. Our preexisting bias to raise cash and seize opportunities in compelling contrarian opportunities, was also a variable in our activity during 3Q18. While numerous, we do not view portfolio actions taken in the quarter as wholesale changes, but a measured modification to our long-standing optimistic stance. We have telegraphed the same during prior quarters. Despite the activity, the weighted average market capitalization of our holdings was unchanged vs prior quarter, at $151 billion. As always, MOS is our principal guide for which we are compelled by process to follow. Quarter-end target and market value weights for our LCV portfolio are detailed below.
- 6. ¹Comments and opinions expressed reflect solely the personal views of Anthony Lombardi as of 9/30/18, and not any other individual or firm. Such views are not a recommendation to buy or sell any security, fund or portfolio. Any investment decision should be made in consultation with a financial advisor. SEPTEMBER 2018 INVESTMENT COMMENTARY1 On a market value basis, we ended 3Q18 with slightly lower cash position compared to 2Q18, vs 4.0%. Notable during the quarter, we raised our cash target weighting to 2.5% from 1.5%. Recall, from a process perspective, our targeted cash range is designed to provide flexibility, to allow for repositioning within a highly concentrated, yet diversified portfolio. While we are long-term investors, we have a stated preference to monetize winners, and/or sell-down positions based on discipline, in so doing avoid placing capital at risk by simply holding investments as place-markers or allowing exposures to become excessive when selective rebalance is more appropriate. MOS is paramount for us and is critical in limiting potential downside. Holding a position that has attained valuation levels no longer representative of attractive risk/reward only serves to create undo diversification risk and is simply an unacceptable practice. With protection of capital a covenant we are unwilling to break, we firmly believe in utilizing process-permitted cash level when situations dictate, to adhere to this core investment principle. Similarly, significant rebalancing trades we have executed have served to protect capital in very much the same way. Such discipline is among several key distinguishing characteristics in our process. We simply have no penchant to manage a portfolio structured with individual positions not representative of our high convictions, and firmly believe in a concentrated list of holdings, yet one diversified across market sectors. With our sector band targets at 0.5x to 1.5x respective S&P 500 weights, should a sector’s size fall materially below certain predefined thresholds our process does allow for optionality to have a 0% sector target with redeployment of available capital into other sectors, or cash. Investment Performance. For the September quarter, our LCV portfolio generated total return of +7.03% vs the Russell 1000 Value (R1KV) return of +5.70%, and broader S&P 500 return of +7.71%. For rolling one year-ended September 2018, our LCV portfolio generated total return of +21.8% vs R1KV return of +9.4% and broader S&P 500 return of +17.9%. The absolute total return of our LCV portfolio in 3Q18 marked the third highest level since inception, exceeded by +9.2% and +7.4% returns posted in 4Q17 and 4Q16, respectively. Our portfolio’s outperformance of 133bps vs R1KV in 3Q18 was driven by strong Security Selection and a modest contribution from Allocation, with Selection aided by a corporate acquisition, and previously executed rebalancing of
- 7. ¹Comments and opinions expressed reflect solely the personal views of Anthony Lombardi as of 9/30/18, and not any other individual or firm. Such views are not a recommendation to buy or sell any security, fund or portfolio. Any investment decision should be made in consultation with a financial advisor. SEPTEMBER 2018 INVESTMENT COMMENTARY1 positions to target levels. Compared to the broader market, Security Selection was a drag of nearly 100bps, partially offset by a more modest 30bps contribution from Allocation. Most importantly, coming well before expectations for upside, the ability to protect in downside market environments remains critical to longer-term preservation of capital and a reflection of our unrelenting focus on MOS and process. Our portfolio’s characteristics continue to reflect a disciplined, contrarian, and value-oriented process. While generally comfortable with the investment backdrop, we have alluded for several quarters that our radar remained dialed-up to material, incremental valuation multiple migration without corresponding fundamentals improving. Despite ongoing strong outperformance, our LCV portfolio continues to remain materially cheaper across nearly every valuation metric, notably boasting higher FCF & dividend yields, lower forward P/E and EBITDA multiples, and lower P/S compared to the broader S&P 500 and R1KV, the latter our primary benchmark. As illustrated in the tables on page one, staying mindful of general market valuation levels, and more importantly that of our LCV portfolio, remains paramount. Heading into 2018, the protection offered by the valuation discount in our portfolio versus our primary benchmark and the broader market was significant, serving us well during market weakness experienced in 1Q18, as well as the subsequent rebound during 2Q18 & 3Q18. At period-end, meaningful valuation gaps between our LCV portfolio and R1KV remained intact, with FCF yield and EV/EBITDA being notable examples at a +227bps premium and 16% discount (vs R1KV), respectively. In lieu of interest rates, and appetites by management to take on incremental leverage, we continue to keenly monitor the balance sheet leverage, as well as the portfolio’s EBITDA multiple which eclipsed 9x and is now at its highest level since inception. Comparatively, the S&P 500 and R1KV multiples are ~12x and ~11x, respectively. From attribution standpoint, versus R1KV, contribution from Selection far exceeded that from Allocation. Specifically, contribution from Security Selection and Allocation during the September quarter amounted to ~+105bps and ~+25bps, respectively. Technology, Energy and Industrials were the most significant contributors in total attribution, while Consumer Discretionary and Financials were the most significant detractors. By Allocation, Energy and Technology sectors had the largest positive attribution, while Consumer Discretionary and Healthcare were the largest detractors. By Stock Selection, Technology and Industrials were the largest contributors, while Consumer Discretionary and Financials were the largest drags. On an absolute basis, our portfolio had three sectors experience declines quarter/quarter, represented by Consumer Discretionary, Real Estate and Materials. By comparison, there were no sectors in the R1KV to have posted a sequential decline. Our targeted cash position was raised to 2.50% from 1.50%, an increase reflective of our bias the past few quarters to maintain a higher level of liquidity. From a contribution perspective, our cash position was a headwind during a strong performance quarter, resulting in a detraction of 15bps. Communications Services: New Sector a roll-up of TEL, with some CD and TECH; No Purchases; target: 7% As we highlighted in our prior commentary, we were well prepared for a newly comprised Communications Services sector. In late September the Communications Services sector was formed through the combination of the old Telecom Services sector and extraction of several stocks across the Technology and Consumer Discretionary sectors. Versus a weighting of ~2% for legacy TEL at the time of the roll-up, VZ and AT&T now find themselves sharing a much larger playground with the likes of Facebook, Alphabet, Comcast, Disney, CBS, Netflix and Twitter. While no reconstitution is perfect, having followed the TMT (Technology-Media-Telecom) space for 20-years, we believe this was a “no-brainer”. The convergence in and between business models, has been an
- 8. ¹Comments and opinions expressed reflect solely the personal views of Anthony Lombardi as of 9/30/18, and not any other individual or firm. Such views are not a recommendation to buy or sell any security, fund or portfolio. Any investment decision should be made in consultation with a financial advisor. SEPTEMBER 2018 INVESTMENT COMMENTARY1 ongoing secular trend for some time, and any comparative analysis has required tracking a multitude of names, many which were not public or even in their current form 10-20 years ago. In the aggregate, a little more than 200bps of weight was contributed into Communication Services by Media stocks previously in the CD sector, with much larger contribution of 600bps coming out of TECH. Compared to the S&P 500 our portfolio’s target weight allocation for Comm Svcs was an underweight of ~-305bps at the end of September. Technology: DECREASE Sector weighting -200bps; 1 FULL sale, 1 New Purchase, 2 rebalance: 22.0%-->20.0% We have been cyclically biased for an extended period, with TECH amongst the most significant sector allocations providing related exposure in our LCV portfolio. During the previous three quarters we were quite active in reallocations and rebalances within TECH given material appreciation in position holdings, which occurred in the shadow of the broader market’s growth-oriented rally. During 3Q18, Broadcom announced the acquisition of CA Technologies (CA), terms of the deal which provided an all-cash transaction valued at $44.50. Notably, we held CA in our portfolio, a highly contrarian name for which we had conviction several years prior, evidenced by our 5% target weight. Our primary work on CA was completed well before inception of our LCV portfolio. Immediately post the definitive announcement, we fully exited our CA position (equal to 6%+ market value weight) driven by a basic mantra, for which we have repeatedly underscored: "we have a stated preference to monetize winners, and/or sell-down positions based on discipline, in so doing avoid placing capital at risk by simply holding investments as place-markers…MOS is paramount for us and is critical in limiting potential downside. Holding a position that has attained valuation levels no longer representative of attractive risk/reward only serves to create undo diversification risk; and is simply an unacceptable practice." Annualized total return of +22% since inception exceeded that of the S&P 500 and R1KV performance, +19% and 15%, respectively. With a definitive all-cash offer, a buyer in Broadcom which experienced a recent deal breakup with Qualcomm, and strategic rationale not a slam dunk, this was a relatively easy sell decision. At time of purchase, the attributes of CA were compelling in the context of our TECH sector weighting, the company’s high margin software centric exposure, attractive balance sheet and free cash flow dynamics underscored by a model that possessed modest cap ex intensity, capital returns in the form of both dividend and buybacks, refreshed senior management team and the prospect for both business momentum restoration and/or it being an acquisition target. Comparison of CA’s valuation attributes at PurchaseSale were as follows: FCF yield: ~8%~6% Div Yield: ~3.4%2.4% EV/EBITDA: ~7x~11x P/E est: ~12x~16x P/S: ~3x~4.5x P/B: ~2x~3x Analyst rating: 71% Hold/Sell100% Hold Further making for the sale of CA was an opportunity to Buy another TECH stock for which we have been monitoring for an extended period. In contrast to the 5% target weight in CA, however, we purchased this new position at an initial weight of 3%, resulting in a 200bp reduction in our TECH sector weighting. Notably, with the corresponding carve out of ~600bps from TECH to the new Communications Services sector, our revised TECH
- 9. ¹Comments and opinions expressed reflect solely the personal views of Anthony Lombardi as of 9/30/18, and not any other individual or firm. Such views are not a recommendation to buy or sell any security, fund or portfolio. Any investment decision should be made in consultation with a financial advisor. SEPTEMBER 2018 INVESTMENT COMMENTARY1 sector weighting is near neutral (vs S&P 500 process benchmark) as compared to a prior underweight. At time of purchase, the new position offered compelling attributes, including: 9%+ FCF yield, 4%+ div yield, P/Est ~10x and EV/EBITDA ~8x. From a contrarian standpoint the shares underperformed the S&P 500, S&P Tech Sector and the R1KV during the prior 5 years, and sentiment as defined by consensus ratings has been negative. The company fit neatly into our broad mix of existing TECH holdings in terms of business model attributes, and we believe is additive to aggregate portfolio MOS. Separate from the Sale and Buy in TECH, we also executed two position rebalances, both down to target weights, (-75bps) and (-45bps), respectively. The fact that we have been active within TECH throughout 2018, touching all our holdings, is not surprising given the sector has been a key market driver. Cumulatively, our activity in the current quarter represented ~1,020bps of aggregate portfolio market value. Compared to the S&P 500, our portfolio’s target weight allocation for TECH was an underweight of ~100bps at the end of September. Industrials: DECREASE Sector weighting -300bps; 1 Full Sale; 2 rebalance trades to target: 15.0%-->12.0% As alluded in our June commentary, we were transparent that process dictated a pending reduction in our IND sector target weighting. Notably, our target had been at our allowable process maximum weight of 15.0%, with the sector having comprised part of our long-standing, favorable cyclical view on the market and economy. However, the combination of ongoing decline in the S&P 500 IND sector representation, and increasing representation by other sectors, served to lower the maximum allowable process weight for IND to ~14% at the end of 2Q18. IND sector weighting in the S&P 500 has continued to experience a decline during the past 5-10 years, despite strong contributions of the sectors largest capitalization names. Versus a 10-year peak of ~11.5%, the sector hit 9.5% in July, a level representing the low-end of a 5-year range of 9.5%-11.0%. During 3Q18, in combination with increasingly compelling opportunities outside IND, and our unrelenting focus on MOS, we followed through in executing a sector weighting decrease of -300bps. Despite opportunities within IND, such action was critical to remaining compliant with our investment process, as well as listening to one of many data points in our discipline. To meet our process constraint at the sector level, and reduce IND to compliant weighting, we executed the full Sale of Emerson Electric (EMR), which was a 3% target position. From inception to Sale, EMR shares generated annualized total return of +21%, compared to +19%, +18% and +16% for the S&P 500, S&P Industrials and R1KV, respectively. At time of sale, EMR consensus rating mix was 48% Buy/4% Sell and had witnessed an expansion to more expensive valuation multiples during our holding period. Specifically, FCF yield of 4.8%, EV/EBITDA of 13x, P/Est of 23x, P/B of 5.3x and P/S of 2.7x. Among select attributes appealing at time of purchase were EMR’s A-rated balance sheet, FCF generation, dividend history, global presence, a “parts player to the road” and a stealth Technology play within IND combined with strong management. At purchase, EMR commanded a FCF yield of ~6%, EV/EBITDA of ~9x, P/Est of ~16x, P/B of ~4x and P/S of ~1.8x, and ratings mix of 18% Buy/14% Sell. Separate from the Sale of EMR, we also rebalanced two IND positions up to target weightings, comprising ~150bp of market value. In total, including the EMR sale, we utilized ~450bps of aggregate portfolio market value in the sector during the quarter, and, despite our process-driven reduction, we retained an overweight exposure. Specifically, compared to the S&P 500 and R1KV, our portfolio’s targeted overweight allocation for IND was ~230bps and ~395bps, respectively, at the end of September.
- 10. ¹Comments and opinions expressed reflect solely the personal views of Anthony Lombardi as of 9/30/18, and not any other individual or firm. Such views are not a recommendation to buy or sell any security, fund or portfolio. Any investment decision should be made in consultation with a financial advisor. SEPTEMBER 2018 INVESTMENT COMMENTARY1 Cons. Discretionary: DECREASE Sector weighting -500bps; Re-duction, -distribution, -balance: 17.5%-->12.5% While on the surface our -500bp decrease in CD sector target weight would appear extreme, however, there were numerous underlying drivers responsible for the change. Along with TECH and TEL, the CD sector was impacted during 3Q18 by the redistribution of market capitalization into a newly created Communications Services Sector. Principally, the composition of assets that were shifted from CD to Comm Svcs were Media- related companies where we have had exposure in the portfolio. Recall in previous quarters, we underscored our convictions in the CD sector by raising the target weight near the maximum allowed by our process at the time. During the September quarter, we focused on three positions for rebalance, two down to target weight and one up. Notably, one of the positions rebalanced down, we subsequently lowered its target weight -100bps to 4.00% later in the quarter. The combination of the rebalance and target reduction on this holding represented the 5th related reduction we have taken on the position during 2018. The recasting of CD, TECH and TEL sectors at quarter-end further impacted this holding, which transitioned from CD to the new Comm Svcs sector. Thus, one portfolio holding was responsible for driving our entire -500bps sector target, in large part due to sector reclassification. Cumulatively, excluding the 400bps of reclass, actions taken in the quarter comprised ~260bps of aggregate portfolio market value. Along with TECH, IND, and FIN, the CD sector has comprised a significant part of our portfolio’s cyclical bias, and it has contributed materially to total attribution in 2018. At quarter-end, despite the reclass, our sector target allocation of 12.5% represented an active overweight of ~220bps versus the S&P 500. Our process compliant maximum weight for CD was 15.5% at quarter-end. Financials: INCREASE Sector weighting +200bps; 2 rebalance trades to target: 17.0%-->19.0% Along with TECH, IND, and CD, the FIN sector has comprised a significant part of our portfolio’s cyclical bias. While sector target weightings in TECH, IND and CD were reduced during 3Q18, we utilized these funds, in part, to source a sector weighting increase in FIN by +200bps. Specifically, two (2) existing positions were raised +100bps each, further underscoring our high conviction in our target holdings within FIN, as well as general macroeconomic optimism. In addition to the target weighting increases, we also rebalanced three (3) positions up to full weight. Notably, within the FIN sector, our LCV portfolio has had no ownership in Insurance as we have a long-standing view it is an inappropriate time to have such exposure in lieu of many such companies being bond proxies, compounded by rising interest rates, historically low catastrophe loss experience, increasing competitive pricing and business model experimentation, and capital return programs in the late innings when compared to bank counterparts. Cumulatively, actions taken in 3Q18 comprised ~365bps of aggregate portfolio market value. We believe select areas of FIN sector offer compelling opportunity and MOS against the backdrop for which we have detailed. Compared to the S&P 500 and R1KV, our portfolio’s target weight allocation for FIN was an overweight of ~570bps and an underweight of ~380bps, respectively, at the end of September. Cons. Staples: INCREASE Sector weighting +200bps; 1 New Purchase; 1 rebalance trade to target: 5.0%-->7.0% We have long believed CS to be fundamentally unattractive and overvalued, particularly when viewed in the context of our long-standing bullish view of macroeconomic and corporate profit trends. However, we are also contrarians, seeking compelling valuations and MOS wherever they are present. Every asset has a bid-ask price. With respect to CS, we have been patient and have waited for the pendulum to swing increasingly in our direction, while simultaneously maintaining our high conviction level in more attractive cyclical sectors. During the quarter, as opportunity presented, we purchased a new target position in CS with an initial weighting of 2.00%, driving an equal 200bps increase in the aggregate sector weighting. Despite the increase, it is notable our
- 11. ¹Comments and opinions expressed reflect solely the personal views of Anthony Lombardi as of 9/30/18, and not any other individual or firm. Such views are not a recommendation to buy or sell any security, fund or portfolio. Any investment decision should be made in consultation with a financial advisor. SEPTEMBER 2018 INVESTMENT COMMENTARY1 new CS sector target weighting of 7.00% remains well below the maximum weighting of ~10% allowed per process, reflective of our belief that more valuation compression, and/or business model stress remains a likely possibility. CS has been among the most bruised defensive sectors as its representation in the S&P 500 has been cut in half during the past decade, falling from 14% to less than 7% currently. At an initial 2% target, our newly added CS position provides ample opportunity to raise further, while also presenting with favorable valuation and contrarian sentiment. Specifically, 50% Hold/Sell-rated, combined with FCF yield materially greater than our portfolio, forward P/E of ~14x, and P/B and P/S near 1x. In addition to the new position purchase, we also rebalanced another up to target weighting. Cumulatively, actions taken in the quarter comprised ~280bps of aggregate portfolio market value. Compared to the S&P 500 and R1KV, our portfolio’s target weight allocation for CS at quarter-end was near neutral at overweight of ~30bps and underweight of ~-20bps, respectively. Healthcare: INCREASE Sector weighting +100bps; 1 rebalance trade to target: 9.0%-->10% While not as negative as our CS stance, we have viewed the HC sector as fundamentally unattractive when viewed in the context of our long-standing bullish view of macroeconomic and corporate profit trends. However, last quarter we utilized significant appreciation in target holdings in cyclical sectors, TECH and CD, for redeployment to the underperforming, underweight HC sector which had begun to offer increasingly compelling valuation during the previous few quarters. We noted that we were wading, not diving into the sector. During the September quarter we went for a deeper swim by raising our HC sector weighting +100bps to 10.0%, utilizing an existing target position, as conviction is a foundational pillar of our process. Notably, the increase in HC target weighting was funded by the 600bps+ of market value raised through the sale of CA in TECH. At the same time, we rebalanced down an existing HC position to target weight, reflecting that we remain cognizant of all parts of our process. For the quarter, our actions in HC cumulatively represented ~175bps of aggregate portfolio market value. Compared to the S&P 500 and R1KV, our portfolio’s targeted underweight allocation for HC was ~-505bps and ~-520bps, respectively, at the end of September. Four sectors at target allocations of 4.00% or lower; Telecom drops off list; Energy pessimism unchanged Our portfolio currently has four of eleven sectors where target weightings are 4.00% or less; Energy (4.00%), Materials (3.00%), Real Estate (1.50%) and Utilities (1.50%). Telecom (3.00%) was previously part of this list but the roll-up into a new Communications Services sector makes for a considerably larger footprint. In fact, our process minimum weighting for Communications Services is ~5%, which serves to exclude it from the 4.00% list. Weightings in Energy, Materials, Real Estate and Utilities remain in alignment with our broader investment views, expected backdrop and process constraints, and all underscore our cyclical bias. Energy continues to remain our most pronounced exception, with our portfolio allocation emphasizing a strategic decision to be prudent and mindful of our long-standing concerns. Despite a +21% move in WTI YTD18, the S&P 500 Energy weighting at quarter-end was at ~6.0%, a level well off the ~15.0% weighting reached 10-years ago; and placing our allowable process maximum for the sector at ~9.0% allocation. Strategically, we desire a meaningful underweight, which at quarter-end was ~-200bps and ~-675bps below the S&P 500 and R1KV, respectively. Notably, despite our targeted underweight in Energy and the WTI’s +21% appreciation YTD, our portfolio’s relative performance has not been dramatically impacted. We remain quite comfortable at a 4.00% allocation and would not hesitate to reduce should process and/or opportunities warrant, either within, or outside the sector. Our fundamental concerns remain unaltered, and we reiterate our belief the sector to be a quintessential “value trap”. Select fundamental drivers are unlike any other sector which, in our opinion, lead to
- 12. ¹Comments and opinions expressed reflect solely the personal views of Anthony Lombardi as of 9/30/18, and not any other individual or firm. Such views are not a recommendation to buy or sell any security, fund or portfolio. Any investment decision should be made in consultation with a financial advisor. SEPTEMBER 2018 INVESTMENT COMMENTARY1 questionable long-term forecasts in the context of a low standard deviation distribution. The S&P 500 Energy sector would require an 8% weight level before forcing us to move our allocation higher on a process basis alone. Within MAT and TEL (prior to Comm Svcs) sectors, we rebalanced 1 position each, up to target weights. The rebalance in MAT was our first since our LCV portfolio’s original seeding. In aggregate, these actions cumulatively represented ~55bps of aggregate portfolio market value. Compared to the S&P 500 and R1KV, our portfolio’s targeted overweight allocation for MAT was ~+55bps and an underweight of ~-90bps, respectively, at the end of September. As previously noted, our target weight in the newly created Comm Svcs sector is 7.00%, which represents an underweight of ~-305bps compared to the S&P 500. Cash target INCREASED +100bps: 1.50%-->2.50% As noted in our prior commentary, we believed building cash level an appealing position heading into 3Q18. During 4Q17, 1Q18 and 2Q18, such actions led to consecutively higher portfolio liquidity at the end of each period but in the context of no target weight change to cash. In 3Q18, however, we made an active decision to increase our portfolio’s cash target +100bps, to 2.50% from 1.50%. From a market value perspective, cash level was 3.0% at quarter-end, versus 4.0% at the end of June. Market and Economic Backdrop We have repeatedly underscored our belief that a good amount of operating leverage existed that could be readily monetized for the benefit of shareholders/consumers should top-line revenue (& GDP) growth move sustainably higher; a dynamic that has clearly played out and become consensus. However, our vigilance works both ways and, as indicated in our previous commentaries, our radar has been dialed up: “should macro-related conditions deteriorate, or it become(s) increasingly difficult to discover new compelling opportunities; valuation characteristics, balance sheet and/or cash flow attributes become more challenging, we will change course per process discipline.” Process, opportunities and MOS will always be our guide, which our recent allocation and rebalance actions continue to reflect. For much of this elongated recovery, the broader US equity market has been able to absorb a multitude of events, to include the ongoing political landscape at home; technology data/privacy concerns; geopolitical tensions and events around the world, to include increasing crystallization on trade and tariffs; ongoing developments in North Korea; a fluctuating dollar; spiking market volatility; oil price reversal; hemorrhage in Emerging Markets; improving economic data at home; rising board governance issues in context of internal allegations; terrorist and civilian-based societal attacks; new Fed Chairman and mix on FOMC; prospects for the speed of continued normalization of monetary policy through rate and balance sheet actions; Notably, the market shrugged off a weak, and volatile first quarter, with a bounce back in the second and third quarters. Recall, the first quarter decline coincided with the valuation multiple expansion we had alluded in prior reports. Bifurcation of performance across investment styles and regions remained status quo. As noted in our September 2017, December 2017 and March 2018 commentaries, there was clear rotation underway from Growth/Emerging Markets to Value in the latter part of each quarter. In the June quarter, the levee breached with major declines in the MSCI Emerging Market index, while Growth remained in favor. Deterioration in EM continued during the September quarter which appeared to serve as a catalyst for search for safety in more developed markets, notably US equities. We remained unsurprised by the pendulum action in the market,
- 13. ¹Comments and opinions expressed reflect solely the personal views of Anthony Lombardi as of 9/30/18, and not any other individual or firm. Such views are not a recommendation to buy or sell any security, fund or portfolio. Any investment decision should be made in consultation with a financial advisor. SEPTEMBER 2018 INVESTMENT COMMENTARY1 particularly in lieu of monetary and fiscal backdrops, geopolitical tensions, increased volatility and underlying emotional swings. In our opinion, adding fuel to the ongoing unwind in EM has likely been capital allocations previously made partly on perception international markets offered a more compelling opportunity. As noted in our March commentary, we expected the style-shifting dynamic to have the potential to remain an underlying pillar during 2018, which would also align well against our investment process. With one quarter remaining in 2018, in our opinion, this trend will continue to be the case, as well as into the new year. For the quarter, the S&P 500 posted a 7.7% total return, Growth > Value, while EM hangover continues. Contrary to prior quarters, there was a bit of a mix shift away from certain cyclical areas in terms of absolute performance, paced by Healthcare, Technology and Industrials posting positive total returns of +14.5%, +12.3% and +10.0x.x%, respectively. While Consumer Staples lagged the broader market, it was a notable relative improvement from prior poor showings in which negative total returns were posted. In fact, there were no S&P 500 sectors in the red. Cyclical areas of Materials and Energy were the weakest performers in total return in the quarter, along with defensive (rate-sensitive) sectors of Real Estate and Utilities. Growth (as measured by Russell 1000 Growth Index—R1KG) posted a +9.2% total return, meaningfully outperforming Value for the seventh consecutive quarter, with a ~345bps differential. As noted above, Emerging Markets (as measured by MSCI EM index) posted a decline of -1.0% total return, further delinking major indices. The weak showing for EM placed has now placed its rolling 1-year total return at ~2,700bps below Growth, a significant swing from its ~400bps rolling 1-year advantage at the end of 2Q17. With the ongoing hemorrhage, Value extended its gains over EM, swinging from a rolling 1-yr deficit of -1,825bps at end of 1Q18 to a favorable ~995bps differential at end of 3Q18. As to U.S. interest rates and spreads, we have long maintained that an extended path lower ended several quarters ago—a view, at the time, founded upon broad expectations for improved economic growth, higher (but not runaway) inflation, and changes in monetary (tighter) and fiscal (expansionary) policy. We have also not shared the market’s concerns regarding short-end curve pressure or potential inversion, and further believed such concerns would alleviate over subsequent quarters. Globally, stock markets (total returns measured in U.S. Dollars) remained volatile and bifurcated across several geographic theaters, continuing an ongoing theme in the backdrop: Mexico +10.3% (vs -3.9% 2Q18), Swiss +7.4% (-3.1% vs 2Q18), Japan +6.2% (vs -0.2% 2Q18), Brazil +4.8% (vs -27.1% 2Q18), France 2.8%, Australia +0.1%, Germany -1.0%, UK -1.8%, Hong Kong -2.2%, India -3.1% (+2.7% 2Q18), and China -13.2% (-17.1% 2Q18). For the quarter, the S&P 500 posted a 7.2% price increase, below the positive price performance of the R1KG at +8.9% but comparatively stronger than the R1KV at +5.0%. With respect to domestic markets, Technology and Consumer Discretionary drove a large part of the positive attribution of Growth over Value. Healthcare was the most significant detractor for Growth vs Value. As we noted in our prior commentaries, when comparing Growth vs Value, any performance differential will likely be driven, principally, by four sectors. Specifically, the most significant positive weighting differentials between Growth and Value at quarter-end were Technology and Consumer Discretionary, while most significant underweights were Financials and Energy. Quarterly range for 10-year yield, 2.81% to 3.10%, with first 3%+ close. While the 10-yr did not eclipse the prior quarter’s high of 3.11%, it did record the first quarterly close above 3.00% in five years (4Q13). Excluding a short dip to nearly 2.00% (3Q17), the 10-yr has not only managed to hold its initial spike during first few days following the 2016 US Presidential election but has clearly been reacting more dynamically to various macroeconomic,
- 14. ¹Comments and opinions expressed reflect solely the personal views of Anthony Lombardi as of 9/30/18, and not any other individual or firm. Such views are not a recommendation to buy or sell any security, fund or portfolio. Any investment decision should be made in consultation with a financial advisor. SEPTEMBER 2018 INVESTMENT COMMENTARY1 fiscal and geopolitical factors. We believe this action will continue, albeit not in perfect linear fashion. Against this rate backdrop, major US equity indices have been able to power to numerous record all-time highs, including in 3Q18 across several broader benchmarks, to include the S&P 500, Russell 1000 Growth, NASDAQ Composite, Dow Industrials, Russell 2000, and Russell 3000. The Russell 1000 Value did not break a new high, in large part due to heavy concentration in Financials, which have lagged, and modest exposure to Technology. 10-Yr Qtr-End 4Q15: 2.27% 2Q16: 1.47% 4Q16: 2.45% 2Q17: 2.31% 4Q17: 2.41% 2Q18: 2.86% 3Q18: 3.06% Yield curve slope compresses further, albeit more modestly; but still not a primary concern for us. As noted last quarter, while aware of potential curve inversion, we remain focused upon aggregate interest rate levels, cash flow, balance sheet dynamics, capital allocation and margin trends. Neither the slope of the curve, or it’s dynamics, at this juncture is a primary concern for us in this regard. Far be it from us to be Pollyanna, as our radar has been dialed up the past several quarters. Should an inversion pan out and is a function of, or related to, a deterioration in fundamentals, that would cause us to make further adjustments in our thinking and positioning. Using 1yr-10yr spread, which had expanded to ~165bps at year-end 2016, compressed notably during 2017, declining to ~140bps at end of 1Q17, to ~110bps at end of 2Q17, ~105bps at end of 3Q17, ~65bps at end of both 4Q17 and 1Q18, ~55bps at end of 2Q18 and ~50bps at end of 3Q18. The 1yr-10yr spread level is well below the ~200bps average over the past 10-years, a notable change in the backdrop. The acceleration in slope compression during the past 2 years has largely been driven by a rising short-end and, until recently, modest pressure on the long-end. In our opinion, this has been a function of anticipated and actual Fed action, alleviated concerns regarding a stalled Fiscal agenda, and firming economic data juxtaposed against well- contained inflation. Given the backdrop, we are inclined to believe a potential reversion to mean (slope) is more likely to be driven by a rise in the long-end of curve than a short-end decline, implying a possible 4.00%+ 10-yr. Under a new Fed Chairman and changes to members of policy-making committee, we continue to believe data dependency remains among the foundational pillars of monetary policy. Magnitude of changes are expected to be justified by the macroeconomic backdrop—the latter which we have been positively disposed for some time and are expected to continue driving interest rate movements and broader policy agenda. The underlying mosaic and interplay of new Fed leadership, economic data points (domestic and international), Fiscal policy agenda and spending discipline, corporate balance sheet and profit trends will continue to be monitored. Secondary to these forces will be any longer-term impacts of sustained trade tariffs/negotiations across individual market sectors, which may, or may not change primary variables in the economic and business profit equations. As previously noted, we are 10 years out from the global financial crisis, and on more stable economic ground, with improved conditions for corporate and consumer fundamentals. At this stage of the domestic economic, monetary and fiscal policy cycles, we remain less focused upon unit count of rate increases anticipated by the
- 15. ¹Comments and opinions expressed reflect solely the personal views of Anthony Lombardi as of 9/30/18, and not any other individual or firm. Such views are not a recommendation to buy or sell any security, fund or portfolio. Any investment decision should be made in consultation with a financial advisor. SEPTEMBER 2018 INVESTMENT COMMENTARY1 market and more biased to the level of potential rate changes, and the corresponding impact such step-changes could serve to vastly exceed market expectations. We maintain our view with respect to U.S. monetary policy underscored in our December 2016 commentary: “…we would not be surprised to see a more fluid pace of change regarding monetary policy should situations warrant. This would include the possibility of at least one 50bp change amongst the current unit count of rate change decisions anticipated, and/or more action steps than currently discounted by the market.” The accelerated compression in the yield curve highlighted above is just one example of more fluid changes in the backdrop versus a stale dynamic previously, as is any related rise in equity market volatility. A market with a swinging pendulum fits neatly into our process. Changes in capital allocations and management priorities remain key front-burners, playing out as expected. Our expectations have been for corporate actions that lead to a re-ranking of capital management priorities given a more a favorable tax code, increasing deregulation, improving economic activity and executive management confidence, along with a corresponding increase in capital and human resource investments. While such changes could have negative implications for the level and/or pace of share repurchases and dividend increases witnessed during the earlier stages of recovery since the trough of the financial crisis, they also vary by sector. To this end, given underlying performance of the stock market, simple mathematics continue to suggest lower marginal buying power of previously approved, and remaining buyback authorizations. Still further yet, Finance 101 suggests higher valuation multiples present as less appetizing to corporate CFO’s and Treasurers, acting as an incremental constraint to share buybacks. That said, we reiterate that even with large repatriations of internationally domiciled cash, the possibility exists that some companies may still deploy part of this dry powder into “high multiple” buybacks. Technology is where a lot of this liquidity resides with several companies boasting cash-rich balance sheets. As we have alluded previously, however, new potential risks and opportunities require monitoring within the Technology sector and may cause some redirection of cash. Material change to business models, particularly expectation for long term future growth and margins, will be notable to monitor, no matter the sector or company. As is typically the case, earnings and free cash flow generation will serve as key drivers of the ultimate determinant of capital allocation across sectors and industries, led by the respective fundamental backdrops of each. M&A. Deal appetite spanning sectors and geographies continues to reflect high confidence of management and boards to take on risk and allocate capital. The recently concluded bidding war between Disney and Comcast, for assets of Twentieth Century Fox and Sky, underscores the backdrop, notably the extent to which Comcast final premium offered to win the Sky assets. Excluding a misguided tweet regarding Tesla going private, some of the more notable announcements in 3Q18 were: Energy Transfer Equity LP/Energy Transfer Partners LP rollup ($26 bil stock), Broadcom/CA Technologies ($18 bil cash), CK Asset Holdings-led consortium/APA Group ($16 bil cash), BP PLC/Petrohawk Energy Corp ($11 bil cash), Brookfield Asset Management/Forest City Realty Trust ($10 bil cash), and Diamondback Energy/Energen Corp ($9 bil stock). Volatility remains a no go for launch. With equity indices hitting new highs and continuing a rebound off a weak 1Q18, US equity markets managing through a maze of trade/tariffs scenarios, mid-term elections pending, rising interest rates, record unemployment, wage-inflation scares, GDP ticking 4% and waters remaining calm around North Korea, volatility, as measured by the CBOE Volatility Index (VIX), remains subdued ending 3Q18 at 12.1. As we have noted previously, since 1990, a year marked by the precipice of a multiyear financial crisis (and
- 16. ¹Comments and opinions expressed reflect solely the personal views of Anthony Lombardi as of 9/30/18, and not any other individual or firm. Such views are not a recommendation to buy or sell any security, fund or portfolio. Any investment decision should be made in consultation with a financial advisor. SEPTEMBER 2018 INVESTMENT COMMENTARY1 recession) involving S&L’s and commercial banks, the low mark on the VIX has been 9.1, and the average, 19.3. During the past several quarters, exceptions were the February 2018 spike (to 37), an immediate, post-UK “Brexit” vote increase in late June 2016 (to 25.8), a less prominent increase in September 2016, and the November 2016 spike (to 22.5) after the U.S presidential election. Recent FOMC decisions; confirmation of a new Fed Chair, intra-meeting commentary regarding rate/balance sheet policy; swirling, divisive and emotional political winds blowing in Washington, tax legislation and reduced regulation, geopolitical events including trade/tariffs & disruptions across the globe, intermittent sell-offs in Tech (long the market’s anchor tenant) the past few quarters, and more recent speculative swing in crypto currencies and cannabis plays, all have had LESS of an impact on the VIX than wage inflation scares, Brexit vote results or the U.S. presidential election of 2016. Dollar unchanged, holding its gain of 5% in 2Q18. Given the confluence of global events, relative strength of the U.S. economic backdrop, and perceived safety of U.S. capital markets, we have long been of the view that an overly dire outcome for the US Dollar will remain an unlikely scenario in the near-to-intermediate term. As noted in our March 2018 commentary, implications of any potentially sustained trade-related changes due to tariffs, negative or positive, will certainly bear monitoring. For the quarter, the Dollar index (DXY) bounced a bit, but ended holding onto the 5% increase posted in 2Q18, reflecting in part, continued undercurrents in DC related to monetary, fiscal and trade-related policy, rising interest rates domestically, and potentially flight to safety from regions outside the US. The Dollar’s strength has also had negative impacts on several Emerging Markets, some which are under increasing financial duress. As noted in prior comments, the DXY remains well-above the financial crisis lows of ~70 reached in 1Q08, and ~8% off its 10-year high of ~103 in 1Q17. Gold continued lower while Oil held its bid. Gold, which had hit a 1-year high of nearly $1,360 in late January, declined 5% in 3Q18 on heels of 7% drop in prior quarter. The drop in Gold has occurred against a backdrop of continued Dollar strength and the VIX having remained subdued post a 1Q18 spike. Oil held its underlying bid following a strong performance in the prior quarter. With a near 18% gain in 2Q18, the front-end contract for WTI finished relatively unchanged in 3Q18, closing at $73.25, but not before a 13% decline intra-quarter. Despite strong gains and momentum during the past couple quarters, Oil remains more than 30% below its 2014 high. Outages, logistic constraints and sanction-related constraints clearly have had an impact on crude’s move higher but not something for which we would peg any long-term modeling. Beyond risks and concerns we have previously highlighted with respect to inventories, technological benefits and change, potential production cut slippage amongst OPEC, and production triggers being pulled by U.S. producers, a further constraint on materially higher price levels is potential headwinds to economic growth that could metastasize with such a corresponding rise in WTI. Against this backdrop we remain steadfast in our long-term pessimistic view, particularly for the equity sector. As evident in our 200bp reduction in sector allocation during 2017, and Energy’s modest 6% S&P 500 market capitalization representation, we remain in no rush to add portfolio exposure to the sector given process limits our allocation to ~9%, and compelling opportunities exist elsewhere without the risks of certain oligopolistic decisions. 2Q18 Real GDP +2.9% (y/y) and clips +4.2% (q/q); 3Q18E: +3.0% y/y, +3.0% q/q. Forward estimates for FY 2018, 2019 and 2020 are currently +2.9%, +2.5% and +1.9%, respectively, with only ’19 having seen a modest uptick vs 90 days prior. We have repeatedly highlighted the underlying strength of the employment backdrop, which has yet to crack based on latest hiring trends and record low jobless claims. Versus crisis level losses of ~
- 17. ¹Comments and opinions expressed reflect solely the personal views of Anthony Lombardi as of 9/30/18, and not any other individual or firm. Such views are not a recommendation to buy or sell any security, fund or portfolio. Any investment decision should be made in consultation with a financial advisor. SEPTEMBER 2018 INVESTMENT COMMENTARY1 900k/month in 2008-09, the labor market has witnessed continued improvement, generally posting nonfarm payroll gains of ~150k-300k/month since 2013, with the September print (for August figures) of 201k above estimate. Forward median forecasts for 2018-2020 are in a range of ~130k-195k/month, levels which have witnessed upside trajectory as we expected. The unemployment rate has leveled at 2-decade low, equal to the April 2000 rate, as well as remaining at post-recession lows of 3.9%, having declined 600 bps from its previous peak. Estimates for 2018, 2019 and 2020 have trended lower and currently stand at 3.9% 3.6% and 3.8%, respectively, with the Fed Chairman earlier this year alluding to the Phillips curve breaking down relative to historical relationships. As noted in prior commentaries, acceleration in aggregate economic growth had long- proved difficult despite an improving labor market backdrop. However, last year’s breach above 3% (Q/Q) on real GDP was a notable change which we called-out and came without fiscal policy injection. Given enactment of tax legislation and response by companies regarding capital management and resource plans, the subsequent firming in underlying traction is not surprising. FOMC commentary has continually underscored policy maker’s data dependency and includes viewing through a global lense with eyes (peripherally) on more than just U.S. economic conditions. To this end, trade-related developments will certainly be scrutinized for any longer-term impacts serving to materially impact the anticipated trajectory in growth and inflation, which are in the prevue of the FOMC. Given the extended period for which global monetary stimulants have existed, combined with newly injected Fiscal accelerants, monitoring price and wage inflation metrics remains at the forefront for us. Despite occasional soft spots in economic data, we have been steadfast aggregate growth, wage and price pressure would continue to warm. However, inflation still bears the most burden versus history given increasing number of business models founded upon low-cost and/or price competition. Specifically, many new business concepts successfully introduced within the past decade or two, have been premised upon high-volume low- margin strategies, where price points and distribution are key competitive differentiators. Tax policy and subsequent corporate actions leading to bonus compensation, wage and hiring increases suggest, however, that operating costs may have now have reached the point of material incremental operating leverage contribution, and places critical focus on monitoring margin trends. Five and Dime earnings picture intact but we continue to monitor degree of offsets to tailwinds. Heading into 3Q18 earnings season, based on FactSet data, aggregate S&P 500 EPS on a reported basis are estimated to be post a year/year increase of ~+20%, versus the +25% gain posted in 2Q18. Compared to June 30th, the estimated 3Q18 earnings growth for the S&P 500 has declined a full percentage point from the +21% growth originally projected, and a downtick from the massive jump in expectations witnessed heading into 2018. This has been the first quarter in some time in which estimates reverted to a typical trend of heading lower during a quarter. Recent trajectories during past earnings seasons, leading into reports, increased due to a combination of lower cuts by analysts, enacted tax legislation, regulatory climate, a reduced level of negative guidance by companies, and generally easing comps in the more pressured sectors. Prior to tax legislation, some of the easier comps were previously expected to fade but were pushed out due to the tax-related tailwind, serving to help spur momentum on the top and bottom line. Top-line revenue growth forecasts of 7.5% for 3Q18 have held steady vs estimates at end of 2Q18, albeit lower than actual +10.1% recorded in June quarter. We have had a long-held bullish view on corporate fundamentals. Profit margins and operating leverage implied in current forecasts continue to be factors helping to reinforce this positive stance. Basic math of the market has supported the margin trajectory given the underlying mix and weighting of high-level sector contributors, notably Technology, representing 21% of S&P 500 market cap. However, post reconstitution, TECH is now ~500 bps below its
- 18. ¹Comments and opinions expressed reflect solely the personal views of Anthony Lombardi as of 9/30/18, and not any other individual or firm. Such views are not a recommendation to buy or sell any security, fund or portfolio. Any investment decision should be made in consultation with a financial advisor. SEPTEMBER 2018 INVESTMENT COMMENTARY1 representation at quarter-end June 2018. Conversely, the Energy sector’s weighting has been materially compressed over the course of the past few years and currently represents 6% of S&P 500 market cap but has transitioned from the precipice of negative comparisons: Current earnings and revenue projections for FY18 are at ~ +100% and ~ +18%, but by FY19, the Energy sector is expected to be out of the “anomaly” period, as earnings and revenue growth is expected to dial down to +25% and +5%, respectively; the latter being at par with the S&P. Outside of Technology, Healthcare and Financials are near equals in market cap representation, with three additional sectors at 10% weights. Most notable within Financials (13.3% market cap), we continue to believe the banks have a favorable runway with green lights on capital plans, strong credit, an expanding economy, rising interest rates, reduced regulation as well as the tailwind of lower tax burden and generally domestic business models. With Tech, Financials and Healthcare now comprising ~50% (60% including the new Comm Svcs sector) of the S&P market cap, additional tailwind of lower corporate taxes fully embedded in estimates, revenue and earnings appears to be reasonably well-anchored in the near- to intermediate-term, with some incremental support potentially coming from other sectors. Should earnings growth increase in 3Q18 as expected, it will represent the 9th consecutive quarter of year-over-year improvement. On a reported earnings basis, all 11 sectors are expected to be in positive territory for the quarter, with Consumer Staples, Real Estate and Utilities the weakest. Energy and Financials are expected to contribute the highest earnings growth. With revenue and earnings moderation, profit margins in the aggregate, and by sector, will be critical to monitor in the current and subsequent quarters as we believe this will be a key determinant of the market’s ability to sustain record levels. The outlook for 2019 has bled marginally higher vs June forecasts, currently calling for estimated top-line growth of ~5% and earnings growth of ~10%, levels which we have affectionately called a “Five & Dime” market backdrop (5% top and 10% bottom-line growth). As noted in prior commentaries, enacted tax legislation has generated some spare change, or cushion, against the original baseline sans tax. By sector, the picture is quite different, with bifurcation in earnings led by Energy and (legacy) Telecom at the extreme tails of expectations for FY19. As these sectors are materially smaller (pre-reconstitution) in market capitalization, we reiterate the more relevant story to monitor remains those sectors within the tails. All else constant, we believe the basic math of the market’s forward P/E suggests it has not been as rich as generally perceived during the pendency of this expansion when viewed in the context of the underlying mix: Technology sector’s high profit margins and higher growth, the Financial sector trading at ~12x forward EPS, the benefit of cyclical tailwinds having materialized within Industrials and Consumer Discretionary, and Energy having traded well above the market average for some time, though now at 17x forward estimates. Bottom line: As contrarians, we have been attracted to many facets in the backdrop noted above, particularly those that underscore the fundamental and emotional swings that are part of any natural market environment. It is the short-to-intermediate term fluctuations which provide the right backdrop for us to position our portfolio for the long-term at both the sector and security level. While we have repeatedly noted selective areas of the market as expensive, many of the cyclical areas within our value-based discipline, have presented as quite compelling to us for quite some time. If one simply places on blinders, and focuses on the aggregate level of the market, to include broader market earnings growth, valuation metrics, GDP growth, and nominal debt levels the backdrop might be viewed challenging. We prefer to go deeper, into sectors and individual stocks, assess related fundamentals and metrics, place broader macroeconomic measures such as GDP growth into context, and break apart aggregate metrics such as debt into more relevant measures such as net debt, interest costs and service
- 19. ¹Comments and opinions expressed reflect solely the personal views of Anthony Lombardi as of 9/30/18, and not any other individual or firm. Such views are not a recommendation to buy or sell any security, fund or portfolio. Any investment decision should be made in consultation with a financial advisor. SEPTEMBER 2018 INVESTMENT COMMENTARY1 coverage ratios, etc. In so doing, we have been quite bullish as to the opportunity set in our concentrated yet diversified large cap value strategy. That is not to say the opportunity set would be the same for other investors in different or less-concentrated strategies. As long-term investors, we remain focused on executing a consistent process, buying cheapness and not over-paying for quality. As disciplined contrarians, mindful of capital protection, we have long found the cyclical sectors, ex-energy/commodities, home to stocks with the most compelling valuations relative to the broader market. Given our contrarian nature, we are also cognizant of consensus having moved in our direction, although much of the change was back-end loaded post US elections, and not universal across the macroeconomic, sector or individual stock landscape. Nevertheless, we have grown increasingly sensitive to the shifts that have occurred, for which our portfolio decisions have reflected. With our radar dialed up for changes that cause swings in the pendulum too far in any one direction, we have made it a point to take actions during the last several quarters to solidify cheapness in our portfolio and be protective of capital. We are not married to any stock or sector, as recent increased exposure to Staples and Healthcare, and reduced allocations to Technology, Industrials and Consumer Discretionary indicate. This is a transparent exercise and can clearly be seen in the valuation characteristics of our LCV portfolio as compared to the broader market, our key benchmark (R1KV) and the entire LCV equity peer group. Conviction is key for us and is reflected in our portfolio actions. Most importantly, with any company, it is those possessing characteristics strong in balance sheet and free-cash flow, combined with compelling equity valuation, that garner our attention--these remain the type of roommates we prefer when seeking opportunity and MOS. AAL Document is meant to be used in its entirety. Reference to prior quarterly and monthly publications is noted. Views expressed represent personal assessment of privately managed separate account and market environment as of the date indicated, and should not be considered a recommendation to buy, hold or sell any security, and should not be relied on as research or investment advice. Information is as of the date indicated and subject to change. All market and other related information relied upon and mentioned is from market data sources viewed as reliable. No guarantees are made regarding accuracy. Index returns are for illustrative purposes only. Index performance returns do not reflect any management fees, transaction costs or expenses. Indexes are unmanaged, and one cannot invest directly in an index. Past performance does not guarantee future results. The S&P 500 Index measures the performance of 500 mostly large-cap stocks weighted by market value and is often used to represent performance of the U.S. Stock market. The Russell 1000 Value Index measures the performance of the large-cap value segment of the U.S. equity universe. It includes those Russell 1000 companies with lower price-to-book ratios and lower forecasted growth values. The Russell 1000 Growth Index measures the performance of the large- cap growth segment of the U.S. equity universe. It includes those Russell 1000 companies with higher price-to-book ratios and higher forecasted growth values. Russell Investment Group is the source and owner of the trademarks, service marks, and copyrights related to the Russell Indexes. Russell® is a trademark of the Russell Investment Group. iShares® Funds are distributed by BlackRock Investments, LLC. The iShares Funds are not sponsored, endorsed, issued, sold or promoted by Russell Investment Group. Nor does this company make any representation regarding the advisability of investing in iShares Funds. BlackRock is not affiliated with the company listed above. iShares® and BlackRock® are registered trademarks of BlackRock, Inc., or its subsidiaries. MSCI Emerging Market index is an index created by Morgan Stanley Capital International (MSCI), designed to measure equity market performance in global emerging markets. The Emerging Markets Index is a float-adjusted market capitalization index. MSCI®, and the MSCI index names are registered trademarks of MSCI Inc. or its affiliates. Where noted, S&P 500® Index, Russell 1000® Value Index, Russell 1000® Growth Index, iShares® Russell 1000 Value ETF and MSCI® Emerging Market Index are referenced with abbreviations and respective footnotes. Abbreviations include S&P 500, R1KV, R1KG and MSCI EM. Use of iShares ETF for a respective
- 20. ¹Comments and opinions expressed reflect solely the personal views of Anthony Lombardi as of 9/30/18, and not any other individual or firm. Such views are not a recommendation to buy or sell any security, fund or portfolio. Any investment decision should be made in consultation with a financial advisor. SEPTEMBER 2018 INVESTMENT COMMENTARY1 index is footnoted accordingly and/or mentioned as such. Performance commentary comparisons are made in reference to iShares, unless otherwise noted. Performance quoted represents past performance and does not guarantee future results. Investment return and principal value of an investment will fluctuate, and when sold, may be worth more or less than original cost. Returns for less than one year are not annualized.