Download as PDF, PPTX
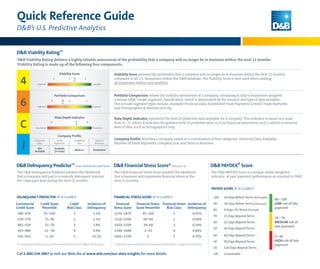
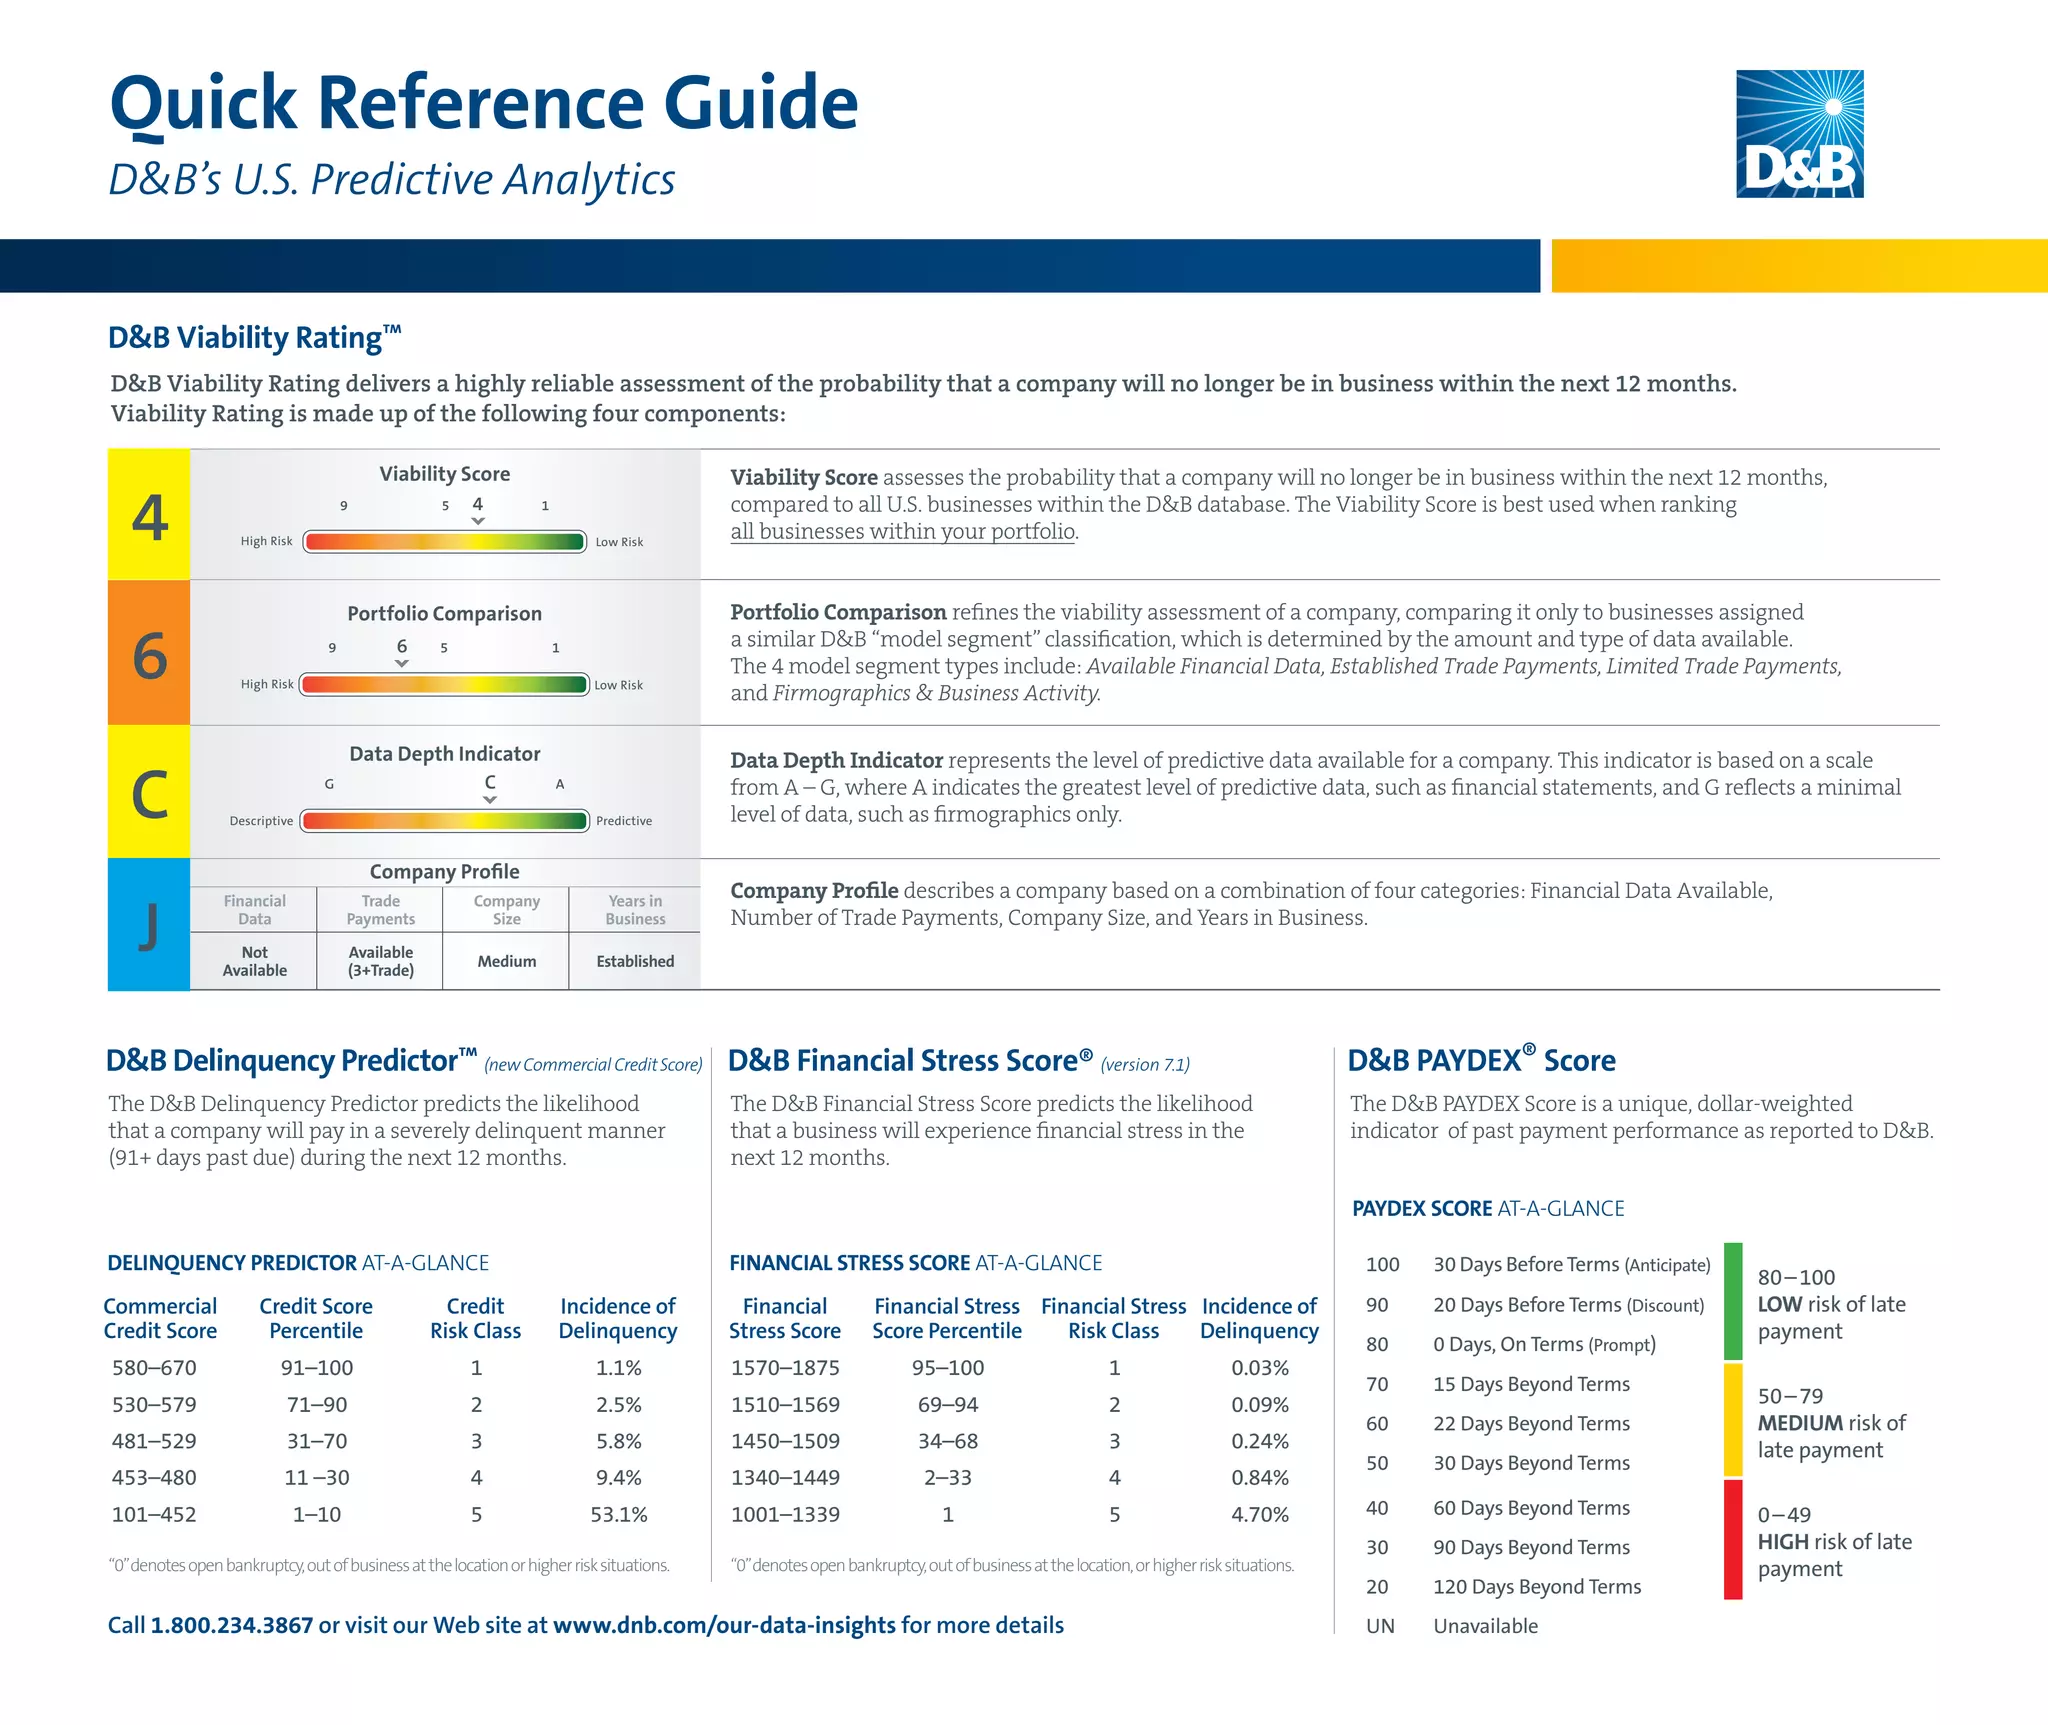

D&B's U.S. Predictive Analytics provides tools to assess the financial viability and payment risk of companies. It includes the D&B Viability Rating which predicts the probability of a company going out of business within a year. The Viability Rating has four components: the D&B Delinquency Predictor predicting payment delinquencies, the D&B Financial Stress Score predicting financial stress, the D&B PAYDEX Score indicating past payment performance, and the Viability Score ranking companies within D&B's database. Additional tools include Portfolio Comparison, Data Depth Indicator, and Company Profile.