Downloaded 96 times
![How useful?
[ ]mexexNV III )1()1( −−−=η
−
>>
− I
II
e
e
mmG
x
x
11](https://image.slidesharecdn.com/leuven-130813074714-phpapp01/75/Credit-risk-with-neural-networks-bankruptcy-prediction-machine-learning-19-2048.jpg)


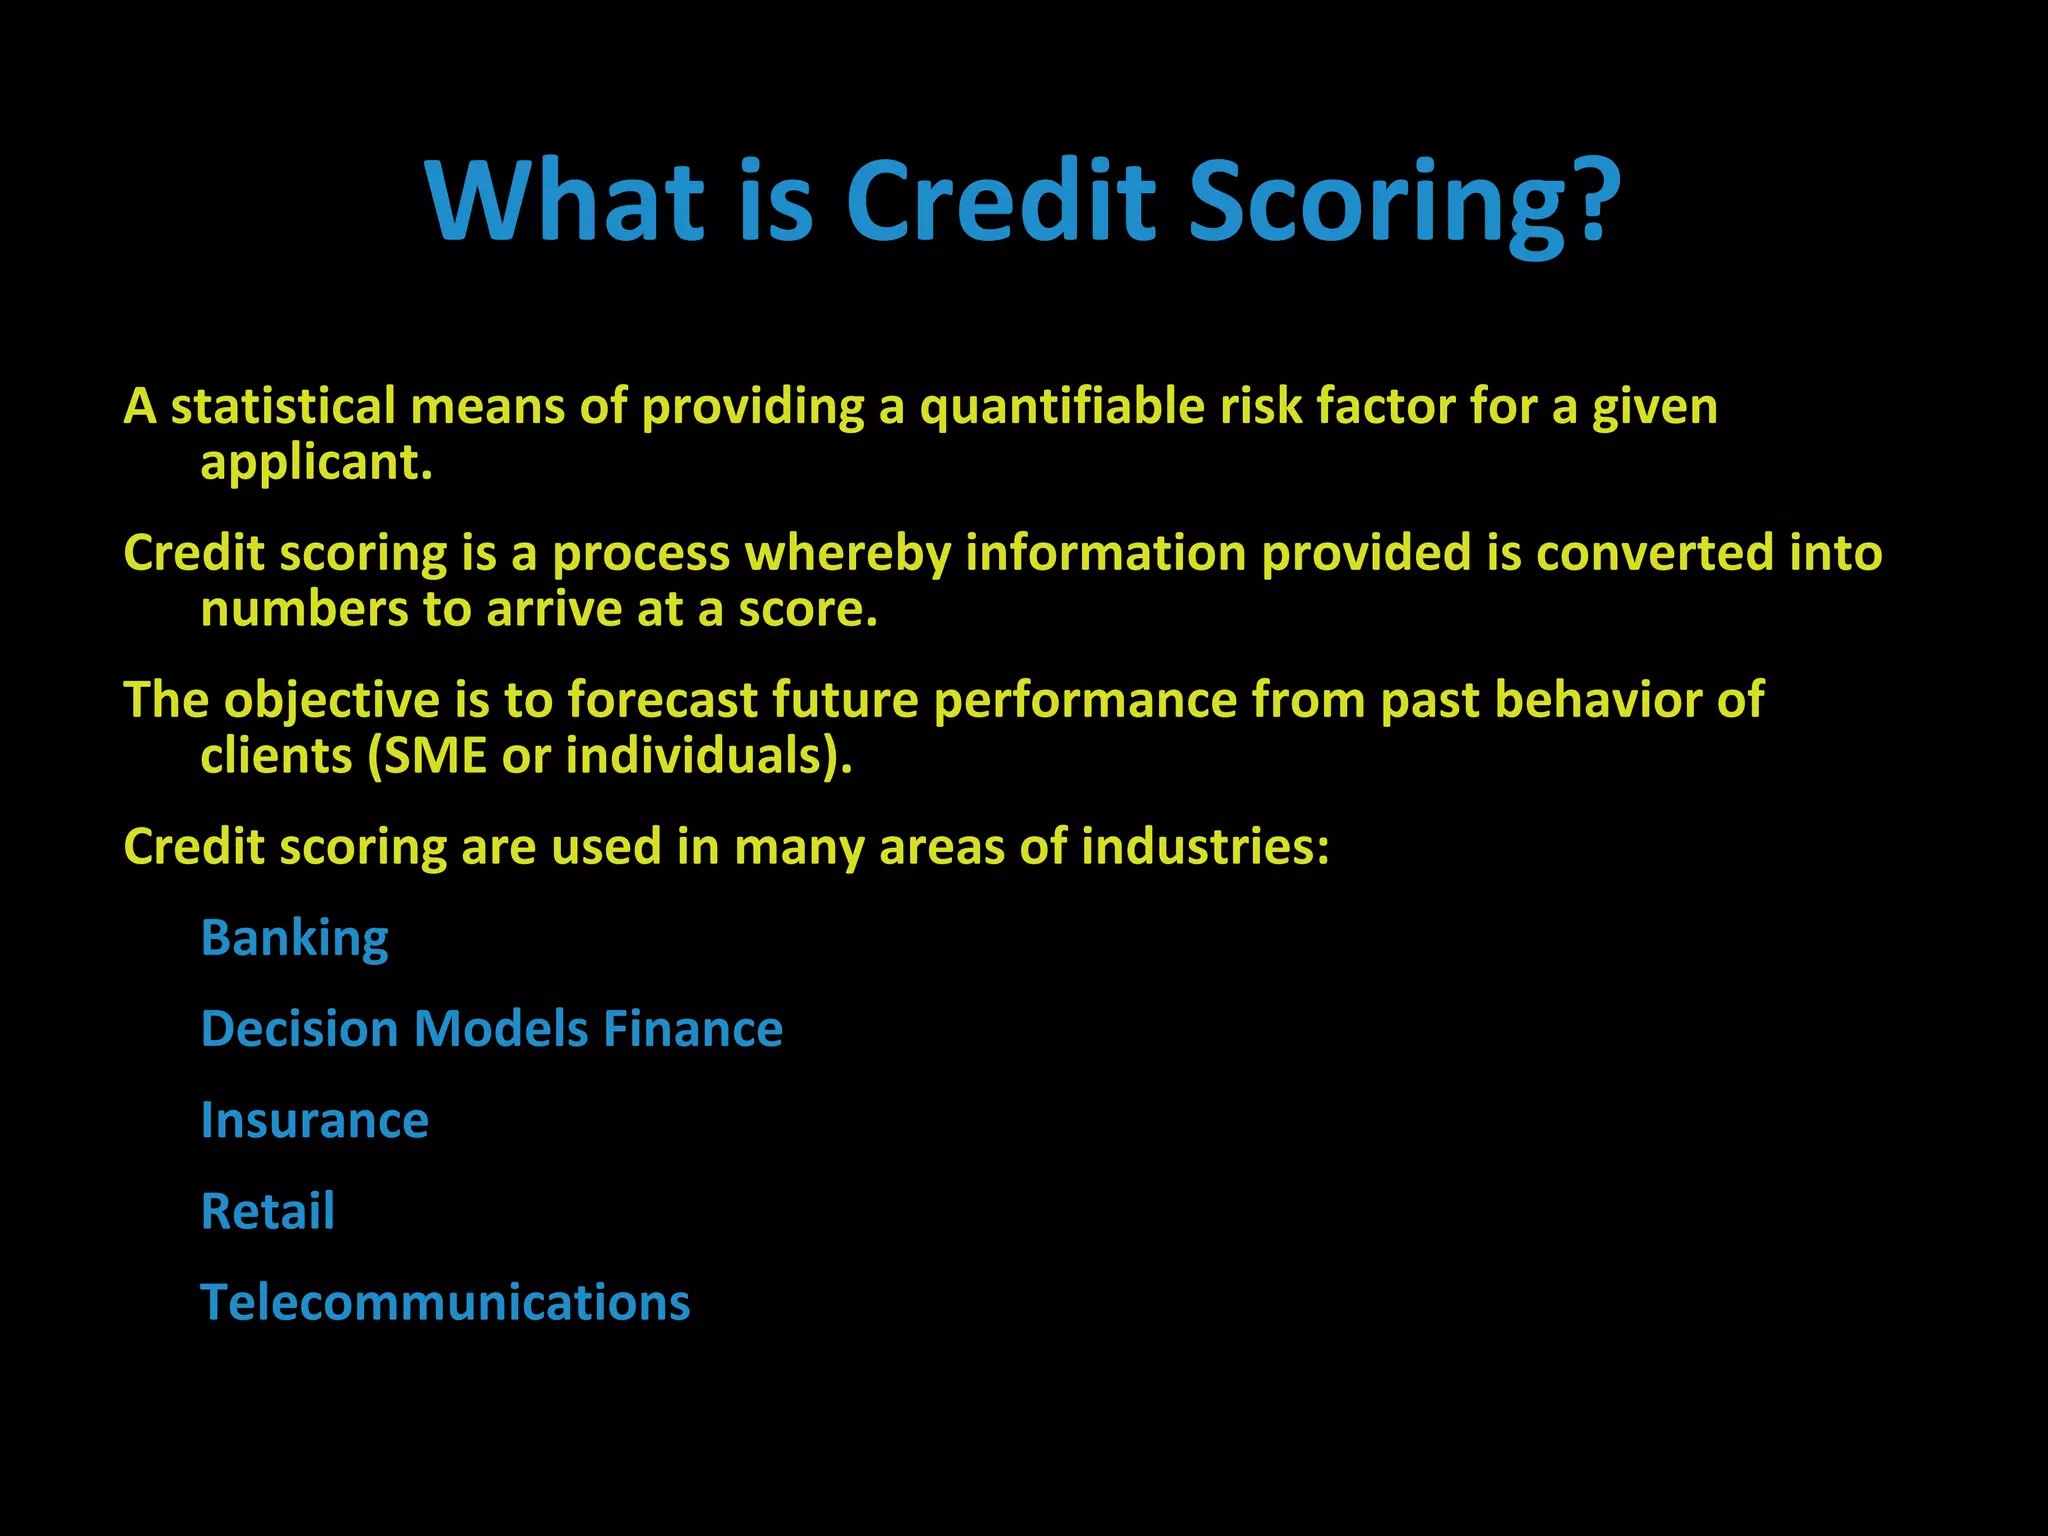
The document discusses credit risk management with AI tools. It summarizes that credit scoring is used to statistically quantify risk by converting applicant information into numbers and a score. The objective is to forecast future performance based on past client behavior. It then discusses using various machine learning models like HLVQ-C and neural networks to predict financial distress, classify companies, and improve bankruptcy prediction. The models were tested on real world credit and financial datasets.