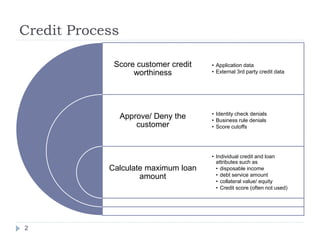
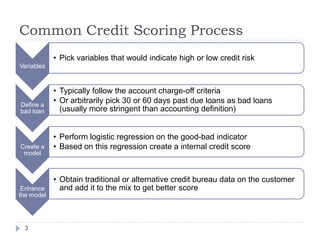
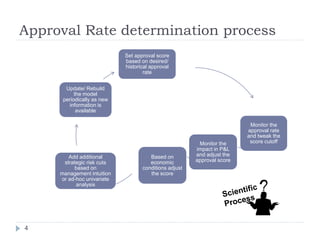
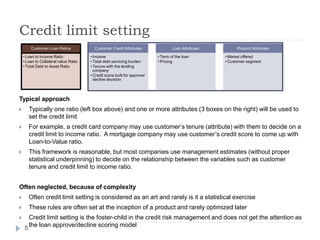
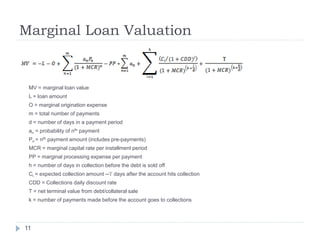
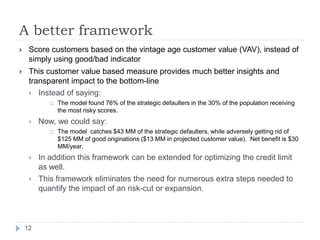
Framework for Consumer
        Credit Risk Analytics


                       Senthil Ramanath
    Head of Analytics, ACE Cash Express


1
Credit Process

             Score customer credit   • Application data
                  worthiness         • External 3rd party credit data


                                     • Identity check denials
                 Approve/ Deny the   • Business rule denials
                     customer        • Score cutoffs


                                     • Individual credit and loan
                                       attributes such as
            Calculate maximum loan     • disposable income
                    amount             • debt service amount
                                       • collateral value/ equity
                                       • Credit score (often not used)


2
Common Credit Scoring Process
            • Pick variables that would indicate high or low credit risk
Variables


            • Typically follow the account charge-off criteria
Define a
            • Or arbitrarily pick 30 or 60 days past due loans as bad loans
bad loan      (usually more stringent than accounting definition)


            • Perform logistic regression on the good-bad indicator
Create a    • Based on this regression create a internal credit score
 model


            • Obtain traditional or alternative credit bureau data on the customer
 Enhance      and add it to the mix to get better score
the model


 3
Approval Rate determination process
                            Set approval score
                            based on desired/
                            historical approval
                                    rate


       Update/ Rebuild
           the model
      periodically as new
        information is
            available

                                                                         Monitor the
                                                                        approval rate
                                                                        and tweak the
                                                        Monitor the      score cutoff
                                                       impact in P&L
        Add additional                Based on         and adjust the
      strategic risk cuts             economic         approval score
           based on                conditions adjust
     management intuition             the score
     or ad-hoc univariate
           analysis


4
Credit limit setting
        Customer-Loan Ratios             Customer Credit Attributes                Loan Attributes        Product Attributes

    • Loan to Income Ratio             • Income                            • Term of the loan        • Market offered
    • Loan to Collateral value Ratio   • Total debt servicing burden       • Pricing                 • Customer segment
    • Total Debt to Asset Ratio        • Tenure with the lending
                                         company
                                       • Credit score built for approve/
                                         decline decision


Typical approach
       Typically one ratio (left box above) and one or more attributes (3 boxes on the right) will be used to
        set the credit limit
       For example, a credit card company may use customer’s tenure (attribute) with them to decide on a
        credit limit to income ratio. A mortgage company may use customer’s credit score to come up with
        Loan-to-Value ratio.
       This framework is reasonable, but most companies use management estimates (without proper
        statistical underpinning) to decide on the relationship between the variables such as customer
        tenure and credit limit to income ratio.


Often neglected, because of complexity
       Often credit limit setting is considered as an art and rarely is it a statistical exercise
       These rules are often set at the inception of a product and rarely optimized later
       Credit limit setting is the foster-child in the credit risk management and does not get the attention as
        the loan approve/decline scoring model
    5
Problems with traditional credit scoring and
limit setting approaches
       Credit Scoring Issues
           Wrong target


           Good-Bad indicator is not good enough
                   Many credit scoring bureaus use 60 DPD as bad indicator.


           What is a better target ?
               Are all the goods same? Are the bads equally bad?
               How about partially collected loans? Where do you draw the line?


    6
Excerpt from bankinganalyticsblog.fico.com-
- explaining performance of a model
       The model was precise in identifying strategic defaulters among a 30-to-180-
        day delinquent population (not yet written off).


       It found 76% of the strategic defaulters in the 30% of the population
        receiving the most risky scores.


       The analytic separation is sharp—the most risky decile of borrowers are
        200-times more likely to strategically default than the least risky decile of
        borrowers.


    7
Start with Customer Life-time value (LTV)
       Customer life-time value estimation is not just
        marketing holy grail, it is also an essential part of
        credit risk management
           For instance in credit card industry, identify the first 1
            year, 2 year, 4 year and 8 year values obtained per
            customer in a segment.
           Based on these values customer LTV may be
            extrapolated
           For analytical purposes select a vintage age customer
            value (VAV) as a proxy for customer life-time value (LTV)


    8
Vintage-age customer value (VAV)
       Vintage-age customer value (VAV) can be defined as the cumulative
        remaining marginal transaction value for the next x years for a given
        customer, including the current transaction

       Selecting a vintage age (x number of years) for the VAV computation
        has the following tradeoffs:
           Longer the age, it is better proxy for customer LTV
           Shorter the age the more recent origination can be used for analytics (this
            factor usually dominates the tradeoff decision)


       Choose a vintage age and then for each transaction with a customer
        calculate the VAV


    9
Framework to discount for collection efforts
        One of the major issues with calculating loan or customer value is
                Should collections expense be allocated to loans for marginal value computation?
                If so, how can one allocate collections expense to a specific loan?
        It makes sense to consider collection expenses as marginal given the number and
         homogeneity of the job
        The following equation packs collection expenses into a factor called collections daily
         discount rate


        h = number of days in collection before the debt is sold off
        Cli = actual collection amount on the ith day after an account hits collection
        CDD = Collections daily discount rate
        CE = Collections expense (actual)


       Iterate the equation above with varying CDD values until CDD converges to a stable value
       Solve for separate CDD values for different product types
       This enables calculating the Loan Valuation using the following in the next slide

10
Marginal Loan Valuation


 MV = marginal loan value
 L = loan amount
 O = marginal origination expense
 m = total number of payments
 d = number of days in a payment period
 an = probability of nth payment
 Pn = nth payment amount (includes pre-payments)
 MCR = marginal capital rate per installment period
 PP = marginal processing expense per payment
 h = number of days in collection before the debt is sold off
 Ci = expected collection amount --‘i’ days after the account hits collection
 CDD = Collections daily discount rate
 T = net terminal value from debt/collateral sale
 k = number of payments made before the account goes to collections


11
A better framework
    Score customers based on the vintage age customer value (VAV), instead of
     simply using good/bad indicator
    This customer value based measure provides much better insights and
     transparent impact to the bottom-line
      Instead of saying:
               The model found 76% of the strategic defaulters in the 30% of the population receiving
                the most risky scores.
        Now, we could say:
               The model catches $43 MM of the strategic defaulters, while adversely getting rid of
                $125 MM of good originations ($13 MM in projected customer value). Net benefit is $30
                MM/year.
        In addition this framework can be extended for optimizing the credit limit
         as well.
        This framework eliminates the need for numerous extra steps needed to
         quantify the impact of an risk-cut or expansion.


    12

Credit Risk Analytics

  • 1.
    Framework for Consumer Credit Risk Analytics Senthil Ramanath Head of Analytics, ACE Cash Express 1
  • 2.
    Credit Process Score customer credit • Application data worthiness • External 3rd party credit data • Identity check denials Approve/ Deny the • Business rule denials customer • Score cutoffs • Individual credit and loan attributes such as Calculate maximum loan • disposable income amount • debt service amount • collateral value/ equity • Credit score (often not used) 2
  • 3.
    Common Credit ScoringProcess • Pick variables that would indicate high or low credit risk Variables • Typically follow the account charge-off criteria Define a • Or arbitrarily pick 30 or 60 days past due loans as bad loans bad loan (usually more stringent than accounting definition) • Perform logistic regression on the good-bad indicator Create a • Based on this regression create a internal credit score model • Obtain traditional or alternative credit bureau data on the customer Enhance and add it to the mix to get better score the model 3
  • 4.
    Approval Rate determinationprocess Set approval score based on desired/ historical approval rate Update/ Rebuild the model periodically as new information is available Monitor the approval rate and tweak the Monitor the score cutoff impact in P&L Add additional Based on and adjust the strategic risk cuts economic approval score based on conditions adjust management intuition the score or ad-hoc univariate analysis 4
  • 5.
    Credit limit setting Customer-Loan Ratios Customer Credit Attributes Loan Attributes Product Attributes • Loan to Income Ratio • Income • Term of the loan • Market offered • Loan to Collateral value Ratio • Total debt servicing burden • Pricing • Customer segment • Total Debt to Asset Ratio • Tenure with the lending company • Credit score built for approve/ decline decision Typical approach  Typically one ratio (left box above) and one or more attributes (3 boxes on the right) will be used to set the credit limit  For example, a credit card company may use customer’s tenure (attribute) with them to decide on a credit limit to income ratio. A mortgage company may use customer’s credit score to come up with Loan-to-Value ratio.  This framework is reasonable, but most companies use management estimates (without proper statistical underpinning) to decide on the relationship between the variables such as customer tenure and credit limit to income ratio. Often neglected, because of complexity  Often credit limit setting is considered as an art and rarely is it a statistical exercise  These rules are often set at the inception of a product and rarely optimized later  Credit limit setting is the foster-child in the credit risk management and does not get the attention as the loan approve/decline scoring model 5
  • 6.
    Problems with traditionalcredit scoring and limit setting approaches  Credit Scoring Issues  Wrong target  Good-Bad indicator is not good enough  Many credit scoring bureaus use 60 DPD as bad indicator.  What is a better target ?  Are all the goods same? Are the bads equally bad?  How about partially collected loans? Where do you draw the line? 6
  • 7.
    Excerpt from bankinganalyticsblog.fico.com- -explaining performance of a model  The model was precise in identifying strategic defaulters among a 30-to-180- day delinquent population (not yet written off).  It found 76% of the strategic defaulters in the 30% of the population receiving the most risky scores.  The analytic separation is sharp—the most risky decile of borrowers are 200-times more likely to strategically default than the least risky decile of borrowers. 7
  • 8.
    Start with CustomerLife-time value (LTV)  Customer life-time value estimation is not just marketing holy grail, it is also an essential part of credit risk management  For instance in credit card industry, identify the first 1 year, 2 year, 4 year and 8 year values obtained per customer in a segment.  Based on these values customer LTV may be extrapolated  For analytical purposes select a vintage age customer value (VAV) as a proxy for customer life-time value (LTV) 8
  • 9.
    Vintage-age customer value(VAV)  Vintage-age customer value (VAV) can be defined as the cumulative remaining marginal transaction value for the next x years for a given customer, including the current transaction  Selecting a vintage age (x number of years) for the VAV computation has the following tradeoffs:  Longer the age, it is better proxy for customer LTV  Shorter the age the more recent origination can be used for analytics (this factor usually dominates the tradeoff decision)  Choose a vintage age and then for each transaction with a customer calculate the VAV 9
  • 10.
    Framework to discountfor collection efforts  One of the major issues with calculating loan or customer value is  Should collections expense be allocated to loans for marginal value computation?  If so, how can one allocate collections expense to a specific loan?  It makes sense to consider collection expenses as marginal given the number and homogeneity of the job  The following equation packs collection expenses into a factor called collections daily discount rate h = number of days in collection before the debt is sold off Cli = actual collection amount on the ith day after an account hits collection CDD = Collections daily discount rate CE = Collections expense (actual)  Iterate the equation above with varying CDD values until CDD converges to a stable value  Solve for separate CDD values for different product types  This enables calculating the Loan Valuation using the following in the next slide 10
  • 11.
    Marginal Loan Valuation MV = marginal loan value L = loan amount O = marginal origination expense m = total number of payments d = number of days in a payment period an = probability of nth payment Pn = nth payment amount (includes pre-payments) MCR = marginal capital rate per installment period PP = marginal processing expense per payment h = number of days in collection before the debt is sold off Ci = expected collection amount --‘i’ days after the account hits collection CDD = Collections daily discount rate T = net terminal value from debt/collateral sale k = number of payments made before the account goes to collections 11
  • 12.
    A better framework  Score customers based on the vintage age customer value (VAV), instead of simply using good/bad indicator  This customer value based measure provides much better insights and transparent impact to the bottom-line  Instead of saying:  The model found 76% of the strategic defaulters in the 30% of the population receiving the most risky scores.  Now, we could say:  The model catches $43 MM of the strategic defaulters, while adversely getting rid of $125 MM of good originations ($13 MM in projected customer value). Net benefit is $30 MM/year.  In addition this framework can be extended for optimizing the credit limit as well.  This framework eliminates the need for numerous extra steps needed to quantify the impact of an risk-cut or expansion. 12