Download as PDF, PPTX


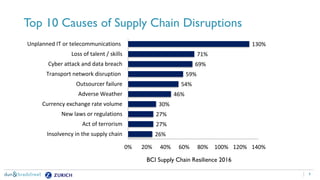
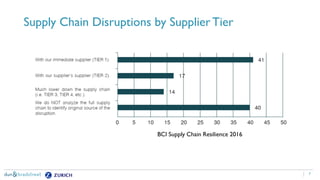
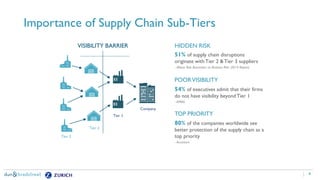

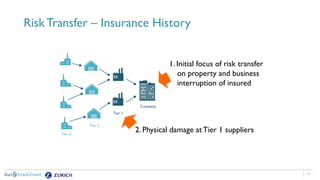
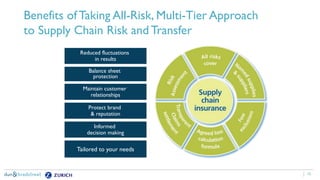
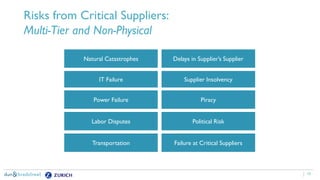
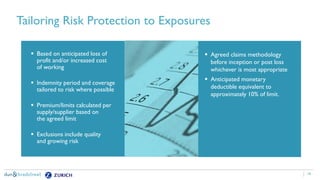
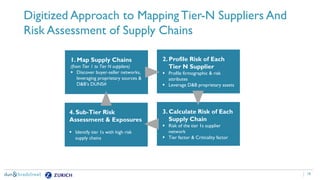
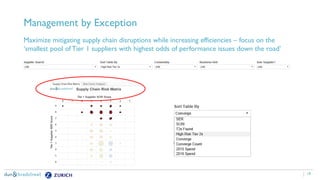
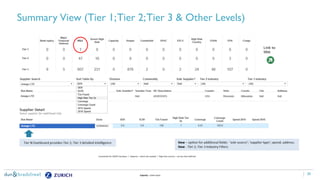
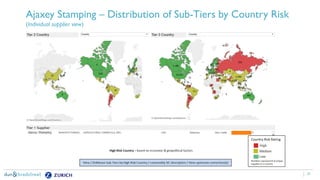


The document discusses the need for companies to anticipate hidden risks in their supply chains using advanced analytics and to reduce losses through supplier insurance. Key insights reveal that a significant portion of supply chain disruptions originates from tier 2 and tier 3 suppliers, emphasizing the importance of visibility and risk management across all supply tiers. Additionally, it highlights the adoption of technology and risk transfer solutions to better protect supply chains and mitigate potential disruptions.


