Download to read offline


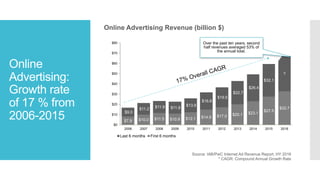
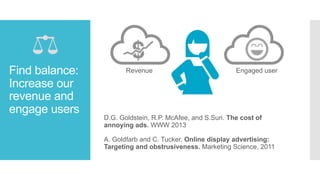
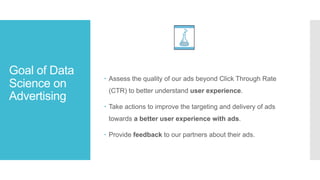
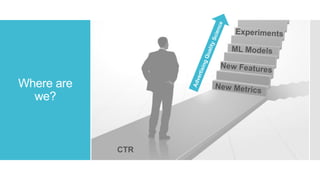


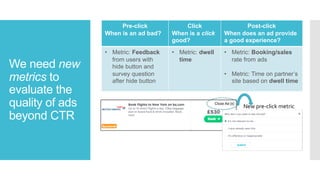
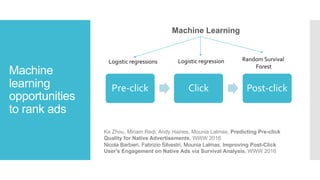
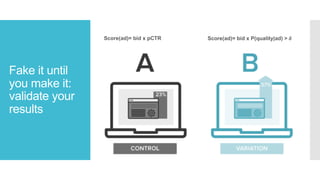
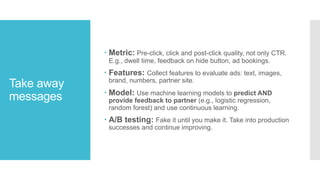


This document discusses assessing the effectiveness of online ads beyond just click-through rate (CTR). It notes that while online ad revenue has grown significantly in recent years, balancing revenue and user engagement is important. The document advocates using new metrics like dwell time and user feedback to evaluate ad quality before, during, and after clicks. It suggests using machine learning models to predict ad quality and provide partners feedback. The key takeaways are to measure pre-click, click, and post-click ad quality; collect relevant ad features; apply models for prediction and feedback; and continuously test and improve rankings.


![[X+1] hotel case study](https://cdn.slidesharecdn.com/ss_thumbnails/x1hotelcasestudy-100524142718-phpapp01-thumbnail.jpg?width=640&height=640&fit=bounds)


