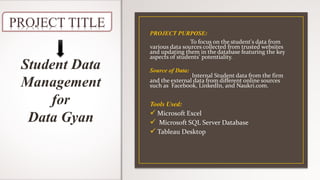
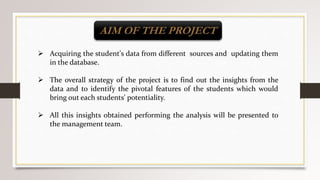
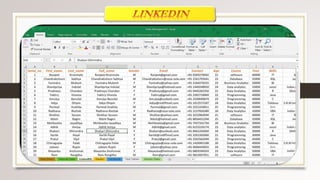
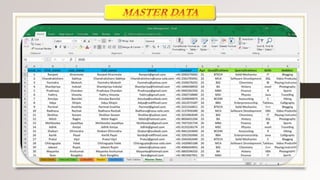
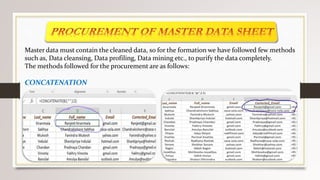
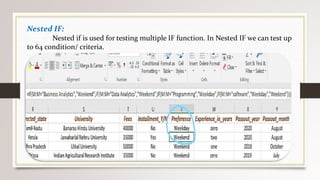
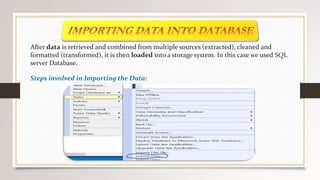
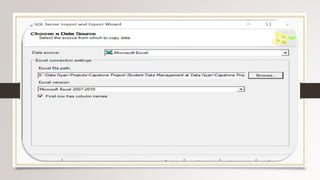
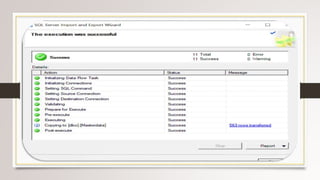
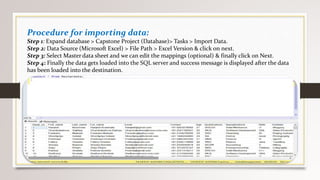
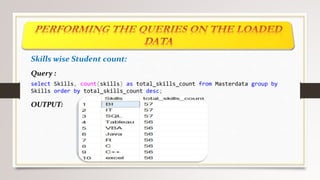
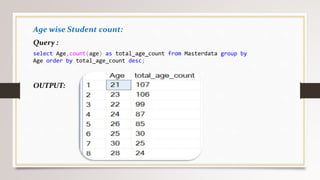
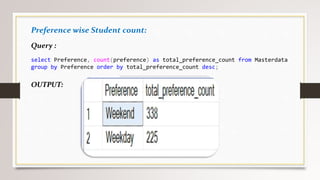
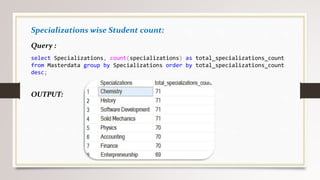
This document describes a project to collect student data from various internal and external sources, cleanse the data, load it into a SQL database, and perform analysis. Key points:
- Student data was collected from the firm and sources like LinkedIn, Facebook, and Naukri. It was cleansed and merged into a master Excel file.
- The cleansed data was then loaded into a SQL Server database using import functions.
- Queries were written to analyze the data, such as counts of students by skills, age, fees, and other attributes.
- The goal is to gain insights from the data to help the management team make decisions around areas to focus, courses to offer,
The document summarizes the team's approach to the KDD Cup 2014 competition to predict exciting projects on the DonorsChoose.org platform. It describes the provided data, data preprocessing steps including handling missing data and feature encoding. It then discusses the main methods used: random forests, gradient boosting regression trees, and logistic regression. The team also tested neural networks but faced challenges training the models. Their final submission was an ensemble of the three main methods, weighted based on their performance.
Coverage-Criteria-for-Testing-SQL-QueriesMohamed Reda
This document discusses testing SQL queries by defining coverage criteria. It introduces coverage criteria for evaluating how well a test suite exercises different situations that could affect the data retrieved by an SQL query. These include criteria related to query clauses like selection, joining, grouping and having. The document also discusses representing SQL queries as control flow graphs and applying criteria like condition coverage to account for all possible combinations of condition evaluations. Automatic test case generation and population of test databases is discussed to evaluate coverage based on the criteria.
ESOFT Metro Campus - Diploma in Software Engineering - (Module IV) Database Concepts
(Template - Virtusa Corporate)
Contents:
Introduction to Databases
Data
Information
Database
Database System
Database Applications
Evolution of Databases
Traditional Files Based Systems
Limitations in Traditional Files
The Database Approach
Advantages of Database Approach
Disadvantages of Database Approach
Database Management Systems
DBMS Functions
Database Architecture
ANSI-SPARC 3 Level Architecture
The Relational Data Model
What is a Relation?
Primary Key
Cardinality and Degree
Relationships
Foreign Key
Data Integrity
Data Dictionary
Database Design
Requirements Collection and analysis
Conceptual Design
Logical Design
Physical Design
Entity Relationship Model
A mini-world example
Entities
Relationships
ERD Notations
Cardinality
Optional Participation
Entities and Relationships
Attributes
Entity Relationship Diagram
Entities
ERD Showing Weak Entities
Super Type / Sub Type Relationships
Mapping ERD to Relational
Map Regular Entities
Map Weak Entities
Map Binary Relationships
Map Associated Entities
Map Unary Relationships
Map Ternary Relationships
Map Supertype/Subtype Relationships
Normalization
Advantages of Normalization
Disadvantages of Normalization
Normal Forms
Functional Dependency
Purchase Order Relation in 0NF
Purchase Order Relation in 1NF
Purchase Order Relations in 2NF
Purchase Order Relations in 3NF
Normalized Relations
BCNF – Boyce Codd Normal Form
Structured Query Language
What We Can Do with SQL ?
SQL Commands
SQL CREATE DATABASE
SQL CREATE TABLE
SQL DROP
SQL Constraints
SQL NOT NULL
SQL PRIMARY KEY
SQL CHECK
SQL FOREIGN KEY
SQL ALTER TABLE
SQL INSERT INTO
SQL INSERT INTO SELECT
SQL SELECT
SQL SELECT DISTINCT
SQL WHERE
SQL AND & OR
SQL ORDER BY
SQL UPDATE
SQL DELETE
SQL LIKE
SQL IN
SQL BETWEEN
SQL INNER JOIN
SQL LEFT JOIN
SQL RIGHT JOIN
SQL UNION
SQL AS
SQL Aggregate Functions
SQL Scalar functions
SQL GROUP BY
SQL HAVING
Database Administration
SQL Database Administration
This document provides an overview of the statistical software IBM SPSS and its uses. It discusses SPSS's abilities in descriptive statistics, bivariate statistics, prediction, and identifying groups. The document also explores the basic use of SPSS, including how to enter data and define variable meanings. Finally, it examines the dataset "country.sav" that could be used for a class project, focusing on variables like GDP, life expectancy, and healthcare that reflect living standards across countries.
The document discusses data modeling and entity relationship diagrams. It defines data modeling as the process of defining and analyzing data requirements to support business processes. It describes the different types of data models including conceptual, logical, and physical models. It also explains the key components of entity relationship diagrams including entities, attributes, relationships, cardinality, and notation. The document provides an example of using an ERD to model a scenario involving departments, supervisors, employees, and projects.
This presentation contains the concepts related to database design using ER Diagram. The content is adapted from the contents of the authors of the book mentioned in the reference.
This Presentation would make you understand the Fundamentals of Database Design, Data Models (Conceptual, Logical & Physical), ERD, ERM. Also, have real-life examples and case study to understand better.
Entity Integrity Constraint:
It states that in a relation no attribute of a primary key (K) can have a null value. If a K consists of a single attribute, this constraint obviously applies on this attribute, so it cannot have the Null value. However, if a K consists of multiple attributes, then none of the attributes of this K can have the Null value in any of the instances.
Referential Integrity Constraint :
This constraint is applied to foreign keys. Foreign key is an attribute or attribute combination of a relation that is the primary key of another relation. This constraint states that if a foreign key exists in a relation, either the foreign key value must match the primary key value of some tuple in its home relation or the foreign key value must be completely null.
This document outlines the key concepts of database systems and the entity-relationship model. It defines what a database is, the advantages of using database management systems, and common DBMS architectures. It also explains the core components of the entity-relationship model including entities, attributes, relationships, keys, and degrees of relationships. The document provides examples and definitions to illustrate database and ER model concepts.
It is a semantic data model that is used for the graphical representation of the conceptual database design. The semantic data models provide more constructs that is why a database design in a semantic data model can contain/represent more details. With a semantic data model, it becomes easier to design the database, at the first place, and secondly it is easier to understand later. We also know that conceptual database is our first comprehensive design. It is independent of any particular implementation of the database, that is, the conceptual database design expressed in E-R data model can be implemented using any DBMS. For that we will have to transform the conceptual database design from E-R data model to the data model of the particular DBMS. There is no DBMS based on the E-R data model, so we have to transform the conceptual database design anyway.
For more classes visit
www.snaptutorial.com
This Tutorial contains 2 Set of Papers for each Assignment
CIS 515 Week 1 Assignment 1 Accessing Oracle (2 Papers)
IRJET- Resume Information Extraction FrameworkIRJET Journal
The document discusses a framework for extracting information from resumes. Resumes are semi-structured documents that contain varying information like different fields, field names, and formats, making them difficult to parse. The proposed framework uses text mining and rule-based parsing to extract keywords from resumes, scores qualifications and skills, clusters the extracted information using DBSCAN, and classifies the resumes using gradient boosting machines. It aims to help recruiters filter and categorize large numbers of resumes more efficiently.
Chapter-2 Database System Concepts and ArchitectureKunal Anand
This document provides an overview of database management systems concepts and architecture. It discusses different data models including hierarchical, network, relational, entity-relationship, object-oriented, and object-relational models. It also describes the 3-schema architecture with external, conceptual, and internal schemas and explains components of a DBMS including users, storage and query managers. Finally, it covers database languages like DDL, DML, and interfaces like menu-based, form-based and graphical user interfaces.
Data documentation and retrieval using unity in a universe®ANIL247048
This document proposes exploring using Unity and host-based programs to document a large system of tables in a UniVerse environment. It involves evaluating using Unity versus host programs to generate data documentation specifications (X-Specs) for the tables. The project would modify Unity to generate queries in the UniVerse query language (RETRIEVE) instead of SQL. This would allow accessing data on the host system, which is best for the multi-valued nature of UniVerse databases. The project aims to increase accessibility of documentation and data by addressing limitations of documenting via ODBC connectivity alone.
The document discusses several data models including flat file, hierarchical, network, relational, object-relational, and object-based models. It provides details on the flat file model, describing it as a single two-dimensional array containing data elements in columns and related elements in rows. The object-relational model combines relational and object-oriented features, allowing integration of databases with object-oriented data types and methods. The document also discusses the entity-relationship model, which is an object-based logical model that uses entities, attributes, and relationships to flexibly structure data and specify constraints.
This document summarizes three papers on keyword search over structured databases using an interpretative approach. The first paper discusses building an efficient index table to map keywords to row and column identifiers in the database. The second paper presents a general algorithm with two steps - a publication step to pre-compute indexing, and a search step to lookup keywords and generate SQL queries. The third paper introduces the concept of intrinsic and contextual weights to model the dependency between query keywords and generate a ranked list of query interpretations.
Enhanced Retrieval of Web Pages using Improved Page Rank Algorithmijnlc
Information Retrieval (IR) is a very important and vast area. While searching for context web returns all
the results related to the query. Identifying the relevant result is most tedious task for a user. Word Sense
Disambiguation (WSD) is the process of identifying the senses of word in textual context, when word has
multiple meanings. We have used the approaches of WSD. This paper presents a Proposed Dynamic Page
Rank algorithm that is improved version of Page Rank Algorithm. The Proposed Dynamic Page Rank
algorithm gives much better results than existing Google’s Page Rank algorithm. To prove this we have
calculated Reciprocal Rank for both the algorithms and presented comparative results.
This document discusses the importance of properly documenting research data. It notes that documentation allows data to be understood by those outside the original project and prevents inaccurate assumptions from being made if the data manipulations or variable meanings are unclear. Insufficient documentation can make data unusable or misinterpreted. The document outlines key elements to document like data elements, study details, and decisions made. It provides examples of documentation tools like codebooks, annotated instruments, and data narratives. Thorough documentation ensures research data remains useful and understandable.
This document discusses data migration in schemaless NoSQL databases. It begins by defining NoSQL databases and comparing them to traditional relational databases. It then covers aggregate data models and the concepts of schemalessness and implicit schemas in NoSQL databases. The main focus is on data migration when an implicit schema changes, including principles, strategies, and test options for ensuring data matches the new implicit schema in applications.
The document discusses the entity-relationship (ER) model for conceptual database design. It describes the basic constructs of the ER model including entities, attributes, relationships, keys, and various modeling choices. The ER model is useful for capturing the semantics of an application domain and producing a conceptual schema before logical and physical design.
Entity relationship modelling - DE L300Edwin Ayernor
The document discusses entity relationship modeling and describes its objectives as illustrating relationships between entities, incorporating relationships into database design, and describing how ER components affect design and implementation. It explains that ER modeling is a top-down conceptual database design process that describes data, relationships, and constraints. The output is a conceptual data model and data dictionary. It details how to gather information, define entities and attributes, identify different types of relationships and their cardinalities, and convert many-to-many relationships into one-to-many relationships using composite or bridge entities. The document also provides guidelines for evaluating ER models based on accuracy, non-redundancy, and other principles.
The schemas as it has been defined already; is the repository used for storing definitions of the structures used in database, it can be anything from any entity to the whole organization. For this purpose the architecture defines different schemas stored at different levels for isolating the details one level from the other.
Different levels existing pat different levels of the database architecture pare expressed below with emphasis on the details of all the levels individually. Core of the database architecture is the internal level of schema which is discussed a bit before getting into the details of each level individually.
Development of a new indexing technique for XML document retrievalAmjad Ali
The document proposes a new indexing technique for XML document retrieval that addresses issues with existing techniques. It represents an XML document as a tree structure with nodes corresponding to elements, attributes, and content. Nodes are labeled with start/end positions and level to allow efficient updates by leaving gaps between labels. The technique permits fast retrieval of ancestor-descendant and parent-child relationships without recomputing the index on updates. Future work could include indexing comments and handling two separate indices for updates and queries.
This document describes the design of an online admission system for the Virtual University of Pakistan. It includes sections that outline the entity relationship diagram, sequence diagrams, architecture design, class diagram, database design, interface design, and test cases for the system. The system will allow students to apply for admission online from anywhere by entering their personal and academic details, submitting application forms, and receiving confirmation via email. The document provides details on how the different components of the system will be structured and work together.
Students academic performance using clustering techniquesaniacorreya
This document summarizes a study analyzing students' academic performance data. The study collected internal and external marks for 45 students over 5 semesters. It cleaned the data, transforming the marks into sums, and used k-means clustering to group students into 4 categories (excellent, good, fair, poor) for each semester based on their internal and external marks. The analysis found the clusters followed the same performance pattern each semester, with students scoring higher internally also scoring higher externally, indicating a direct relationship between internal and external marks. The study concluded a student's university exam performance can generally be predicted from their internal marks.
CGPA otherwise called Cumulative Grade Points. Average is the normal of Grade Points acquired in every one of the subjects secured till date. It is trusted that it gives a general knowledge into the level of devotion, truthfulness and diligent work put by the understudy.
However there might be where an understudy who is remarkable at programming may not appreciate other hypothetical subjects like programming testing. Notwithstanding, CGPA comes up short when such a situation comes into picture.
Using Multiple Tools to Create DashboardsColby Stoever
The document discusses creating dashboards using multiple tools by pulling data from various sources into databases. It describes using SAS macros and SQL stored procedures to automate dashboard updates by storing recurring reports and datasets. Key points covered include identifying frequently requested data, designing databases for measures and grouped/summarized data, moving data into formats for tools like Tableau, and scheduling automatic updates. Security, customization for different audiences, and the purpose of dashboards for stakeholders are also addressed.
This document describes a data warehouse and business intelligence project for analyzing Starbucks store data. It discusses extracting data from various structured, semi-structured, and unstructured sources, transforming the data using SQL and R, and loading it into a star schema data warehouse with fact and dimension tables. The data warehouse is then used for business queries and analysis in Tableau, with case studies examining city revenue, visitor and beverage sales by city, and city ratings based on food and beverage counts. The analysis finds that New York City generally has the highest revenue, visitor counts, and ratings.
Major AssignmentDue5pm Friday, Week 11. If you unable to submit on.docxinfantsuk
Major AssignmentDue
5pm Friday, Week 11. If you unable to submit on time please upload an extension request 24 hours prior (see Assignments folder on MySCU).Objectives
This assignment will provide practice and experience in:
· Writing a program – Topic 2
· Debugging– Topic 3
· Stepwise Refinement & Modularisation – Topic 4 and Topic 10
· Selection – Topic 5
· Iteration – Topic 6
· Arrays – Topic 7
· File handling – Topic 9
· Structs – Topic 11
NB Depending on when you start this assignment you may need to read ahead especially on how to use files and structs.
Suggestions:
Read the assignment specifications carefully first. Write the first version of your program in Week 4 and then create new versions as you learn new topics. Do NOT leave it until Week 11 to start writing the program. Review Topic 4 on stepwise refinement. This is how you should approach the major. Also note that though your program must do something and must compile it does not have to be complete to earn marks.Specifications
One of the many tasks that programmers get asked to do is to convert data from one form to another. Frequently data is presented to users in well-labelled, tabular form for easy reading. However, it is impossible or very difficult to do further processing of the data unless it is changed into a more useful form.
For the purposes of this assignment I have downloaded and will make available the undergraduate applications to the 37 Australian universities from the Department of Education for 2009 – 2013 data file as a text file.
Your program will load this data into an array of structs, save the data in a form that is directly usable by a database (see below), display the data on the console in its original form and in its database form. It will also allow the user to display the highest number of applications for a given state and year.
Your program will use a menu to allow the user to choose what task is to be done. You will only be required to handle the Applications data. You can ignore the Offers and Offers rates data (see below).Data
See “undergraduateapplicationsoffersandacceptances2013appendices.txt” for the original data.
This is the data your program should produce and save:
New South Wales Charles Sturt University 4265 4298 4287 4668 4614
New South Wales Macquarie University 6255 6880 7294 7632 7625
New South Wales Southern Cross University 2432 2742 2573 2666 2442
New South Wales The University of New England 1601 1531 1504 1632 1690
New South Wales The University of New South Wales 10572 10865 11077 11008 11424
New South Wales The University of Newcastle 9364 9651 9876 10300 10571
New South Wales The University of Sydney 13963 14631 14271 14486 15058
New South Wales "University of Technology, Sydney" 10155 9906 9854 10621 9614
New South Wales University of Western Sydney 11251 11776 11713 11947 13158
New South Wales University of Wollongong 3645 3685 3843 3801 3608
Victoria Deakin University 10780 12301 11223 11443 11288
Victori ...
Student’s Skills Evaluation Techniques using Data Mining.IOSRjournaljce
This document discusses techniques for evaluating students' programming skills using data mining. It proposes using association rule mining to analyze student data and accurately predict their programming abilities. The key steps involve collecting student performance data, preprocessing the data, extracting features, clustering students based on skills, generating rules for skill evaluation, and predicting student skill types based on the rules. The overall goal is to help educational institutions and companies better evaluate programming skills to improve student training and increase placement opportunities.
This document discusses data processing and analysis. It defines key terms like data, information, variables, and cases. It explains that data processing involves collecting, organizing, and analyzing raw data to produce useful information. The main steps in data processing are editing, coding, classification, data entry, validation, and tabulation. Types of data processing include manual, electronic data processing (EDP), real-time processing, and batch processing. The data processing cycle involves input, processing, and output stages to convert data into accurate and useful information.
James Colby Maddox Business Intellignece and Computer Science Portfoliocolbydaman
This portfolio covers the business intelligence course work I have completed at Set Focus, and some of the course work I have completed at Kennesaw State University
Just finished a basic course on data science (highly recommend it if you wish to explore what data science is all about). Here are my takeaways from the course.
This document is a WebQuest assignment for 12th grade statistics students that involves analyzing correlations between various baseball team statistics and winning percentage. Students will work in groups to find team statistics for the league, calculate correlations between each statistic and winning percentage, determine which two statistics have the largest impact, and use regression to predict how adding two new players would affect winning percentage. They will then write a report for their team owner with their analysis and recommendations.
The document summarizes a group project using Microsoft Azure Machine Learning Studio to build predictive models for identifying employees likely to get promoted. The group tested various models on a machine learning competition and selected a Two Class Boosted Decision Tree model, which had the highest accuracy and F1 score. The group further tuned the model hyperparameters and submitted the best model and a refined third-ranked model. While the results were similar, the submission scored higher on the leaderboard. The group reflected on learning machine learning tools in Azure and opportunities to improve the model through additional data preparation.
This document discusses the history and development of databases. It outlines the major stages in database evolution from the 1960s to today. Key developments included Codd's relational model in the 1970s, the entity relationship model in the 1970s, and the emergence of SQL and commercial relational database systems in the 1980s. The document also describes the three major steps in database development - data modeling, database design, and database build. It provides an example of modeling employee and department data in an entity relationship diagram and designing those entities as tables with columns, keys, and data types.
IRJET- Design and Development of Ranking System using Sentimental AnalysisIRJET Journal
1) The document presents RANKBOX, a ranking system that mines complex relationships in college/school data based on user feedback.
2) It uses sentiment analysis and machine learning to automatically personalize rankings according to user preferences and continuously improve based on user feedback.
3) The system was implemented as a web application that allows users to provide simple feedback on colleges/schools and view personalized rankings of subsequent queries based on their feedback.
This document summarizes the development of a Fitness 365 web portal. It includes developing the client side with general account settings forms, validation, and connecting it to the server side database. The client side is created with HTML, CSS, JavaScript and Bootstrap for compatibility across devices. AJAX is used to connect the client forms to backend functions that interface with the SQL database, performing actions like updating username. Appropriate validations and encryption algorithms are also implemented.
20150814 Wrangling Data From Raw to Tidy vsIan Feller
This document outlines best practices for processing raw data into tidy datasets. It discusses preparing by validating variables with a codebook, organizing by planning steps and labeling variables, quality control through reproducible code, and communication with comments, codebooks and providing raw and tidy datasets. The presentation demonstrates these practices using examples from agriculture and education data, showing how to reshape data, generate variables, and comment code for clarity.
The document describes a proposed college placement management system that aims to automate the manual processes currently used. It discusses how the existing manual system is time-consuming and prone to errors. The proposed system would use a database to store and organize student and company information, and automatically match eligible students to company requirements. Key aspects like database structure, interface for different users, and use of Oracle 10g for management are covered at a high level.
Data is a flourishing industry. This Kaggle dataset provides insights into some of the trade’s most common benefits, such as remote work opportunities, average salaries and job growth across the world.
This dataset intends to provide valuable understanding for data enthusiasts and answers common questions such as average income for a data professional in a specific country. Remote opportunity by experience level and/or company size. Or where most companied are located vs. where employees reside.
Come explore this trending industry with me!
Machine learning enables machines to learn from data and make predictions without being explicitly programmed. There are different types of machine learning problems like supervised learning (classification and regression), unsupervised learning (clustering), and reinforcement learning. Machine learning works by collecting data, preprocessing it, extracting features, selecting a model, training the model, evaluating it, and deploying it. Some common machine learning algorithms discussed are linear regression, logistic regression, and decision trees. Linear regression finds a linear relationship between variables to make predictions while logistic regression is used for classification problems.
This document discusses different tools that administrators can use to access student data: Data Mentor, NySTART, and Cognos. It provides information on the type of data each tool contains, who has access, and how to access each tool. It then gives examples of using each tool to analyze student performance data and identify gaps or trends. The document aims to help administrators explore how these tools can support efforts to improve student achievement.
Beyond Degrees - Empowering the Workforce in the Context of Skills-First.pptxEduSkills OECD
Iván Bornacelly, Policy Analyst at the OECD Centre for Skills, OECD, presents at the webinar 'Tackling job market gaps with a skills-first approach' on 12 June 2024
LAND USE LAND COVER AND NDVI OF MIRZAPUR DISTRICT, UPRAHUL
This Dissertation explores the particular circumstances of Mirzapur, a region located in the
core of India. Mirzapur, with its varied terrains and abundant biodiversity, offers an optimal
environment for investigating the changes in vegetation cover dynamics. Our study utilizes
advanced technologies such as GIS (Geographic Information Systems) and Remote sensing to
analyze the transformations that have taken place over the course of a decade.
The complex relationship between human activities and the environment has been the focus
of extensive research and worry. As the global community grapples with swift urbanization,
population expansion, and economic progress, the effects on natural ecosystems are becoming
more evident. A crucial element of this impact is the alteration of vegetation cover, which plays a
significant role in maintaining the ecological equilibrium of our planet.Land serves as the foundation for all human activities and provides the necessary materials for
these activities. As the most crucial natural resource, its utilization by humans results in different
'Land uses,' which are determined by both human activities and the physical characteristics of the
land.
The utilization of land is impacted by human needs and environmental factors. In countries
like India, rapid population growth and the emphasis on extensive resource exploitation can lead
to significant land degradation, adversely affecting the region's land cover.
Therefore, human intervention has significantly influenced land use patterns over many
centuries, evolving its structure over time and space. In the present era, these changes have
accelerated due to factors such as agriculture and urbanization. Information regarding land use and
cover is essential for various planning and management tasks related to the Earth's surface,
providing crucial environmental data for scientific, resource management, policy purposes, and
diverse human activities.
Accurate understanding of land use and cover is imperative for the development planning
of any area. Consequently, a wide range of professionals, including earth system scientists, land
and water managers, and urban planners, are interested in obtaining data on land use and cover
changes, conversion trends, and other related patterns. The spatial dimensions of land use and
cover support policymakers and scientists in making well-informed decisions, as alterations in
these patterns indicate shifts in economic and social conditions. Monitoring such changes with the
help of Advanced technologies like Remote Sensing and Geographic Information Systems is
crucial for coordinated efforts across different administrative levels. Advanced technologies like
Remote Sensing and Geographic Information Systems
9
Changes in vegetation cover refer to variations in the distribution, composition, and overall
structure of plant communities across different temporal and spatial scales. These changes can
occur natural.
This slide is special for master students (MIBS & MIFB) in UUM. Also useful for readers who are interested in the topic of contemporary Islamic banking.
A workshop hosted by the South African Journal of Science aimed at postgraduate students and early career researchers with little or no experience in writing and publishing journal articles.
हिंदी वर्णमाला पीपीटी, hindi alphabet PPT presentation, hindi varnamala PPT, Hindi Varnamala pdf, हिंदी स्वर, हिंदी व्यंजन, sikhiye hindi varnmala, dr. mulla adam ali, hindi language and literature, hindi alphabet with drawing, hindi alphabet pdf, hindi varnamala for childrens, hindi language, hindi varnamala practice for kids, https://www.drmullaadamali.com
How to Make a Field Mandatory in Odoo 17Celine George
In Odoo, making a field required can be done through both Python code and XML views. When you set the required attribute to True in Python code, it makes the field required across all views where it's used. Conversely, when you set the required attribute in XML views, it makes the field required only in the context of that particular view.
This document provides an overview of wound healing, its functions, stages, mechanisms, factors affecting it, and complications.
A wound is a break in the integrity of the skin or tissues, which may be associated with disruption of the structure and function.
Healing is the body’s response to injury in an attempt to restore normal structure and functions.
Healing can occur in two ways: Regeneration and Repair
There are 4 phases of wound healing: hemostasis, inflammation, proliferation, and remodeling. This document also describes the mechanism of wound healing. Factors that affect healing include infection, uncontrolled diabetes, poor nutrition, age, anemia, the presence of foreign bodies, etc.
Complications of wound healing like infection, hyperpigmentation of scar, contractures, and keloid formation.
How to Setup Warehouse & Location in Odoo 17 InventoryCeline George
In this slide, we'll explore how to set up warehouses and locations in Odoo 17 Inventory. This will help us manage our stock effectively, track inventory levels, and streamline warehouse operations.
This presentation includes basic of PCOS their pathology and treatment and also Ayurveda correlation of PCOS and Ayurvedic line of treatment mentioned in classics.
ISO/IEC 27001, ISO/IEC 42001, and GDPR: Best Practices for Implementation and...PECB
Denis is a dynamic and results-driven Chief Information Officer (CIO) with a distinguished career spanning information systems analysis and technical project management. With a proven track record of spearheading the design and delivery of cutting-edge Information Management solutions, he has consistently elevated business operations, streamlined reporting functions, and maximized process efficiency.
Certified as an ISO/IEC 27001: Information Security Management Systems (ISMS) Lead Implementer, Data Protection Officer, and Cyber Risks Analyst, Denis brings a heightened focus on data security, privacy, and cyber resilience to every endeavor.
His expertise extends across a diverse spectrum of reporting, database, and web development applications, underpinned by an exceptional grasp of data storage and virtualization technologies. His proficiency in application testing, database administration, and data cleansing ensures seamless execution of complex projects.
What sets Denis apart is his comprehensive understanding of Business and Systems Analysis technologies, honed through involvement in all phases of the Software Development Lifecycle (SDLC). From meticulous requirements gathering to precise analysis, innovative design, rigorous development, thorough testing, and successful implementation, he has consistently delivered exceptional results.
Throughout his career, he has taken on multifaceted roles, from leading technical project management teams to owning solutions that drive operational excellence. His conscientious and proactive approach is unwavering, whether he is working independently or collaboratively within a team. His ability to connect with colleagues on a personal level underscores his commitment to fostering a harmonious and productive workplace environment.
Date: May 29, 2024
Tags: Information Security, ISO/IEC 27001, ISO/IEC 42001, Artificial Intelligence, GDPR
-------------------------------------------------------------------------------
Find out more about ISO training and certification services
Training: ISO/IEC 27001 Information Security Management System - EN | PECB
ISO/IEC 42001 Artificial Intelligence Management System - EN | PECB
General Data Protection Regulation (GDPR) - Training Courses - EN | PECB
Webinars: https://pecb.com/webinars
Article: https://pecb.com/article
-------------------------------------------------------------------------------
For more information about PECB:
Website: https://pecb.com/
LinkedIn: https://www.linkedin.com/company/pecb/
Facebook: https://www.facebook.com/PECBInternational/
Slideshare: http://www.slideshare.net/PECBCERTIFICATION
1. Student Data
Management
for
Data Gyan
PROJECT PURPOSE:
To focus on the student's data from
various data sources collected from trusted websites
and updating them in the database featuring the key
aspects of students’ potentiality.
Source of Data:
Internal Student data from the firm
and the external data from different online sources
such as Facebook, LinkedIn, and Naukri.com.
Tools Used:
Microsoft Excel
Microsoft SQL Server Database
Tableau Desktop
PROJECT TITLE
2. Acquiring the student's data from different sources and updating them
in the database.
The overall strategy of the project is to find out the insights from the
data and to identify the pivotal features of the students which would
bring out each students' potentiality.
All this insights obtained performing the analysis will be presented to
the management team.
3.
4. Data collection was done mainly in two parts which are as follows:
1. Internal Data:
As the first step involves the data collection, the Management team
provided us with the internal data for the analytical process.
2. External Data:
External data were extracted from various online sources such as
LinkedIn, Facebook, Naukri & both the internal and External data was jotted
down to Microsoft Excel for further process.
5.
6.
7.
8.
9. Internal Data:
We received the internal data from the management team of Data Gyan and the attributes
pertaining to it were Names, Gender, Email, Contact No, Educational background, Age, courses pursued, Fees,
Installment(Y/N), Preferences(Weekend or Weekdays).
LinkedIn:
As a external data sources we gathered the data through the marketing team, and attributes pertaining to it were
Names, Gender, Email, Contact No, Age, Course pursued, Fees, Educational background, Experience in Years.
Naukri:
As a external data sources we gathered the data through the marketing team, and attributes pertaining to it were
Names, Gender, Email, Contact No, state, Fees, Educational background, skills, Experience in Years.
Facebook:
As a external data sources we gathered the data through the marketing team, and attributes pertaining to it were
Names, Gender, Email, Contact No, state, Educational background, Hobbies.
Once the data were extracted from various sources which includes both internal and external data, were
assembled in Excel sheets. After the data was collaborated into different excel sheets, then the data was
further merged into a single spreadsheet called Master data.
10.
11. Detail description of the steps followed for collection of data and collating it
into the master database is as follows:
Initially a template in MS-excel for the master data sheet was prepared and
few important attributes which need to be captured in it and subsequently into
the database were finalized after thorough discussions with the team.
Attributes such as Name, Email, Contact no, Age, Gender, State, Course pursued,
Skills, Pass out year, Pass out Month, Educational background were collected for
500+ students from Internal & External data into Master data sheet.
12. Now before transferring data into the master sheet, the data was cleansed ,
modified in order to make the data uniform.
The attributes whose data were modified are as follows:
LinkedIn: Name, Email, course, Skills, University & Experience.
Naukri: Name, Email, Qualifications, Specializations, Fees, Pass out year, Pass out
month, Skills, State, University, Experience in years.
Facebook: Name, Email, State, University, Hobbies.
Since some sources of data contains only Full name whereas some sources of data
contains both first name and last name but not the complete name, hence we need to
derive the full name from those data where both first name and last name are given
and need to split those data into first and last names where full name is given.
13. Master data must contain the cleaned data, so for the formation we have followed few methods
such as, Data cleansing, Data profiling, Data mining etc., to purify the data completely.
The methods followed for the procurement are as follows:
CONCATENATION
14. CONCATENATION:
Concatenation is the process of merging two or more strings into a single
output.
In the above reference concatenation was used to merge ‘First name’ & ‘Last
name’ to get the “ Full Name”.
In the above reference concatenation was used to merge ‘First name’ & ‘Email
(from test table)’ to get the final resulted Email_Id.
15. VLOOKUP (Vertical Look Up):
It is a function that makes Excel search for a certain value in a column in order to
return a value from a different column in the same row.
In the above references VLOOKUP was used for the skills & course.
As it can be seen VLOOKUP looked up for a value from the test table & by selecting the table
array, column no & the Boolean value False, which has return the exact match for the particular
column.
16. Nested IF:
Nested if is used for testing multiple IF function. In Nested IF we can test up
to 64 condition/ criteria.
17. For the given references Nested IF was used to find the data of a particular column.
Initially a condition was given from a related column using the IF statement and then a
True Value was Mentioned. Another condition was mentioned using another IF
statement similarly with true value & In the Final IF statement both the True & False
value were jotted down to get the Output.
18. IF Condition:
It is a logical operator used for decision making which test the content of the particular
cell and returns a ‘True or False’ value.
For the given reference a condition was mentioned using a IF statement, using a True
and False value to get the final output.
19. After data is retrieved and combined from multiple sources (extracted), cleaned and
formatted (transformed), it is then loaded into a storage system. In this case we used SQL
server Database.
Steps involved in Importing the Data:
20.
21.
22.
23. Procedure for importing data:
Step 1: Expand database > Capstone Project (Database)> Tasks > Import Data.
Step 2: Data Source (Microsoft Excel) > File Path > Excel Version & click on next.
Step 3: Select Master data sheet and we can edit the mappings (optional) & finally click on Next.
Step 4: Finally the data gets loaded into the SQL server and success message is displayed after the data
has been loaded into the destination.
24. Skills wise Student count:
Query :
select Skills, count(skills) as total_skills_count from Masterdata group by
Skills order by total_skills_count desc;
OUTPUT:
25. Age wise Student count:
Query :
OUTPUT:
select Age,count(age) as total_age_count from Masterdata group by
Age order by total_age_count desc;
26. Fees wise Student count:
Query :
OUTPUT:
select Fees,count(fees) as total_fees_count from Masterdata group by
Fees order by total_fees_count desc;
27. Preference wise Student count:
Query :
OUTPUT:
select Preference, count(preference) as total_preference_count from Masterdata
group by Preference order by total_preference_count desc;
28. Installments wise Student count:
Query :
OUTPUT:
select [Installment_Y/N], count([Installment_Y/N]) as total_installment_count
from Masterdata group by [Installment_Y/N] order by total_installment_count
desc;
29. Specializations wise Student count:
Query :
OUTPUT:
select Specializations, count(specializations) as total_specializations_count
from Masterdata group by Specializations order by total_specializations_count
desc;
30. Experience wise Student count:
Query :
OUTPUT:
select Experience_in_years, count(Experience_in_years) as total_experience_count
from Masterdata group by Experience_in_years order by total_experience_count
desc;
31. Course wise Student count:
Query :
OUTPUT:
select Course, count(course) as total_course_count from Masterdata group by
Course order by total_course_count desc;
32. University wise Student count:
Query :
OUTPUT:
select University, count(university) as total_unversity_count from Masterdata
group by University order by total_unversity_count desc;
33. Qualifications wise Student count:
Query :
OUTPUT:
select Qualifications, count(Qualifications) as total_qualifications_count from
Masterdata group by Qualifications order by total_qualifications_count desc;
34. State wise Student count:
Query :
OUTPUT:
select State, count(state) as total_state_count from Masterdata group by
State order by total_state_count desc;
35. Gender wise Student count:
Query :
OUTPUT:
select Gender, count(gender) as total_gender_count from Masterdata group by
Gender order by total_gender_count desc;
36. Hobbies wise Student count:
Query :
OUTPUT:
select Hobbies, count(hobbies) as total_hobbies_count from Masterdata group by
Hobbies order by total_hobbies_count desc;
37. Year wise Student count:
Query :
OUTPUT:
select Passout_year, count(Passout_year) as totat_passout_year_count from
Masterdata group by Passout_year order by totat_passout_year_count desc;
38. Month wise Student count:
Query :
OUTPUT:
select Passout_month, count(Passout_month) as totat_passout_month_count from
Masterdata group by Passout_month order by totat_passout_month_count desc;
39. In SQL database it is easier to extract data as per our requirement.
In any organization there may be a large number of Master data files and as a result
maintaining a database can help.
MS-excel has a limited capacity to store up to 10 Lakh data.
Hence under those circumstances where we need to deal with much larger volumes of
data, importing into SQL is useful.
Now, for visualization of data in order to draw important insights from it regarding
potential business opportunities and target areas so that Data Gyan can take
important decision such as:
Identify those places or areas where it can set up centers.
Modify or increases the courses portfolio.
Identify important areas for investment and come up with appropriate marketing
strategies.
40. • Data visualization is the
graphical representation of
information and data. By using
visual elements like charts, graphs,
and maps, data
visualization tools provide an
accessible way to see and
understand trends, outliers, and
patterns in data
41.
42.
43. Skills wise Student count:
There are 10 different types of
skills viz BI, C, C++, Excel, IT, Java,
R, SQL, Tableau, VBA
We can observe from the text table
that maximum students possess these
3 skills i.e. BI, SQL & IT.
Rest of the students possess the
remaining 7 skills i.e. C, C++, Excel,
Java, R, Tableau, VBA.
44. State wise Course:
There are 5 courses available
in data Gyan i.e. Data
analytics, Business analytics,
Software, Programming &
Database.
From this bar graph we can
observe that programming is the
most preferred course among the
students in Bihar.
We can also observe that data
analytics, & programming are the
least preferred courses among the
students of Rajasthan & Punjab
respectively
45. Installments wise Students:
From this Circle map we can
observe that 32 students
have opted for the
Installment Payment mode
& 531 students have not
opted for this payment
mode, so we conclude that
maximum number of
students have opted One
time payment mode.
46. Qualifications wise Students:
There are 8 different types of
qualifications viz, BA, BBA, BCom,
BSC, BTech, MBA, MCA, MSC.
We can observe from the highlighted
table that maximum students possess
these 4 qualifications i.e. BA, BSC,
Btech & MCA.
Few students possess the qualifications
BCom, MBA & MSC.
Least number of students possess BBA
Qualifications.
47. Year wise Students:
We can observe that the students
passed in 3 academic years viz
2018, 2019 & 2020.
From this Bar graph we can
decode that 57 No of students
passed in the year 2018, 224 No
of students passed in the year
2019, 282 No of students
passed in the year 2020.
48. Month wise Students:
We can observe that the students
passed in 3 months viz July,
August & October.
From this line graph we can
decode that 57 No of students
passed in the Month October,
224 No of students passed in
the month July, 282 No of
students passed in the Month
August.
49. Specializations wise Students:
From the bubble chart we can
observe that there are 8 types of
specializations viz Physics,
Software Development, Solid
Mechanics, History, Accounting,
Chemistry, Finance,
Entrepreneurship.
We can see that maximum students
possess these 4 specializations i.e. ,
Software Development, Solid
Mechanics, History, Chemistry
Few students possess the
specializations in Physics, Accounting
& Finance.
Least number of students pursue
entrepreneurship.
50. Experience wise Students:
From this bar graph we can
observe that Students are
experienced from 0 to 7
years.
Maximum No of students
have 2 years of experience.
Least No of students have 4
years of experience.
51. Gender wise Students:
From this Pie chart we observe
that out of total number of
students:
No of Male – 388
No of Female – 175
52. State wise Students:
From the given map we can
see that students from all
over India are interested to
pursue various courses at
Data Gyan Institute.
We conclude from the given
map that maximum
interested students belong to
Bihar.