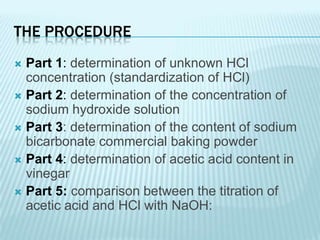
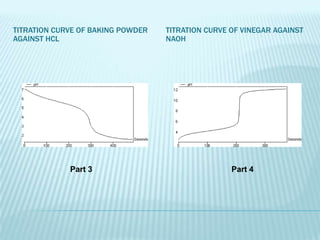
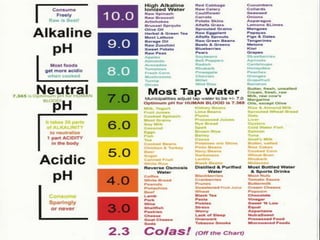
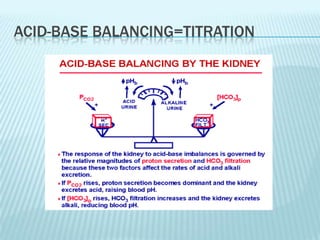
DATA LOGGER :
     ACID-BASE TITRATION


 Khodijah bt Ahamad Ariffin
  (D20101037507)
 Nur Azuaniza bt Hasnan (D20101039445)

 Siti Hafsah bt Hj Mohtar (D20101037434)
ENGAGEMENT
WHAT THE TASTE OF SOAP AND LEMON?
WHAT ABOUT THE PH VALUE?
ACID-BASE TITRATION
EXPERIMENT
EMPOWER
The objectives of this experiment are
  manifold:
1)To construct acid-base titration curves in a very
  similar way to that offered by automatic titrators.
2)To learn some of the principles associated with
  acid-base titration curves by using DrDAQ as an
  educational tool.
3)To use the generated titration curves to
  determine the concentration of some analytes in
  common samples such: as acetic acid in
  vinegar, and sodium bicarbonate in baking
  powder.
Equipment required
   DrDAQ
   Glass combination pH electrode.
   One beaker (125 ml).
   Magnetic stirrer-magnet bar
   Air pump (JUN ACO 9903) (can demonstrate the validity of
    the experiment) for higher accuracy and reliability a peristaltic
    or syringe pump is preferred.
   Tygon Tubing.
    1 l glass bottle with tight lid.
   0.1 mol/l HCl. 0.1 mol/l NaOH.
    0.1 mol/l Na2CO3.
   Vinegar.
   Graduated cylinder, 25 ml.
   5 ml graduated pipette.
   25 ml pipette.
THE PROCEDURE
 Part 1: determination of unknown HCl
  concentration (standardization of HCl)
 Part 2: determination of the concentration of
  sodium hydroxide solution
 Part 3: determination of the content of sodium
  bicarbonate commercial baking powder
 Part 4: determination of acetic acid content in
  vinegar
 Part 5: comparison between the titration of
  acetic acid and HCl with NaOH:
THE SET UP OF EXPERIMENT
TITRATION CURVE OF SODIUM
CARBONATE AGAINST HCL       TITRATION CURVE OF NAOH AGAINST HCL


             Part 1                          Part
                                              2


RESULT FOR THE EXPERIMENT
TITRATION CURVE OF BAKING POWDER   TITRATION CURVE OF VINEGAR AGAINST
AGAINST HCL                        NAOH


             Part 3                                Part 4
TITRATION CURVE OF HCL AGAINST NAOH


                Part 5
ENHANCEMENT
DO YOU LIKE TO EAT?
IS THE PH VALUE FOR EVERY FOODS IS SAME?

To guard against acid loads from food
  consumption and tissue metabolism, we
  have 3 main regulatory systems:
 Buffer systems that work in cellular fluid and
  the bloodstream to keep pH constant
 The respiratory centre (aka the lungs and
  oxygen or carbon-dioxide carrying structures)
 Kidney regulation
ACID-BASE BALANCING=TITRATION
IF PH LEVELS AREN’T BALANCED,
this can mean negative health outcomes that
  include:
 Decreased growth factors
 Growth hormone resistance
 Mild hypothyroidism
 Loss of muscle mass
 Enzymatic changes in cells
 Altered regulation of metabolites and minerals
 Decreased uptake and release of oxygen
Data logging experiment

Data logging experiment

  • 1.
    DATA LOGGER : ACID-BASE TITRATION  Khodijah bt Ahamad Ariffin (D20101037507)  Nur Azuaniza bt Hasnan (D20101039445)  Siti Hafsah bt Hj Mohtar (D20101037434)
  • 2.
    ENGAGEMENT WHAT THE TASTEOF SOAP AND LEMON? WHAT ABOUT THE PH VALUE?
  • 3.
  • 4.
    EMPOWER The objectives ofthis experiment are manifold: 1)To construct acid-base titration curves in a very similar way to that offered by automatic titrators. 2)To learn some of the principles associated with acid-base titration curves by using DrDAQ as an educational tool. 3)To use the generated titration curves to determine the concentration of some analytes in common samples such: as acetic acid in vinegar, and sodium bicarbonate in baking powder.
  • 5.
    Equipment required  DrDAQ  Glass combination pH electrode.  One beaker (125 ml).  Magnetic stirrer-magnet bar  Air pump (JUN ACO 9903) (can demonstrate the validity of the experiment) for higher accuracy and reliability a peristaltic or syringe pump is preferred.  Tygon Tubing.  1 l glass bottle with tight lid.  0.1 mol/l HCl. 0.1 mol/l NaOH.  0.1 mol/l Na2CO3.  Vinegar.  Graduated cylinder, 25 ml.  5 ml graduated pipette.  25 ml pipette.
  • 6.
    THE PROCEDURE  Part1: determination of unknown HCl concentration (standardization of HCl)  Part 2: determination of the concentration of sodium hydroxide solution  Part 3: determination of the content of sodium bicarbonate commercial baking powder  Part 4: determination of acetic acid content in vinegar  Part 5: comparison between the titration of acetic acid and HCl with NaOH:
  • 7.
    THE SET UPOF EXPERIMENT
  • 8.
    TITRATION CURVE OFSODIUM CARBONATE AGAINST HCL TITRATION CURVE OF NAOH AGAINST HCL Part 1 Part 2 RESULT FOR THE EXPERIMENT
  • 9.
    TITRATION CURVE OFBAKING POWDER TITRATION CURVE OF VINEGAR AGAINST AGAINST HCL NAOH Part 3 Part 4
  • 10.
    TITRATION CURVE OFHCL AGAINST NAOH Part 5
  • 11.
  • 12.
    IS THE PHVALUE FOR EVERY FOODS IS SAME? To guard against acid loads from food consumption and tissue metabolism, we have 3 main regulatory systems:  Buffer systems that work in cellular fluid and the bloodstream to keep pH constant  The respiratory centre (aka the lungs and oxygen or carbon-dioxide carrying structures)  Kidney regulation
  • 14.
  • 15.
    IF PH LEVELSAREN’T BALANCED, this can mean negative health outcomes that include:  Decreased growth factors  Growth hormone resistance  Mild hypothyroidism  Loss of muscle mass  Enzymatic changes in cells  Altered regulation of metabolites and minerals  Decreased uptake and release of oxygen