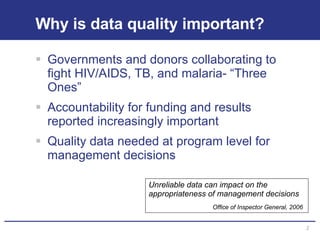
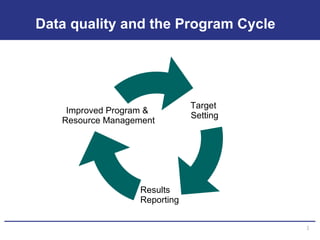
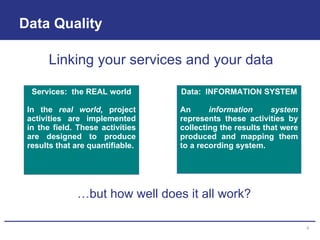
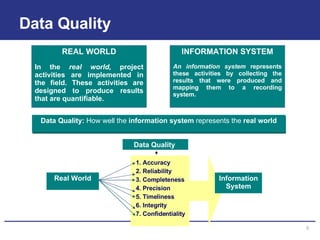
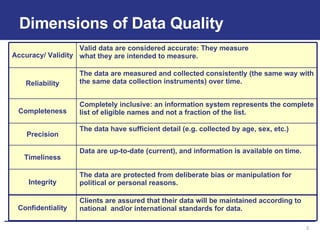
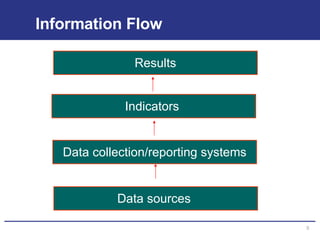
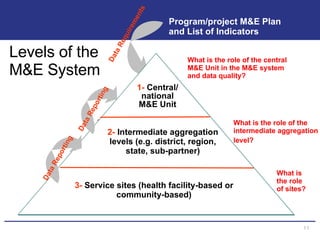
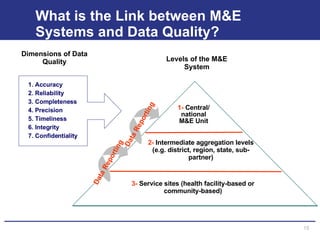
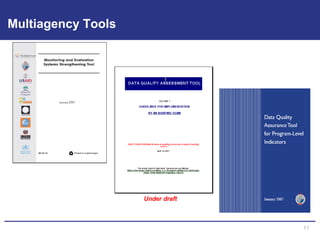
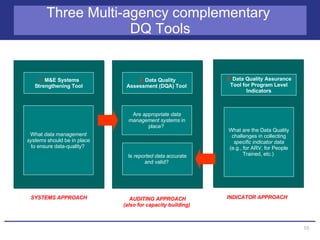
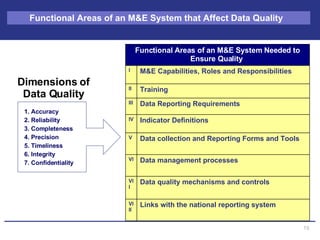
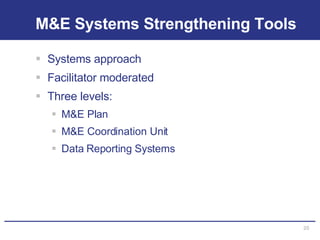
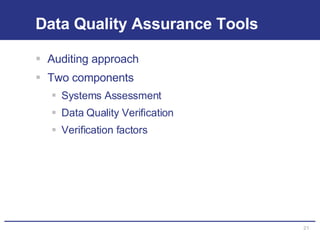
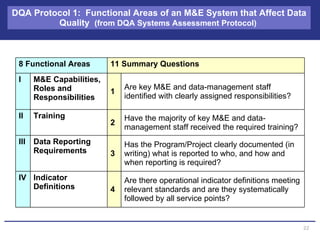
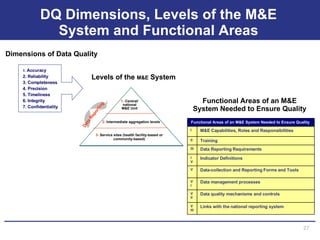
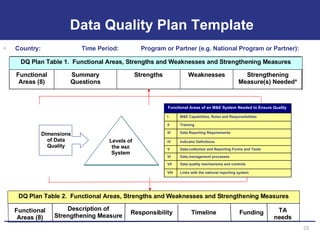
The document discusses the importance of data quality for monitoring and evaluation systems. It describes seven key dimensions of data quality - accuracy, reliability, completeness, precision, timeliness, integrity and confidentiality. It also outlines the different levels of an M&E system from service sites to national reporting and the roles and responsibilities needed at each level to ensure quality data collection, reporting and use. Tools are presented for strengthening M&E systems and assessing data quality.
6 M&E - Monitoring and Evaluation of Aid ProjectsTony
A series of course modules on project cycle, planning and the logical framework, aimed at team leaders of international NGOs in developing countries.
This is part 6 of 11, beginning with 2 modules on leadership and conflict resolution, then 9 modules on project cycle management.
This module has 3 handouts and presenter notes as separate documents.
Sample Proposal: http://www.slideshare.net/Makewa/6-watsan-training-sample-proposal-09
Slides as a handout: http://www.slideshare.net/Makewa/6-me-handout
Presenter notes: http://www.slideshare.net/Makewa/6-module-6-presenter-notes
Assessment of Constraints to Data Use is a rapid assessment tool designed to identify barriers and constraints that inhibit effective practices in data use.
http://www.cpc.unc.edu/measure/publications/ms-11-46-a
A simple presentation about Monitoring and Evaluation prepared by Jubair Ahmad Musazay for interns from Kabul University who are undergoing their internship program in General Directorate of Policy, Monitoring and Evaluation of Afghanistan National Development Strategy (ANDS), in Ministry of Economy of Islamic Republic of Afghanistan.
Uploaded in Slideshare for the purpose of sharing and spreading knowledge.
Led by Tara Nutley
The Data Demand and Use Training Materials increase the skills of M&E officers and health program staff to conduct data analysis, interpretation, presentation and use for health program improvement. Download Data Demand and Use Training Materials: https://www.cpc.unc.edu/measure/tools/data-demand-use/data-demand-and-use-training-resources
Webinar Recording: http://universityofnc.adobeconnect.com/p9rbiydyl2a/
Monitoring is the continuous collection of data and information on specified indicators to assess the implementation of a development intervention in relation to activity schedules and expenditure of allocated funds, and progress and achievements in relation to its intended outcome.
Evaluation is the periodic assessment of the design implementation, outcome, and impact of a development intervention. It should assess the relevance and achievement of the intended outcome, and implementation performance in terms of effectiveness and efficiency, and the nature, distribution, and sustainability of impact.
Healthcare Data Quality & Monitoring PlaybookCitiusTech
The healthcare industry has made significant strides across the care continuum, but incomplete and poor data quality still remains a challenge. In this brief playbook, we share key challenges, important quality checks, and a 4 step approach to enhance data quality.
Quality of data for business operations is considered to be a critical component of enterprise success. With the
exponential rise in ways and means by which data is generated and consumed, organizations are more and more
focusing on ensuring data quality.
Quality of data for business operations is considered to be a critical component of enterprise success. With the exponential rise in ways and means by which data is generated and consumed, organizations are more and more focusing on ensuring data quality. Studies indicate that fewer than 50% of IT decision makers have confidence in their organization’s data quality initiatives, although more than 90% acknowledge the growing importance and volumes of data that they have to grapple with in future.
Conformed Dimensions of Data Quality – An Organized Approach to Data Quality ...DATAVERSITY
Are you looking to measure Data Quality in a more organized way? Look no further, use the Conformed Dimensions of Data Quality to organize your efforts, improve communication with stakeholders and track improvement over time. In this webinar, Information Quality practitioner Dan Myers will present the Conformed Dimensions of Data Quality framework along with the complete results of the 3rd Annual Dimensions of Data Quality survey. This presentation will provide the first view of the 2017 results, and all attendees will receive the associated whitepaper free.
In this webinar you will learn:
Why organizations use the Dimensions of Data Quality
Why there are so many options, and what he recommends you use
3rd Annual Survey data about how frequently organizations use the dimensions and specifically which dimensions are most used
Industry trends in adoption and more resources on the topic
Design and Evaluation of Information Systems and Services: principles of designing information systems, strategies for Information system evaluation, Information Systems Effectiveness Measures.
DETERMINING BUSINESS INTELLIGENCE USAGE SUCCESSijcsit
Business intelligence systems are highly complex systems that senior executives use to process vast
amounts of information when making decisions. Business intelligence systems are rarely used to their full
potential due to a poor understanding of the factors that contribute to system success. Organizations using
business intelligence systems frequently find that it is not easy to evaluate the effectiveness of these
systems, and researchers have noted that there is limited scholarly and practical understanding of how
quality factors affect information use within these systems. This quantitative post positivist research used
the information system (IS) success model to analyze how information quality and system quality influence
information use in business intelligence systems. This study was also designed to investigate the
moderating effects of maturity constructs (i.e., data sources and analytical capabilities) on the
relationships between quality factors and information use.
Business intelligence systems are highly complex systems that senior executives use to process vast
amounts of information when making decisions. Business intelligence systems are rarely used to their full
potential due to a poor understanding of the factors that contribute to system success. Organizations using
business intelligence systems frequently find that it is not easy to evaluate the effectiveness of these
systems, and researchers have noted that there is limited scholarly and practical understanding of how
quality factors affect information use within these systems. This quantitative post positivist research used
the information system (IS) success model to analyze how information quality and system quality influence
information use in business intelligence systems. This study was also designed to investigate the
moderating effects of maturity constructs (i.e., data sources and analytical capabilities) on the
relationships between quality factors and information use
Business intelligence systems are highly complex systems that senior executives use to process vast amounts of information when making decisions. Business intelligence systems are rarely used to their full potential due to a poor understanding of the factors that contribute to system success. Organizations using business intelligence systems frequently find that it is not easy to evaluate the effectiveness of these systems, and researchers have noted that there is limited scholarly and practical understanding of how quality factors affect information use within these systems. This quantitative post positivist research used the information system (IS) success model to analyze how information quality and system quality influence information use in business intelligence systems. This study was also designed to investigate the moderating effects of maturity constructs (i.e., data sources and analytical capabilities) on the relationships between quality factors and information use.
Managing missing values in routinely reported data: One approach from the Dem...MEASURE Evaluation
This Data for Impact webinar was held in December 2020. Access the recording and learn more at https://www.data4impactproject.org/resources/webinars/managing-missing-values-in-routinely-reported-data-one-approach-from-the-democratic-republic-of-the-congo/
This Data for Impact webinar took place October 29, 2020. Learn more at https://www.data4impactproject.org/resources/webinars/use-of-routine-data-for-economic-evaluations/
Data for Impact hosted a one-hour webinar sharing guidance for using routine data in evaluations. More: https://www.data4impactproject.org/resources/webinars/routine-data-use-in-evaluation-practical-guidance/
Lessons learned in using process tracing for evaluationMEASURE Evaluation
Access the recording for this Data for Impact (D4I) webinar at https://www.data4impactproject.org/lessons-learned-in-using-process-tracing-for-evaluation/
Title: Sense of Taste
Presenter: Dr. Faiza, Assistant Professor of Physiology
Qualifications:
MBBS (Best Graduate, AIMC Lahore)
FCPS Physiology
ICMT, CHPE, DHPE (STMU)
MPH (GC University, Faisalabad)
MBA (Virtual University of Pakistan)
Learning Objectives:
Describe the structure and function of taste buds.
Describe the relationship between the taste threshold and taste index of common substances.
Explain the chemical basis and signal transduction of taste perception for each type of primary taste sensation.
Recognize different abnormalities of taste perception and their causes.
Key Topics:
Significance of Taste Sensation:
Differentiation between pleasant and harmful food
Influence on behavior
Selection of food based on metabolic needs
Receptors of Taste:
Taste buds on the tongue
Influence of sense of smell, texture of food, and pain stimulation (e.g., by pepper)
Primary and Secondary Taste Sensations:
Primary taste sensations: Sweet, Sour, Salty, Bitter, Umami
Chemical basis and signal transduction mechanisms for each taste
Taste Threshold and Index:
Taste threshold values for Sweet (sucrose), Salty (NaCl), Sour (HCl), and Bitter (Quinine)
Taste index relationship: Inversely proportional to taste threshold
Taste Blindness:
Inability to taste certain substances, particularly thiourea compounds
Example: Phenylthiocarbamide
Structure and Function of Taste Buds:
Composition: Epithelial cells, Sustentacular/Supporting cells, Taste cells, Basal cells
Features: Taste pores, Taste hairs/microvilli, and Taste nerve fibers
Location of Taste Buds:
Found in papillae of the tongue (Fungiform, Circumvallate, Foliate)
Also present on the palate, tonsillar pillars, epiglottis, and proximal esophagus
Mechanism of Taste Stimulation:
Interaction of taste substances with receptors on microvilli
Signal transduction pathways for Umami, Sweet, Bitter, Sour, and Salty tastes
Taste Sensitivity and Adaptation:
Decrease in sensitivity with age
Rapid adaptation of taste sensation
Role of Saliva in Taste:
Dissolution of tastants to reach receptors
Washing away the stimulus
Taste Preferences and Aversions:
Mechanisms behind taste preference and aversion
Influence of receptors and neural pathways
Impact of Sensory Nerve Damage:
Degeneration of taste buds if the sensory nerve fiber is cut
Abnormalities of Taste Detection:
Conditions: Ageusia, Hypogeusia, Dysgeusia (parageusia)
Causes: Nerve damage, neurological disorders, infections, poor oral hygiene, adverse drug effects, deficiencies, aging, tobacco use, altered neurotransmitter levels
Neurotransmitters and Taste Threshold:
Effects of serotonin (5-HT) and norepinephrine (NE) on taste sensitivity
Supertasters:
25% of the population with heightened sensitivity to taste, especially bitterness
Increased number of fungiform papillae
Knee anatomy and clinical tests 2024.pdfvimalpl1234
This includes all relevant anatomy and clinical tests compiled from standard textbooks, Campbell,netter etc..It is comprehensive and best suited for orthopaedicians and orthopaedic residents.
Ozempic: Preoperative Management of Patients on GLP-1 Receptor Agonists Saeid Safari
Preoperative Management of Patients on GLP-1 Receptor Agonists like Ozempic and Semiglutide
ASA GUIDELINE
NYSORA Guideline
2 Case Reports of Gastric Ultrasound
Title: Sense of Smell
Presenter: Dr. Faiza, Assistant Professor of Physiology
Qualifications:
MBBS (Best Graduate, AIMC Lahore)
FCPS Physiology
ICMT, CHPE, DHPE (STMU)
MPH (GC University, Faisalabad)
MBA (Virtual University of Pakistan)
Learning Objectives:
Describe the primary categories of smells and the concept of odor blindness.
Explain the structure and location of the olfactory membrane and mucosa, including the types and roles of cells involved in olfaction.
Describe the pathway and mechanisms of olfactory signal transmission from the olfactory receptors to the brain.
Illustrate the biochemical cascade triggered by odorant binding to olfactory receptors, including the role of G-proteins and second messengers in generating an action potential.
Identify different types of olfactory disorders such as anosmia, hyposmia, hyperosmia, and dysosmia, including their potential causes.
Key Topics:
Olfactory Genes:
3% of the human genome accounts for olfactory genes.
400 genes for odorant receptors.
Olfactory Membrane:
Located in the superior part of the nasal cavity.
Medially: Folds downward along the superior septum.
Laterally: Folds over the superior turbinate and upper surface of the middle turbinate.
Total surface area: 5-10 square centimeters.
Olfactory Mucosa:
Olfactory Cells: Bipolar nerve cells derived from the CNS (100 million), with 4-25 olfactory cilia per cell.
Sustentacular Cells: Produce mucus and maintain ionic and molecular environment.
Basal Cells: Replace worn-out olfactory cells with an average lifespan of 1-2 months.
Bowman’s Gland: Secretes mucus.
Stimulation of Olfactory Cells:
Odorant dissolves in mucus and attaches to receptors on olfactory cilia.
Involves a cascade effect through G-proteins and second messengers, leading to depolarization and action potential generation in the olfactory nerve.
Quality of a Good Odorant:
Small (3-20 Carbon atoms), volatile, water-soluble, and lipid-soluble.
Facilitated by odorant-binding proteins in mucus.
Membrane Potential and Action Potential:
Resting membrane potential: -55mV.
Action potential frequency in the olfactory nerve increases with odorant strength.
Adaptation Towards the Sense of Smell:
Rapid adaptation within the first second, with further slow adaptation.
Psychological adaptation greater than receptor adaptation, involving feedback inhibition from the central nervous system.
Primary Sensations of Smell:
Camphoraceous, Musky, Floral, Pepperminty, Ethereal, Pungent, Putrid.
Odor Detection Threshold:
Examples: Hydrogen sulfide (0.0005 ppm), Methyl-mercaptan (0.002 ppm).
Some toxic substances are odorless at lethal concentrations.
Characteristics of Smell:
Odor blindness for single substances due to lack of appropriate receptor protein.
Behavioral and emotional influences of smell.
Transmission of Olfactory Signals:
From olfactory cells to glomeruli in the olfactory bulb, involving lateral inhibition.
Primitive, less old, and new olfactory systems with different path
- Video recording of this lecture in English language: https://youtu.be/lK81BzxMqdo
- Video recording of this lecture in Arabic language: https://youtu.be/Ve4P0COk9OI
- Link to download the book free: https://nephrotube.blogspot.com/p/nephrotube-nephrology-books.html
- Link to NephroTube website: www.NephroTube.com
- Link to NephroTube social media accounts: https://nephrotube.blogspot.com/p/join-nephrotube-on-social-media.html
NVBDCP.pptx Nation vector borne disease control programSapna Thakur
NVBDCP was launched in 2003-2004 . Vector-Borne Disease: Disease that results from an infection transmitted to humans and other animals by blood-feeding arthropods, such as mosquitoes, ticks, and fleas. Examples of vector-borne diseases include Dengue fever, West Nile Virus, Lyme disease, and malaria.
These lecture slides, by Dr Sidra Arshad, offer a quick overview of physiological basis of a normal electrocardiogram.
Learning objectives:
1. Define an electrocardiogram (ECG) and electrocardiography
2. Describe how dipoles generated by the heart produce the waveforms of the ECG
3. Describe the components of a normal electrocardiogram of a typical bipolar leads (limb II)
4. Differentiate between intervals and segments
5. Enlist some common indications for obtaining an ECG
Study Resources:
1. Chapter 11, Guyton and Hall Textbook of Medical Physiology, 14th edition
2. Chapter 9, Human Physiology - From Cells to Systems, Lauralee Sherwood, 9th edition
3. Chapter 29, Ganong’s Review of Medical Physiology, 26th edition
4. Electrocardiogram, StatPearls - https://www.ncbi.nlm.nih.gov/books/NBK549803/
5. ECG in Medical Practice by ABM Abdullah, 4th edition
6. ECG Basics, http://www.nataliescasebook.com/tag/e-c-g-basics
HOT NEW PRODUCT! BIG SALES FAST SHIPPING NOW FROM CHINA!! EU KU DB BK substit...GL Anaacs
Contact us if you are interested:
Email / Skype : kefaya1771@gmail.com
Threema: PXHY5PDH
New BATCH Ku !!! MUCH IN DEMAND FAST SALE EVERY BATCH HAPPY GOOD EFFECT BIG BATCH !
Contact me on Threema or skype to start big business!!
Hot-sale products:
NEW HOT EUTYLONE WHITE CRYSTAL!!
5cl-adba precursor (semi finished )
5cl-adba raw materials
ADBB precursor (semi finished )
ADBB raw materials
APVP powder
5fadb/4f-adb
Jwh018 / Jwh210
Eutylone crystal
Protonitazene (hydrochloride) CAS: 119276-01-6
Flubrotizolam CAS: 57801-95-3
Metonitazene CAS: 14680-51-4
Payment terms: Western Union,MoneyGram,Bitcoin or USDT.
Deliver Time: Usually 7-15days
Shipping method: FedEx, TNT, DHL,UPS etc.Our deliveries are 100% safe, fast, reliable and discreet.
Samples will be sent for your evaluation!If you are interested in, please contact me, let's talk details.
We specializes in exporting high quality Research chemical, medical intermediate, Pharmaceutical chemicals and so on. Products are exported to USA, Canada, France, Korea, Japan,Russia, Southeast Asia and other countries.
micro teaching on communication m.sc nursing.pdfAnurag Sharma
Microteaching is a unique model of practice teaching. It is a viable instrument for the. desired change in the teaching behavior or the behavior potential which, in specified types of real. classroom situations, tends to facilitate the achievement of specified types of objectives.
Report Back from SGO 2024: What’s the Latest in Cervical Cancer?bkling
Are you curious about what’s new in cervical cancer research or unsure what the findings mean? Join Dr. Emily Ko, a gynecologic oncologist at Penn Medicine, to learn about the latest updates from the Society of Gynecologic Oncology (SGO) 2024 Annual Meeting on Women’s Cancer. Dr. Ko will discuss what the research presented at the conference means for you and answer your questions about the new developments.
These simplified slides by Dr. Sidra Arshad present an overview of the non-respiratory functions of the respiratory tract.
Learning objectives:
1. Enlist the non-respiratory functions of the respiratory tract
2. Briefly explain how these functions are carried out
3. Discuss the significance of dead space
4. Differentiate between minute ventilation and alveolar ventilation
5. Describe the cough and sneeze reflexes
Study Resources:
1. Chapter 39, Guyton and Hall Textbook of Medical Physiology, 14th edition
2. Chapter 34, Ganong’s Review of Medical Physiology, 26th edition
3. Chapter 17, Human Physiology by Lauralee Sherwood, 9th edition
4. Non-respiratory functions of the lungs https://academic.oup.com/bjaed/article/13/3/98/278874
Flu Vaccine Alert in Bangalore Karnatakaaddon Scans
As flu season approaches, health officials in Bangalore, Karnataka, are urging residents to get their flu vaccinations. The seasonal flu, while common, can lead to severe health complications, particularly for vulnerable populations such as young children, the elderly, and those with underlying health conditions.
Dr. Vidisha Kumari, a leading epidemiologist in Bangalore, emphasizes the importance of getting vaccinated. "The flu vaccine is our best defense against the influenza virus. It not only protects individuals but also helps prevent the spread of the virus in our communities," he says.
This year, the flu season is expected to coincide with a potential increase in other respiratory illnesses. The Karnataka Health Department has launched an awareness campaign highlighting the significance of flu vaccinations. They have set up multiple vaccination centers across Bangalore, making it convenient for residents to receive their shots.
To encourage widespread vaccination, the government is also collaborating with local schools, workplaces, and community centers to facilitate vaccination drives. Special attention is being given to ensuring that the vaccine is accessible to all, including marginalized communities who may have limited access to healthcare.
Residents are reminded that the flu vaccine is safe and effective. Common side effects are mild and may include soreness at the injection site, mild fever, or muscle aches. These side effects are generally short-lived and far less severe than the flu itself.
Healthcare providers are also stressing the importance of continuing COVID-19 precautions. Wearing masks, practicing good hand hygiene, and maintaining social distancing are still crucial, especially in crowded places.
Protect yourself and your loved ones by getting vaccinated. Together, we can help keep Bangalore healthy and safe this flu season. For more information on vaccination centers and schedules, residents can visit the Karnataka Health Department’s official website or follow their social media pages.
Stay informed, stay safe, and get your flu shot today!
263778731218 Abortion Clinic /Pills In Harare ,sisternakatoto
263778731218 Abortion Clinic /Pills In Harare ,ABORTION WOMEN’S CLINIC +27730423979 IN women clinic we believe that every woman should be able to make choices in her pregnancy. Our job is to provide compassionate care, safety,affordable and confidential services. That’s why we have won the trust from all generations of women all over the world. we use non surgical method(Abortion pills) to terminate…Dr.LISA +27730423979women Clinic is committed to providing the highest quality of obstetrical and gynecological care to women of all ages. Our dedicated staff aim to treat each patient and her health concerns with compassion and respect.Our dedicated group ABORTION WOMEN’S CLINIC +27730423979 IN women clinic we believe that every woman should be able to make choices in her pregnancy. Our job is to provide compassionate care, safety,affordable and confidential services. That’s why we have won the trust from all generations of women all over the world. we use non surgical method(Abortion pills) to terminate…Dr.LISA +27730423979women Clinic is committed to providing the highest quality of obstetrical and gynecological care to women of all ages. Our dedicated staff aim to treat each patient and her health concerns with compassion and respect.Our dedicated group of receptionists, nurses, and physicians have worked together as a teamof receptionists, nurses, and physicians have worked together as a team wwww.lisywomensclinic.co.za/
1. Assessing M&E Systems for Data Quality USAID Mini University George Washington University Washington, DC, October 5th, 2007
2.
3. Data quality and the Program Cycle Data Quality Results Reporting Target Setting Improved Program & Resource Management
4. Data Quality Services: the REAL world In the real world, project activities are implemented in the field. These activities are designed to produce results that are quantifiable. Data: INFORMATION SYSTEM An information system represents these activities by collecting the results that were produced and mapping them to a recording system. Linking your services and your data … but how well does it all work?
5. Aggregated Data from PEPFAR Countries Source: 3 rd Annual PEPFAR report Where did these OVC numbers come from? Do you think they are good numbers? Why or why not? Make a flow chart of the data from sites to PEPFAR
6. Data Quality REAL WORLD In the real world, project activities are implemented in the field. These activities are designed to produce results that are quantifiable. INFORMATION SYSTEM An information system represents these activities by collecting the results that were produced and mapping them to a recording system. Data Quality: How well the information system represents the real world Data Quality Real World Information System 1. Accuracy 2. Reliability 3. Completeness 4. Precision 5. Timeliness 6. Integrity 7. Confidentiality
7.
8. Dimensions of Data Quality The data are protected from deliberate bias or manipulation for political or personal reasons. Integrity Clients are assured that their data will be maintained according to national and/or international standards for data. Confidentiality Data are up-to-date (current), and information is available on time. Timeliness The data have sufficient detail (e.g. collected by age, sex, etc.) Precision Completely inclusive: an information system represents the complete list of eligible names and not a fraction of the list. Completeness The data are measured and collected consistently (the same way with the same data collection instruments) over time. Reliability Valid data are considered accurate: They measure what they are intended to measure. Accuracy/ Validity
11. Program/project M&E Plan and List of Indicators What is the role of the central M&E Unit in the M&E system and data quality? What is the role of the intermediate aggregation level? What is the role of sites? Levels of the M&E System Data Requirements 1- Central/ national M&E Unit 2- Intermediate aggregation levels (e.g. district, region, state, sub-partner) 3- Service sites (health facility-based or community-based) Data Reporting Data Reporting
12.
13.
14.
15. What is the Link between M&E Systems and Data Quality? 1. Accuracy 2. Reliability 3. Completeness 4. Precision 5. Timeliness 6. Integrity 7. Confidentiality Dimensions of Data Quality 1- Central/ national M&E Unit 2- Intermediate aggregation levels (e.g. district, region, state, sub-partner) 3- Service sites (health facility-based or community-based) Data Reporting Data Reporting Levels of the M&E System
18. SYSTEMS APPROACH INDICATOR APPROACH AUDITING APPROACH (also for capacity building) Three Multi-agency complementary DQ Tools 1- M&E Systems Strengthening Tool What data management systems should be in place to ensure data-quality? 3- Data Quality Assurance Tool for Program Level Indicators What are the Data Quality challenges in collecting specific indicator data (e.g., for ARV, for People Trained, etc.) 2- Data Quality Assessment (DQA) Tool Are appropriate data management systems in place? Is reported data accurate and valid?
19. 1. Accuracy 2. Reliability 3. Completeness 4. Precision 5. Timeliness 6. Integrity 7. Confidentiality Functional Areas of an M&E System that Affect Data Quality Dimensions of Data Quality Data quality mechanisms and controls VII Data management processes VI Data collection and Reporting Forms and Tools V Links with the national reporting system VIII Indicator Definitions IV Data Reporting Requirements III Training II M&E Capabilities, Roles and Responsibilities I Functional Areas of an M&E System Needed to Ensure Quality
20.
21.
22. DQA Protocol 1: Functional Areas of an M&E System that Affect Data Quality (from DQA Systems Assessment Protocol) Are there operational indicator definitions meeting relevant standards and are they systematically followed by all service points? 4 Indicator Definitions IV Has the Program/Project clearly documented (in writing) what is reported to who, and how and when reporting is required? 3 Data Reporting Requirements III Have the majority of key M&E and data-management staff received the required training? 2 Training II Are key M&E and data-management staff identified with clearly assigned responsibilities? 1 M&E Capabilities, Roles and Responsibilities I 11 Summary Questions 8 Functional Areas
23. DQA Protocol 1: Functional Areas of an M&E System that Affect Data Quality (from DQA Systems Assessment Protocol) Does the data collection and reporting system of the Program/Project link to the National Reporting System? 11 Links with National Reporting System VIII Are there clearly defined and followed procedures to periodically verify source data? 10 Are there clearly defined and followed procedures to identify and reconcile discrepancies in reports? 9 Are data quality challenges identified and are mechanisms in place for addressing them? 8 Data Quality Mechanisms and Controls VII Does clear documentation of collection, aggregation and manipulation steps exist? 7 Data Management Processes VI Are source documents kept and made available in accordance with a written policy? 6 Are there standard data-collection and reporting forms that are systematically used? 5 Data-collection and Reporting Forms and Tools V
24. Summary Question 1: Are key M&E and data-management staff identified with clearly assigned responsibilities? The responsibility for recording the delivery of services on source documents is clearly assigned to the relevant staff (i.e., it is in their job description). 6 There are designated staff responsible for the review of aggregated numbers prior to submission to the next level (e.g. to the central M&E Unit). 5 There are designated staff responsible for reviewing the quality of data submitted by sub-reporting levels (e.g. regions, districts, service points). 4 The Program Manager(s) review(s) the aggregated numbers prior to the submission/release of reports from the M&E Unit. 3 There are staff dedicated to M&E and data management systems. 2 There is a documented organizational structure/chart that clearly identifies positions that have data management responsibilities. 1 I - M&E Capacities, Roles and Responsibilities Service Points Aggre-gation Levels M&E Unit Reporting System Level Component of the M&E System LIST OF ALL QUESTIONS List of Questions Related to the Data Management and Reporting System
25. DQA: Summary of M&E System Functional Areas Interpreting the findings: The larger the score, the stronger the component
26. Data verification: DQA Protocol 2 Perform “spot checks” to verify the actual delivery of services or commodities to the target populations. 5. Spot checks Perform “cross-checks” of the verified report totals with other data-sources (eg. inventory records, laboratory reports, etc.). 4. Cross-checks Trace and verify reported numbers: (1) Recount the reported numbers from available source documents; (2) Compare the verified numbers to the site reported number; (3) Identify reasons for any differences. 3. Trace and Verification Review availability and completeness of all indicator source documents for the selected reporting period. 2. Documentation Review Describe the connection between the delivery of services/commodities and the completion of the source document that records that service delivery. 1. Description Description Verification SERVICE DELIVERY POINT - 5 TYPES OF DATA VERIFICATIONS
27. DQ Dimensions, Levels of the M&E System and Functional Areas Dimensions of Data Quality Levels of the M&E System Functional Areas of an M&E System Needed to Ensure Quality Data quality mechanisms and controls VII Data management processes VI Data-collection and Reporting Forms and Tools V Links with the national reporting system VIII Indicator Definitions IV Data Reporting Requirements III Training II M&E Capabilities, Roles and Responsibilities I Functional Areas of an M&E System Needed to Ensure Quality 1. Accuracy 2. Reliability 3. Completeness 4. Precision 5. Timeliness 6. Integrity 7. Confidentiality Data Reporting 1- Central/ national M&E Unit 2- Intermediate aggregation levels 3- Service sites (health facility-based or community-based)
28.
29.
30. MEASURE Evaluation is funded by the U.S. Agency for International Development (USAID) through Cooperative Agreement GPO-A-00-03-00003-00 and is implemented by the Carolina Population Center at the University of North Carolina in partnership with Constella Futures, John Snow, Inc., ORC Macro, and Tulane University. Visit us online at http://www.cpc.unc.edu/measure.