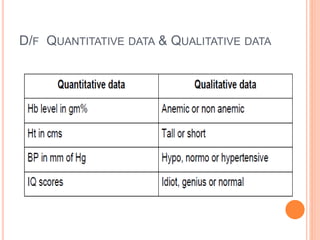
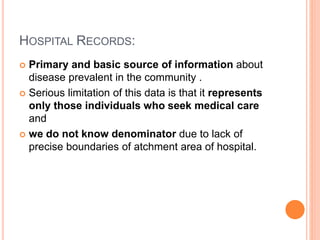
DATA (COMMUNITY MEDICINE)
By
Dr. Mayur Sayta
Resident doctor
Community Medicine
BJMC
DATA
DEFINITION
 facts and statistics collected together for reference or
analysis.
 A set of values recorded on one or more observational
units
TYPES OF DATA:
 Qualitative/ Quantitative data
 Discrete/ Continuous data
 Primary/ Secondary data
 Nominal/ Ordinal data
QUALITATIVE DATA
 Also called as enumeration data .
 It Represents a particular quality or attribute.
 They can't be measured.
 Expressed as numbers without unit of measurements .
Eg: religion, Sex, Blood group etc.
QUANTITATIVE DATA
 Also called as measurement data.
 These data have a magnitude.
 Can be expressed as number with or without unit of
measurement.
 Eg: Height in cm, Hb in gm%, BP in mm of Hg, Weight in
kg.
D/F QUANTITATIVE DATA & QUALITATIVE DATA
DISCRETE / CONTINUOUS DATA:
 Discrete data - Here we always get a whole number.
Eg. Number of beds in hospital, Malaria cases
 Continuous data :
it can take any value possible to measure or possibility of
getting fractions.
Eg. Hb level, Ht, Wt.
PRIMARY/ SECONDARY DATA:
 Primary data - Obtained directly from an individual , it
gives precise information
 Secondary data - Obtained from outside source ,Eg Data
obtained from hospital records, Census.
NOMINAL/ ORDINAL DATA:
Nominal data
 the information or data fits into one of the categories,
but the categories cannot be ordered one above
another . E.g. Colour of eyes, Race, Sex.
Ordinal data:
 here the categories can be ordered
 but the space or class interval between two categories
may not be the same. E.g.. Ranking in the class or exam
COLLECTION OF DATA
 Collect data carefully and thoroughly.
 Units of measurements should be clearly defined.
 Record should be correct , complete, clear, sufficiently
concise and arranged in a manner that is easy to
comprehend.
COLLECTED DATA SHOULD BE
 Accurate (i.e. Measures true value of what is under
study)
 Valid( i.e. Measures only what is supposed to measure)
 Precise(i.e. Gives adequate details of the measurement)
 Reliable(i.e. Should be dependable)
SOURCES FOR COLLECTION OF DATA
 Census: The First regular census in India was taken in
1881, taken every 10 years.
 Defined as “The total process of collecting, compiling
and publishing, demographic, economic and social
data pertaining at a specific time or times, to all
persons in a country or delimited territory.”.
15TH INDIAN CENSUS
 The was conducted in two phases,
1st phase - house listing and population enumeration.
 House listing phase began on 1 April 2010 and involved
collection of information about all buildings.
 Information for National Population Register(NPR)was
also collected in the first phase, which will be used to
issue a 12-digit unique identification number to all
registered Indian residents by Unique Identification
Authority of India (UIDAI).
2nd phase The second population enumeration phase was
conducted between 9 and 28 February 2011.
 provisional reports released on 31 March 2011,
 C M Chandramauli was the Registrar General and Census
Commissioner of India for the 2011
 Indian Census. Census data was collected in 16 languages and
 The training manual was prepared in 18 languages.
CENSUS ADMINISTRATION
 The motto of the census was 'Our Census, Our future'.
 Spread across 29 states and 7 union territories,
 the census covered 640 districts, 5,924 sub-districts, 7,935
towns and more than 600,000 villages.
 A total of 2.7 million officials visited households in 7,935
towns and 600,000 villages, classifying the population
according to gender, religion, education and occupation.
 The cost of the exercise was approximately ₹2,200 crore
 This comes to less than $0.50 per person, well below the
estimated world average of $4.60 per person.
 Conducted every 10 years
 Information on castes was included in the census following
demands from several ruling coalition leaders including Lalu
Prasad Yadav, Sharad Yadav and Mulayam Singh Yadav
supported by opposition parties Bharatiya Janata Party, Akali
Dal, Shiv Sena and Anna Dravida Munnetra Kazhagam.
 Information on caste was last collected during the British Raj in
1931.
 During the early census, people often exaggerated their caste
status to garner social status and it is expected that people
downgrade it now in the expectation of gaining government
benefits.
REGISTRATION OF VITAL EVENTS
Civil registration System.
 In 1873,GOI passed the Births, Deaths and Marriages
Registration Act, but the Act provided only for voluntary
registration.
 However the registration system in India tended to be
very unreliable, the data being grossly deficient in
regard to accuracy, timeliness, completeness and
coverage.
 The Central Births and Deaths Registration Act, was passed by
Govt Of India in 1969, but it came into force on 1st April 1970.
 The acts provides the compulsory registration of births and
deaths throughout the country, and compilation of vital
statistics in the states to so as to ensure uniformity and
comparability of data.
 Time limit: For events of births-21 days, and for events
 of deaths-21 days.
 In case of default fine up to Rs 50 can be imposed.
SAMPLE REGISTRATION SYSTEM(SRS):
 Sample Registration System(SRS): Dual record
system,
 consisting of continuous enumeration of births and
deaths by an enumerator and independent survey
every 6 months by an investigator-supervisor.
NOTIFICATION OF DISEASES:
 Valuable source of morbidity
 Data such as incidence, prevalence and distribution of
certain specified diseases which are notifiable.
 Internationally notifiable diseases: Cholera, Plague and
Yellow fever.
 A few others- Louse-borne typhus, Relapsing fever,
Polio, Influenza, Malaria, Rabies and Salmonellosis are
subject to international surveillance.
HOSPITAL RECORDS:
 Primary and basic source of information about
disease prevalent in the community .
 Serious limitation of this data is that it represents
only those individuals who seek medical care
and
 we do not know denominator due to lack of
precise boundaries of atchment area of hospital.
EPIDEMIOLOGICAL SURVEILLANCE
 Special surveillance
 Activities are conducted for diseases like Malaria,
Leprosy, TB, Filariasis, AIDS etc.
SURVEYS
 Population surveys supplement routinely collected
statistics .
 Methods used in data collection in surveys include
health interview, health examination, study of health
records, mailed questionnaire survey.
RESEARCH FINDINGS:
 Findings of various research or
 investigations are helpful for planning and
 implementation of health activities in general
PRESENTATION OF DATA
Principles of presentation of data:
 Data should be arranged in such a way that it will
arouse interest in reader.
 The data should be made sufficiently concise without
losing important details.
 The data should presented in simple form to enable the
reader to form quick impressions and to draw some
conclusion, directly or indirectly.
 Should facilitate further statistical analysis .
 It should define the problem and suggest its solution
THE TWO BASIC WAYS FOR DATA PRESENTATION ARE
 Tabulation
 Charts and diagram
TABULATION
 Can be Simple or Complex depending upon the number
of measurements of single set or multiple sets of items.
 Simple table :
 Frequency distribution table with qualitative data:
 Title: Cases of malaria in adults and children
FREQUENCY DISTRIBUTION TABLE WITH
QUANTITATIVE DATA:
 Fasting blood glucose level in diabetics at the time of
diagnosis
CHART AND DIAGRAM
 Graphic presentations used to illustrate and clarify
information.
 Tables are essential in presentation of scientific
data and diagrams are complementary to
summarize these tables in an easy, attractive and
simple way.
VARIOUS CHARTS AND DIAGRAMS
 Bar Diagram
 Histogram
 Frequency polygon
 Cumulative frequency curve
 Scatter diagram
 Line diagram
 Pie diagram
BAR DIAGRAM
3 types of bar diagram:
 Simple
 Multiple or compound
 Component or proportional
SIMPLE BAR DIAGRAM
 Malaria cases
MULTIPLE OR COMPOUND DIAGRAM
 Malaria cases in male and female
COMPONENT OR PROPORTIONAL BAR DIAGRAM
 Proportion of energy intake between Poor and Rich and
poor

Data by dr.mayur

  • 1.
    DATA (COMMUNITY MEDICINE) By Dr.Mayur Sayta Resident doctor Community Medicine BJMC
  • 2.
    DATA DEFINITION  facts andstatistics collected together for reference or analysis.  A set of values recorded on one or more observational units
  • 3.
    TYPES OF DATA: Qualitative/ Quantitative data  Discrete/ Continuous data  Primary/ Secondary data  Nominal/ Ordinal data
  • 4.
    QUALITATIVE DATA  Alsocalled as enumeration data .  It Represents a particular quality or attribute.  They can't be measured.  Expressed as numbers without unit of measurements . Eg: religion, Sex, Blood group etc.
  • 5.
    QUANTITATIVE DATA  Alsocalled as measurement data.  These data have a magnitude.  Can be expressed as number with or without unit of measurement.  Eg: Height in cm, Hb in gm%, BP in mm of Hg, Weight in kg.
  • 6.
    D/F QUANTITATIVE DATA& QUALITATIVE DATA
  • 7.
    DISCRETE / CONTINUOUSDATA:  Discrete data - Here we always get a whole number. Eg. Number of beds in hospital, Malaria cases  Continuous data : it can take any value possible to measure or possibility of getting fractions. Eg. Hb level, Ht, Wt.
  • 8.
    PRIMARY/ SECONDARY DATA: Primary data - Obtained directly from an individual , it gives precise information  Secondary data - Obtained from outside source ,Eg Data obtained from hospital records, Census.
  • 9.
    NOMINAL/ ORDINAL DATA: Nominaldata  the information or data fits into one of the categories, but the categories cannot be ordered one above another . E.g. Colour of eyes, Race, Sex. Ordinal data:  here the categories can be ordered  but the space or class interval between two categories may not be the same. E.g.. Ranking in the class or exam
  • 10.
    COLLECTION OF DATA Collect data carefully and thoroughly.  Units of measurements should be clearly defined.  Record should be correct , complete, clear, sufficiently concise and arranged in a manner that is easy to comprehend.
  • 11.
    COLLECTED DATA SHOULDBE  Accurate (i.e. Measures true value of what is under study)  Valid( i.e. Measures only what is supposed to measure)  Precise(i.e. Gives adequate details of the measurement)  Reliable(i.e. Should be dependable)
  • 12.
    SOURCES FOR COLLECTIONOF DATA  Census: The First regular census in India was taken in 1881, taken every 10 years.  Defined as “The total process of collecting, compiling and publishing, demographic, economic and social data pertaining at a specific time or times, to all persons in a country or delimited territory.”.
  • 13.
    15TH INDIAN CENSUS The was conducted in two phases, 1st phase - house listing and population enumeration.  House listing phase began on 1 April 2010 and involved collection of information about all buildings.  Information for National Population Register(NPR)was also collected in the first phase, which will be used to issue a 12-digit unique identification number to all registered Indian residents by Unique Identification Authority of India (UIDAI). 2nd phase The second population enumeration phase was conducted between 9 and 28 February 2011.  provisional reports released on 31 March 2011,
  • 14.
     C MChandramauli was the Registrar General and Census Commissioner of India for the 2011  Indian Census. Census data was collected in 16 languages and  The training manual was prepared in 18 languages.
  • 15.
  • 16.
     The mottoof the census was 'Our Census, Our future'.  Spread across 29 states and 7 union territories,  the census covered 640 districts, 5,924 sub-districts, 7,935 towns and more than 600,000 villages.  A total of 2.7 million officials visited households in 7,935 towns and 600,000 villages, classifying the population according to gender, religion, education and occupation.  The cost of the exercise was approximately ₹2,200 crore  This comes to less than $0.50 per person, well below the estimated world average of $4.60 per person.  Conducted every 10 years
  • 17.
     Information oncastes was included in the census following demands from several ruling coalition leaders including Lalu Prasad Yadav, Sharad Yadav and Mulayam Singh Yadav supported by opposition parties Bharatiya Janata Party, Akali Dal, Shiv Sena and Anna Dravida Munnetra Kazhagam.  Information on caste was last collected during the British Raj in 1931.  During the early census, people often exaggerated their caste status to garner social status and it is expected that people downgrade it now in the expectation of gaining government benefits.
  • 18.
    REGISTRATION OF VITALEVENTS Civil registration System.  In 1873,GOI passed the Births, Deaths and Marriages Registration Act, but the Act provided only for voluntary registration.  However the registration system in India tended to be very unreliable, the data being grossly deficient in regard to accuracy, timeliness, completeness and coverage.
  • 19.
     The CentralBirths and Deaths Registration Act, was passed by Govt Of India in 1969, but it came into force on 1st April 1970.  The acts provides the compulsory registration of births and deaths throughout the country, and compilation of vital statistics in the states to so as to ensure uniformity and comparability of data.  Time limit: For events of births-21 days, and for events  of deaths-21 days.  In case of default fine up to Rs 50 can be imposed.
  • 20.
    SAMPLE REGISTRATION SYSTEM(SRS): Sample Registration System(SRS): Dual record system,  consisting of continuous enumeration of births and deaths by an enumerator and independent survey every 6 months by an investigator-supervisor.
  • 21.
    NOTIFICATION OF DISEASES: Valuable source of morbidity  Data such as incidence, prevalence and distribution of certain specified diseases which are notifiable.  Internationally notifiable diseases: Cholera, Plague and Yellow fever.  A few others- Louse-borne typhus, Relapsing fever, Polio, Influenza, Malaria, Rabies and Salmonellosis are subject to international surveillance.
  • 22.
    HOSPITAL RECORDS:  Primaryand basic source of information about disease prevalent in the community .  Serious limitation of this data is that it represents only those individuals who seek medical care and  we do not know denominator due to lack of precise boundaries of atchment area of hospital.
  • 23.
    EPIDEMIOLOGICAL SURVEILLANCE  Specialsurveillance  Activities are conducted for diseases like Malaria, Leprosy, TB, Filariasis, AIDS etc.
  • 24.
    SURVEYS  Population surveyssupplement routinely collected statistics .  Methods used in data collection in surveys include health interview, health examination, study of health records, mailed questionnaire survey.
  • 25.
    RESEARCH FINDINGS:  Findingsof various research or  investigations are helpful for planning and  implementation of health activities in general
  • 26.
    PRESENTATION OF DATA Principlesof presentation of data:  Data should be arranged in such a way that it will arouse interest in reader.  The data should be made sufficiently concise without losing important details.  The data should presented in simple form to enable the reader to form quick impressions and to draw some conclusion, directly or indirectly.  Should facilitate further statistical analysis .  It should define the problem and suggest its solution
  • 27.
    THE TWO BASICWAYS FOR DATA PRESENTATION ARE  Tabulation  Charts and diagram
  • 28.
    TABULATION  Can beSimple or Complex depending upon the number of measurements of single set or multiple sets of items.  Simple table :
  • 29.
     Frequency distributiontable with qualitative data:  Title: Cases of malaria in adults and children
  • 30.
    FREQUENCY DISTRIBUTION TABLEWITH QUANTITATIVE DATA:  Fasting blood glucose level in diabetics at the time of diagnosis
  • 31.
    CHART AND DIAGRAM Graphic presentations used to illustrate and clarify information.  Tables are essential in presentation of scientific data and diagrams are complementary to summarize these tables in an easy, attractive and simple way.
  • 32.
    VARIOUS CHARTS ANDDIAGRAMS  Bar Diagram  Histogram  Frequency polygon  Cumulative frequency curve  Scatter diagram  Line diagram  Pie diagram
  • 33.
    BAR DIAGRAM 3 typesof bar diagram:  Simple  Multiple or compound  Component or proportional
  • 34.
  • 35.
    MULTIPLE OR COMPOUNDDIAGRAM  Malaria cases in male and female
  • 36.
    COMPONENT OR PROPORTIONALBAR DIAGRAM  Proportion of energy intake between Poor and Rich and poor