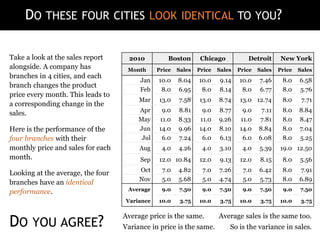
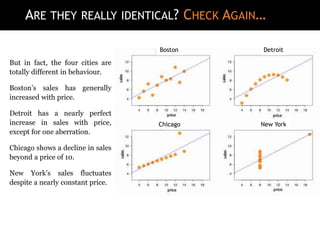
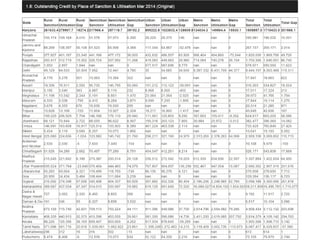
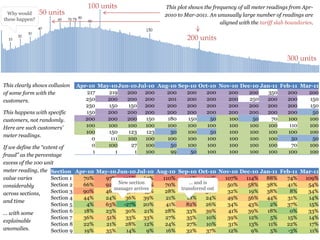
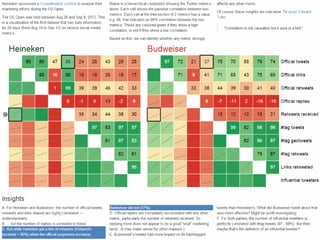
This document discusses how data analytics can be used in decision making. It provides an example of how analyzing sales data from four city branches of a company over time revealed non-obvious patterns rather than identical performance as the averages suggested. Deeper analysis showed each city actually behaved quite differently in how sales responded to price changes. This highlights how averages can obscure important variations and that analytics is needed to detect such variations to inform better decision making.
There are 100,000 applicants for loans. Who is likely to default? How to effectively offer a loan
There are 100,000 consumers who is likely to buy my product? How to effectively market my product?
There are more than 1,000,000,000 transactions in a day. How to identify the fraud transaction?
There are 1,000,000 claims every year. How to identify the fake claims
Slides used for a presentation to introduce the field of business analytics. Covers what BA is, how it is a part of business intelligence, and what areas make up BA.
Customer churn has become a big issue in many banks because it costs a lot more to acquire a new customer than retaining existing ones. With the use of a customer churn prediction model possible churners in a bank can be identified, and as a result the bank can take some action to prevent them from leaving. In order to set up such a model in a bank in Iceland few things have to be considered. How a churner in a bank is defined, and which variables and methods to use. We propose that a churner for that Icelandic bank should be defined as a customer who has not been active for the last three months based on the bank definition of an active customer. Behavioral and demographic variables should be used as an input for the model, and either decision tree or logistic regression used as a technique.
It has been said that Mobiles +Cloud + Social + Big Data = Better Run The World. IBM has invested over $20 billion since 2005 to grow its analytics business, many companies will invest more than $120 billion by 2015 on analytics, hardware, software and services critical in almost every industry like ; Healthcare, media, sports, finance, government, etc.
It has been estimated that there is a shortage of 140,000 – 190,000 people with deep analytical skills to fill the demand of jobs in the U.S. by 2018.
Decoding the human genome originally took 10 years to process; now it can be achieved in one week with the power of Analytic and BI (Business Intelligence). This lecture’s Key Messages is that Analytics provide a competitive edge to individuals , companies and institutions and that Analytics and BI are often critical to the success of any organization.
Methodology used is to teach analytic techniques through real world examples and real data with this goal to convince audience of the Analytics Edge and power of BI, and inspire them to use analytics and BI in their career and their life.
An overview of some methods and principles for big data visualization. The presentation quickly hits on the topic of dashboards and some cyber security uses. The topic of a big data lake is also briefly discussed in the context of a cyber security big data setup.
Ron Tolido presented this at our Meetup on Sept. 16th, 2013.
With digital transformation, the use of digital technologies to radically improve the performance or reach of enterprises, companies can become more customer-centric, more valuable and more profitable. Ron Tolido (@rtolido) discusses digital maturity, digital governance and the role of the chief digital officer (CDO), design principles and a digital transformation roadmap.
Discussed what is Prescriptive Analytics, comparison between Descriptive and Prescriptive Analytics, process, methods and tools. A report presentation conducted at University of East - Manila, Philippines dated July 6, 2017.
Digital Transformation Strategy PowerPoint Presentation Slides SlideTeam
Presenting this set of slides with name - Digital Transformation Strategy Powerpoint Presentation Slides. Our topic-specific Digital Transformation Strategy Powerpoint Presentation Slides presentation deck contains twenty-three slides to formulate the topic with a sound understanding. A range of editable and ready to use slides with all sorts of relevant charts and graphs, overviews, topics subtopics templates, and analysis templates makes it all the more worth. PPT slides are accessible in both widescreen and standard format. PowerPoint templates are compatible with Google Slides. Quick and risk-free downloading process. It can be easily converted into JPG or PDF format
Using the program SAS Enterprise Miner and applications of classification algorithms, including decision trees, regression, neural networks, and random forests to create different types of classification models to predict the shopping intent of visitors to the website columbia.com.tr
Highlights of the Business Analytics seminar by Gary Cokins from October 21, 2014 presentation with Illinois CPA Society.
Gary Cokins is an internationally recognized expert, speaker, and author in performance improvement systems and cost management.
http://www.GaryCokins.com
Data Storytelling: The only way to unlock true insight from your dataBright North
Data visualisation is failing. Many businesses are relying on tools like Excel and PowerPoint to deliver an engaging data story without first establishing the plot. Bright North's latest whitepaper explains why Data Storytelling is the only way to unlock true insight from your data and lists five steps you can take to give your data story a happy ending.
This is a presentation in a meetup called "Business of Data Science". Data science is being leveraged extensively in the field of Banking and Financial Services and this presentation will give a brief and fundamental highlight to the evergreen field.
Customer churn prediction for telecom data set.Kuldeep Mahani
Customer churn prediction and relevant recommendations as per DSN telecom data analysis. Random forest and logistic regression were applied to predict customer churn.
Big Data presence in the high volume in the data storages can help in various ways to learn more about the need and trends of the current market which will be useful for all type of organizations. Modern information technology used to analyze the relationship between social trends and market insights is a useful way to have indirectly interlinked to customers and their interests from unstructured and semi-structured data. Such analysis will give organizations a broader view towards the practical needs of customers and once banking industry or any industry could know the customers, they can serve better and with more flexibility. In this presentation, team has primarily created the platform and designed the architecture in big data technology for banking industry to maximize the users of credit card.
What Is Prescriptive Analytics? Your 5-Minute OverviewShannon Kearns
This slide deck walks you through the basis of understanding prescriptive analytics. Understand the different kinds of prescriptive analytics, how it works, its value, where to find use cases and more!
Economic and social activity facilitated by digital platforms that are typically online matchmakers or technology frameworks. Beyond examples like Amazon, Airbnb, Uber or Baidu, we dive into innovation & startup platforms, which provides a common technology framework upon which others can build, such as the many independent developers.
Topics:
- A fundamental change in business logic
- Basics of platform economy
- Value of data
- Connecting themes
- Platform economy business models
- Case: Startup Commons
- Designing platform economy business models
Objective - to analyse data to Identify items based on the transaction history of customers.
Identify patterns of relationship between data of customers using association rules.
Predictive Analytics in Retail - Visual Infographic Reportc24ltd
A visual infographic report about Predictive Analytics in Retail, based on our whitepaper "Predictive Analytics in Retail" (link: https://blog.c24.co.uk/2016/08/17/c24-publishes-new-predictive-analytics-whitepaper/).
We explore the ways in which Predictive Analytics is set to change how retailers make use of big data, analytics and insights across their customers, supply chain and stores.
https://www.youtube.com/watch?v=eXtWRkfMisM
Durante el 2012 el nivel de fraude en tarjeta de crédito llego a 11.3 billones de dólares, un aumento de casi un 15% comparado con el 2011, esto demuestra el problema que el fraude representa no solo a las instituciones financieras sino también para la sociedad. Tradicionalmente la prevención del fraude consistía en proteger físicamente la infraestructura, sin embargo con cada vez más medios y canales de pago, la información financiera se ha vuelto cada vez más susceptible a ser hurtada. La siguiente opción para prevenir y controlar el fraude consiste en determinar si una transacción está siendo realizada por el cliente de acuerdo con sus patrones históricos de comportamiento. Este es el enfoque de Fraud Analytics.
En esta presentación se mostrara cómo es posible por medio de Fraud Analytics, determinar la probabilidad que una transacción sea o no realizada por el cliente, utilizando la información de compra de los clientes, sus interacciones con la entidad financiera, y por medio de análisis de redes sociales. Adicionalmente, se discutirán y compararan los resultados de las comúnmente utilizadas reglas de decisión y modelos avanzados de Machine Learning.
Gramener's Shravan Kumar took a virtual session with the students of IIM Shillong. It was a fantastic interaction and the participants were keen to understand how data and storytelling are making a difference to new-age businesses. Check out the slides from the session
Humanizing Data Storytelling for Greater Business ImpactGramener
This presentation was shared by Gramener's Kanishk Kumar Abhishek during his guest lecture session at School of Business Management, NMIMS Mumbai.
Check out Gramener's data storytelling workshop for analysts and data scientists at https://gramener.com/data-storytelling-workshop
Storyfying your Data: How to go from Data to Insights to StoriesGramener
Gramener's Director - Client success, Shravan Kumar A, delivered an online session to the students of Praxis Business School.
In his session he talked about how converting data into stories can benefit businesses and enable quick decision making. Furthermore, he shared approaches to create data stories along with some use cases and case studies we solved at Gramener to benefit our clients.
Check out our initiative to teach data storytelling to data scientists and analysts so that they can think out of the box and create wonderful data stories for their stakeholders: https://gramener.com/data-storytelling-workshop
Creating Robust Long-Term Forecasts: The Tellusant 7-Step ViewTellusant, Inc.
This short document describes how sophisticated and careful our long-term predictive models are and allows readers to glean under the hood.
Each step may look easy, but in combination we are unique in the world to make long-term models like these. How we do it in practice is proprietary to us. What you see here are some of the building blocks, at a high level.
We do not build models for customers, per se. We use them to support our strategic planning products into which we integrate predictive models. Our focus is on helping improve decision making, not delivering models.
Having said this, our predictive models are as good or better than anything else in the world. The latest example is PACE (Pricing Aligned with Consumer Economics), which builds on what we describe here, and more.
Workshop Aims:
- Apply some basic principles for displaying tables of data
- Select appropriate types of chart to analyse and present data
- Decide how big a sample to choose in order to be confident in the results
- Explain why an “average” could be very misleading
Quality Control PowerPoint Presentation Slides SlideTeam
Every organization needs to adapt to the ever-changing business environment. Sensing this need, we have come up with these content-ready change management PowerPoint presentation slides. These change management PPT templates will help you deal with any kind of an organizational change. Be it with people, goals or processes. The business solutions incorporated here will help you identify the organizational structure, create vision for change, implement strategies, identify resistance and risk, manage cost of change, get feedback and evaluation, and much more. With the help of various change management tools and techniques illustrated in this presentation design, you can achieve the desired business outcomes. This business transition PowerPoint design also covers certain related topics such as change model, transformation strategy, change readiness, change control, project management and business process. By implementing the change control methods mentioned in the presentation, you will be able to have a smooth transition in an organization. So, without waiting much, download our extensively researched change management framework presentation. With our Change Management Presentation slides, understand the need for change and plan to go through it without any hassles.
6 Methods to Improve Your Manufacturing Process with Computer VisionGramener
Computer vision is a technology that enables computers to interpret and comprehend visual information from their surroundings, and it has the potential to transform the manufacturing industry. Manufacturers can improve their processes in a variety of ways by using computer vision, from ensuring quality control and optimizing production to inspecting and measuring products and monitoring machinery.
In this presentation you will find out 6 methods how you can improve your manufacturing process with computer vision.
Download our E-book
bit.ly/ebookcomputervision
Detecting Manufacturing Defects with Computer VisionGramener
Computer vision is the field of artificial intelligence that deals with the ability of computers to interpret and understand visual data from the world around them. In the manufacturing industry, computer vision can be used to detect defects in products as they are being produced. This can help to improve the quality of the final product and reduce the cost of rework or recalls.
In this presentation you will find out the use of computer vision for defect detection in manufacturing which aids in improving the efficiency and effectiveness of the production process, leading to higher quality products and lower costs.
Book a discovery call
https://reachus.gramener.com/damage-detection/
How to Identify the Right Key Opinion Leaders (KOLs) in Pharma & HealthcareGramener
Find out the importance of KOLs (Key Opinion leaders) in the Pharma industry and everything you need to know about them.
In the presentation, we will show you who is a KOL in the Pharmaceutical Industry, what role they play and how to identify the right KOLs.
Book a free demo
https://gramener.com/demorequest/
Automated Barcode Generation System in ManufacturingGramener
Find out how automating barcode generation can improve the efficiency of your company's operations.
In the presentation, we will show you how barcodes play a significant role in enabling accurate inventory control and real-time stock information and how businesses can reduce 67% of their time in handling label standards.
Get a Free BarGen Demo.
https://gramener.com/demorequest/
#barcode #lowcode
The Role of Technology to Save BiodiversityGramener
Find out what are the major challenges biodiversity is facing such as deforestation, species endangerment, and poaching.
In the presentation, we will show you how some of the major technology and nature conservation organizations are building innovative solutions to protect our biodiversity.
Download this E-book to know how geospatial AI is impacting biodiversity conservation and sustainable development.
https://info.gramener.com/geospatial-analytics-ai-solutions-esg-sector-ebook
Enable Storytelling with Power BI & Comicgen PluginGramener
Gramener’s Lead Data Consultant Mrinal Ghosh and Principal Information Designer Richie Lionell conducted an exciting webinar on Power BI Comicgen.
In this webinar, they talk about the Comicgen Power BI plugin and how to use it to generate compelling comic data stories.
Who should watch: If you're a Power BI Developer, Consultant, or anyone who often develops data graphics on the Power BI dashboard.
Full webinar link: https://info.gramener.com/storytelling-with-power-bi-and-comicgen-plugin
Would you like to learn more about our Power BI capabilities? Check out: https://gramener.com/power-bi-consulting/
The Most Effective Method For Selecting Data Science ProjectsGramener
Ganes Kesari, Gramener's Head of Analytics & Co-Founder gives his insights on how to craft a data science roadmap that maximizes ROI.
The biggest reason why 80% of analytics projects fail is that they don’t solve the right problem. Asking analytics or data-related question is the worst way to initiate a data analytics project.
This webinar will walk you through how to get started in the most efficient way possible. You'll discover a straightforward step-by-step strategy to unlocking corporate value through industry examples.
Things you will learn from this webinar:
-The most common reasons for the failure of data science initiatives
-Identifying projects and prioritizing them
-Building a data science strategy in three easy steps
-Real-life examples are used to explain the approach
Watch this full webinar on: https://info.gramener.com/data-science-roadmap
To know more from our industry experts book a free demo at: https://gramener.com/demorequest/
Low Code Platform To Build Data & AI ProductsGramener
Gramener's CEO, Anand S conducted this webinar where he explained how to build Data and AI products using a low-code platform in less than two weeks.
Few takeaways:
-How low-code approaches can be tailored to your data/digital needs?
-Decisions on Building vs. Buying
-Production-ready use cases to stimulate your thinking
Who should watch?
You will find this webinar to be valuable if you're a CPO, VP IT, handling product development, or building analytical solutions for your company.
Watch this full webinar on: https://info.gramener.com/low-code-platform-to-build-process-optimization-solutions?
Want to know more about our low-code platform, Gramex?
Visit: https://gramener.com/gramex/
5 Key Foundations To Build An Effective CX ProgramGramener
Gramener's VP of Analytics Amit Garg hosted this webinar and talked about what are the principles of a good customer experience program, and why is it important.
This webinar will be beneficial to leaders in the CMO, CCO, Customer Service, and any other customer-facing departments within a firm.
Pain points discussed:
-You'll be able to assess the level of CX maturity in your company.
-You'll learn the high-level steps to creating a successful CX program.
-You'll figure out what tools you'll need to improve your talents.
To watch the full webinar visit: https://info.gramener.com/5-key-foundations-effective-cx-program
Learn more about CX Analytics: https://gramener.com/customer-experience-analytics/
Using Power BI To Improve Media Buying & Ad PerformanceGramener
Gramener's Senior Lead Data Consultant, Sidharth Parameswaran, and Navya Sri Channamsetty, Gramener's Associate Lead Data Science Engineer conducted this joint webinar session.
Pain points discussed:
-Actual vs. planned results of a campaign
-Competitor Evaluation & Comparison
-Modeling of Media Mix
-Metrics assessed across the Agency, Client, and Brand levels
- Genre/Channel Performance Evaluation
Things you will learn:
1. Power BI may be used in a variety of ways to investigate findings.
2. Various dashboards would be used to analyze ad/program performance.
3. How can you help your clients obtain higher ROI and acquire a competitive advantage?
Do join us if you are a:
Power BI Developer, Media buyer, Campaign Manager, Brand Manager, Consultant, etc.
To watch this webinar visit: https://info.gramener.com/power-bi-media-buying-ad-performance
Learn more about Gramener: https://gramener.com/
This webinar was hosted by Gramener's CEO/Co-Founder, Anand S, and Ganes Kesari, Head of Analytics/Co-Founder on how data can help firms recover quickly throughout the recession and recovery period.
Who should watch this webinar :
Analytics Leaders, Business Leaders, CDOs, CTOs, etc.
Few takeaways :
-Which aspects of your company could benefit the most from a data-driven response?
-A strategy for identifying use cases that will provide the most value for the money.
How to use data in creative ways to uncover new market opportunities and customers.
Objectives :
-Data's utility in COVID situation
-How data science may assist you in navigating the recession
-Gramener's industry case studies to assist businesses in responding to COVID-19
Full Webinar: https://info.gramener.com/recession-proofing-your-business-with-data
To know more from industry leaders visit our official website: https://gramener.com/
Engage Your Audience With PowerPoint Decks: WebinarGramener
Gramener's CEO and Co-Founder Anand S hosted a webinar on how interactive PowerPoint decks can engage your audiences.
Pain points discussed in this webinar :
-How to utilize interactive slides to answer business questions like "Where is the problem?" and "What created this problem?"
-What forms of interactivity does PowerPoint offer, and when should you utilize each?
-What tools and plug-ins can aid in the creation of interactive presentations?
Watch the full webinar on: https://info.gramener.com/interactive-powerpoint-for-operations
Book a free demo to know more about Gramener's solutions: https://gramener.com/demorequest/
Structure Your Data Science Teams For Best OutcomesGramener
Gramener's Head of Analytics, Ganes Kesari conducted this webinar and discussed the following points :
-Why do data analytics and visualization initiatives require teams to work in silos?
-What are the best organizational structures for data science?
-As your data journey progresses, how should the organizational structure evolve?
-Best methods for encouraging team collaboration in data projects
This is a unique webinar designed for Executives, Chief Analytics Officers, Heads of Analytics, Directors, Technology Leaders, and Managers that work with data science teams on a daily basis.
To check out the full webinar visit: https://info.gramener.com/data-science-teams-structure-for-best-outcomes
To contact us & book a free demo visit: https://gramener.com/demorequest/
Gramener's Lead Data Scientist Soumya Ranjan and Senior Data Science Engineer Sumedh Ghatage conducted a webinar on Geospatial AI.
In this webinar, they discussed the technical know-how to get started, as well as some strategies for navigating this fascinating realm of Geospatial Analytics.
Pain points covered :
-How to begin with Geospatial Analytics in Python
-How can large-scale geospatial datasets be cleaned and analyzed?
-What is the best way to design geospatial workflows?
-How to use Geospatial Datasets for Deep Learning?
No matter whatever industry you're in, Geospatial Analytics will provide you with a wealth of unique solutions.
To watch the full webinar visit: https://info.gramener.com/geospatial-ai-technical-sneak-peek
To know more about Gramener's Geospatial AI solutions book a free demo on: https://gramener.com/demorequest/
5 Steps To Become A Data-Driven Organization : WebinarGramener
Gramener's Chief Data Scientist and Co-founder Ganes Kesari conducted an interesting webinar that will give you an idea of how to analyze your data maturity and plan the five steps to transforming your business using data.
Who should watch this webinar?
Executives, Chief Data/Analytics Officers, Technology leaders, Business heads, Directors, and Managers.
Important points discussed on the webinar:
-The majority of businesses reach a halt in the middle of their data journey.
-According to Gartner, approximately 87% of companies in the business have a poor degree of data maturity (levels 1 and 2 on a scale of 5).
-Adding more data science projects to your portfolio will not boost your talents or results. The truth is that CDOs' primary issues are divided into five categories.
Learnings from this webinar:
-Data Science Maturity. What is it and why is it important?
-How can you determine the maturity of data science and its limitations?
-How does data science maturity (described with an example) assist your business in progressing?
Watch the full webinar on:
https://info.gramener.com/5-steps-to-transform-into-data-driven-organization
To know more about Data Maturity visit:
https://gramener.com/data-maturity/#
5 Steps To Measure ROI On Your Data Science Initiatives - WebinarGramener
Gramener's Chief Decision Scientist & Co-Founder Ganes Kesari conducted an exciting webinar on how to measure ROI on your data science initiatives.
In this webinar people from the C-suite level CEO, COO, Directors, Managers across various industries joined.
Ganes Kesari covered the following points with industry examples:
-Identifying business use cases with a high impact
-Choosing effective success indicators
-Ascertaining that the consequences may be traced back to your data project
The attendees had a good time. Learnings from the webinar:
-Why do businesses struggle to get a return on their data investments?
-A straightforward framework for calculating the return on investment from your data projects
-Benchmarking of typical payback from data initiatives in the industry
To check out the complete recording of the webinar please visit:
https://info.gramener.com/5-steps-to-measure-roi-on-your-data-science-initiatives
To know more about data advisory check out:
https://gramener.com/advisory-consulting/
Saving Lives with Geospatial AI - Pycon Indonesia 2020Gramener
There’s a powerful way to fight dengue. Infect a mosquito with Wolbachia, release it in highly populated regions, and wait for it to infect all mosquitoes in the region.
But this process is expensive, and we need to release it in the most densely populated regions in a city.
And no one really knows what population density is at a 100m x 100m level.
Can we use satellite imagery and use this to identify building density?
Driving Transformation in Industries with Artificial Intelligence (AI)Gramener
Gramener's Director of Delivery, Priyaranjan Mohanty, delivered a virtual session at IIM Nagpur and talked about how organizations are moving towards digital transformation by leveraging advanced technologies such as Artificial Intelligence (AI), Machine Learning (ML) and Deep Learning.
Starting from what the industry leaders think about digital transformation to how it can shape the global economy, this presentation explores the scope of AI in the digital world.
The Art of Storytelling Using Data ScienceGramener
Gramener's VP - Sales, APAC Region, Vijayam Sirikonda interacted with the students of IIM Raipur and talked about the importance of data storytelling for business users.
Having data doesn't solve any business problem. Finding actionable insights and stories and implementing them to optimize business processes does.
This presentation was created by Sundeep Reddy Mallu for a virtual session with people at Indian School of Business (ISB) - Institute of Data Science.
The slides talk about how to create data stories and what parameters to keep in mind while creating one. With real-time case-studies and use cases of data storytelling, this presentation talks about how business leaders can identify Big, Useful, and surprising insights from big data sets.
Company Valuation webinar series - Tuesday, 4 June 2024FelixPerez547899
This session provided an update as to the latest valuation data in the UK and then delved into a discussion on the upcoming election and the impacts on valuation. We finished, as always with a Q&A
Kseniya Leshchenko: Shared development support service model as the way to ma...Lviv Startup Club
Kseniya Leshchenko: Shared development support service model as the way to make small projects with small budgets profitable for the company (UA)
Kyiv PMDay 2024 Summer
Website – www.pmday.org
Youtube – https://www.youtube.com/startuplviv
FB – https://www.facebook.com/pmdayconference
B2B payments are rapidly changing. Find out the 5 key questions you need to be asking yourself to be sure you are mastering B2B payments today. Learn more at www.BlueSnap.com.
Personal Brand Statement:
As an Army veteran dedicated to lifelong learning, I bring a disciplined, strategic mindset to my pursuits. I am constantly expanding my knowledge to innovate and lead effectively. My journey is driven by a commitment to excellence, and to make a meaningful impact in the world.
[Note: This is a partial preview. To download this presentation, visit:
https://www.oeconsulting.com.sg/training-presentations]
Sustainability has become an increasingly critical topic as the world recognizes the need to protect our planet and its resources for future generations. Sustainability means meeting our current needs without compromising the ability of future generations to meet theirs. It involves long-term planning and consideration of the consequences of our actions. The goal is to create strategies that ensure the long-term viability of People, Planet, and Profit.
Leading companies such as Nike, Toyota, and Siemens are prioritizing sustainable innovation in their business models, setting an example for others to follow. In this Sustainability training presentation, you will learn key concepts, principles, and practices of sustainability applicable across industries. This training aims to create awareness and educate employees, senior executives, consultants, and other key stakeholders, including investors, policymakers, and supply chain partners, on the importance and implementation of sustainability.
LEARNING OBJECTIVES
1. Develop a comprehensive understanding of the fundamental principles and concepts that form the foundation of sustainability within corporate environments.
2. Explore the sustainability implementation model, focusing on effective measures and reporting strategies to track and communicate sustainability efforts.
3. Identify and define best practices and critical success factors essential for achieving sustainability goals within organizations.
CONTENTS
1. Introduction and Key Concepts of Sustainability
2. Principles and Practices of Sustainability
3. Measures and Reporting in Sustainability
4. Sustainability Implementation & Best Practices
To download the complete presentation, visit: https://www.oeconsulting.com.sg/training-presentations
2. DO THESE FOUR CITIES LOOK IDENTICAL TO YOU?
So is the variance in sales.Variance in price is the same.
Average sales is the same too.Average price is the same.
Take a look at the sales report
alongside. A company has
branches in 4 cities, and each
branch changes the product
price every month. This leads to
a corresponding change in the
sales.
Here is the performance of the
four branches with their
monthly price and sales for each
month.
Looking at the average, the four
branches have an identical
performance.
2010 Boston Chicago Detroit New York
Month Price Sales Price Sales Price Sales Price Sales
Jan 10.0 8.04 10.0 9.14 10.0 7.46 8.0 6.58
Feb 8.0 6.95 8.0 8.14 8.0 6.77 8.0 5.76
Mar 13.0 7.58 13.0 8.74 13.0 12.74 8.0 7.71
Apr 9.0 8.81 9.0 8.77 9.0 7.11 8.0 8.84
May 11.0 8.33 11.0 9.26 11.0 7.81 8.0 8.47
Jun 14.0 9.96 14.0 8.10 14.0 8.84 8.0 7.04
Jul 6.0 7.24 6.0 6.13 6.0 6.08 8.0 5.25
Aug 4.0 4.26 4.0 3.10 4.0 5.39 19.0 12.50
Sep 12.0 10.84 12.0 9.13 12.0 8.15 8.0 5.56
Oct 7.0 4.82 7.0 7.26 7.0 6.42 8.0 7.91
Nov 5.0 5.68 5.0 4.74 5.0 5.73 8.0 6.89
Average 9.0 7.50 9.0 7.50 9.0 7.50 9.0 7.50
Variance 10.0 3.75 10.0 3.75 10.0 3.75 10.0 3.75
DO YOU AGREE?
3. ARE THEY REALLY IDENTICAL? CHECK AGAIN…
But in fact, the four cities are
totally different in behaviour.
Boston’s sales has generally
increased with price.
Detroit has a nearly perfect
increase in sales with price,
except for one aberration.
Chicago shows a decline in sales
beyond a price of 10.
New York’s sales fluctuates
despite a nearly constant price.
Boston Detroit
Chicago New York
8. INVESTMENTS IN BIG DATA & ANALYTICS NEED
NOT GUARANTEE BUSINESS EFFECTIVENESS
No coherent
consumption
Enterprises have a disjoint view
of data across divisions. This
impedes org action & speed
Last-mile
disconnect
Longer
Realizations
Processed & analyzed data is not
presented effectively as a story.
Meaningful consumption is an issue
Implementation takes years. System
stabilization takes 1-2 years or more,
with prohibitive cost of change
ENTERPRISES NEED HELP CROSSING THE ANALYTICS CHASM
Org design
Impedes
Org structures & authorization
processes impede quick action after
data bears needed action
10. PREDICTING MARKS
“
What determines a child’s marks?
Do girls score better than boys?
Does the choice of subject matter?
Does the medium of instruction
matter?
Does community or religion
matter?
Does their birthday matter?
Does the first letter of their name
matter?
EDUCATION
16. DETECTING FRAUD
“
We know meter readings are
incorrect, for various reasons.
We don’t, however, have the
concrete proof we need to start
the process of meter reading
automation.
Part of our problem is the
volume of data that needs to be
analysed. The other is the
inexperience in tools or
analyses to identify such
patterns.
ENERGY UTILITY
17. AN ENERGY UTILITY DETECTED BILLING FRAUD
This plot shows the frequency of all meter readings from Apr-
2010 to Mar-2011. An unusually large number of readings are
aligned with the slab boundaries.
Below is a simple histogram (or frequency distribution) of usage levels.
Each bar represents the number of customers with a customers with a
specific bill amount (in units, or KWh).
Tariffs are based on the usage slab. Someone with 101 units is billed in
full at a higher tariff than someone with 100 units. So people have a
strong incentive to stay at or within a slab boundary.
An energy utility (with over 50 million
subscribers) had 10 years worth of
customer billing data available.
Most fraud detection software failed to
load the data, and sampled data
revealed little or no insight.
This can happen in one of two ways.
First, people may be monitoring their
usage very carefully, and turn of their
lights and fans the instant their usage
hits the slab boundary.
Or, more realistically, there’s probably some level of corruption
involved, where customers pay a small sum to the meter reading staff
to ensure that it stays exactly at the slab boundary, giving them the
advantage of a lower price.
18. This plot shows the frequency of all meter readings from Apr-
2010 to Mar-2011. An unusually large number of readings are
aligned with the tariff slab boundaries.
This clearly shows collusion
of some form with the
customers.
Apr-10 May-10Jun-10Jul-10 Aug-10 Sep-10 Oct-10 Nov-10 Dec-10 Jan-11 Feb-11 Mar-11
217 219 200 200 200 200 200 200 200 350 200 200
250 200 200 200 201 200 200 200 250 200 200 150
250 150 150 200 200 200 200 200 200 200 200 150
150 200 200 200 200 200 200 200 200 200 200 50
200 200 200 150 180 150 50 100 50 70 100 100
100 100 100 100 100 100 100 100 100 100 110 100
100 150 123 123 50 100 50 100 100 100 100 100
0 111 100 100 100 100 100 100 100 100 50 50
0 100 27 100 50 100 100 100 100 100 70 100
1 1 1 100 99 50 100 100 100 100 100 100
This happens with specific
customers, not randomly.
Here are such customers’
meter readings.
Section Apr-10 May-10Jun-10 Jul-10 Aug-10 Sep-10 Oct-10 Nov-10 Dec-10 Jan-11 Feb-11 Mar-11
Section 1 70% 97% 136% 65% 110% 116% 121% 107% 114% 88% 74% 109%
Section 2 66% 92% 66% 87% 70% 64% 63% 50% 58% 38% 41% 54%
Section 3 90% 46% 47% 43% 28% 31% 50% 32% 19% 38% 8% 34%
Section 4 44% 24% 36% 39% 21% 18% 24% 49% 56% 44% 31% 14%
Section 5 4% 63% -27% 20% 41% 82% 26% 34% 43% 2% 37% 15%
Section 6 18% 23% 30% 21% 28% 33% 39% 41% 39% 18% 0% 33%
Section 7 36% 51% 33% 33% 27% 35% 10% 39% 12% 5% 15% 14%
Section 8 22% 21% 28% 12% 24% 27% 10% 31% 13% 11% 22% 17%
Section 9 19% 35% 14% 9% 16% 32% 37% 12% 9% 5% -3% 11%
If we define the “extent of
fraud” as the percentage
excess of the 100 unit
meter reading, the
value varies
considerably
across sections,
and time
New section
manager arrives
… and is
transferred out
… with some
explainable
anomalies.
Why would
these happen?
19. SIMPLE HEURISTICS
EMERGENCY
“
A man is rushed to a hospital in
the throes of a heart attack.
The nurse needs to decide
whether the victim should be
admitted into emergency care.
Although this decision can save
or cost a life, the nurse must
decide using only the available
cues, and within a few seconds
– preferably using some fancy
statistical software package.
24. TAKEAWAYS
1. In a single circle with 2 crore customers, this
improvement represents a saving of Rs 2.6 x 2 cr
~ Rs 5 cr / month / circle
2. Testing structure allows us to test out any
number of models, and evaluate their
effectiveness
3. Need to trade-off between simplicity vs over-
fitting. Incremental improvements often not
worth the trouble
4. Implementation needs to be constantly
monitored, with continuous re-evaluation of the
model
25. ANALYSING CAUSAL DRIVERS
We group by
every input factor
… and calculate the
impact on every metric.
By moving from average to the best
group, what’s the improvement?
The actual performance
by each group is shown
0-3m 3-6m 6m-1yr 1-2 yrs > 2 yrs
11 12.3 12.7 15.3 16.1
Only significant results shown
27. Tata Teleservices
Tata Consultancy Services
Tata Business Support Services
Tata Global Beverages
Tata Infotech (merged)
Tata Toyo Radiator
Honeywell Automation India
Tata Communications
A G C Networks
Tata Technologies
Tata Projects
Tata Power
Tata Finance
Idea Cellular
Tata Motors
Tata Sons
Tata Steel
Tayo Rolls
Tata Securities
Tata Coffee
Tata Investment Corp
A J Engineer
H H Malgham
H K Sethna
Keshub Mahindra
Ravi Kant
Russi Mody
Sujit Gupta
A S Bam
Amal Ganguli
D B Engineer
D N Ghosh
M N Bhagwat
N N Kampani
U M Rao
B Muthuraman
Ishaat Hussain
J J Irani
N A Palkhivala
N A Soonawala
R Gopalakrishnan
Ratan Tata
S Ramadorai
S Ramakrishnan
DIRECTORSHIPS AT THE TATAS
Every person who was a Director at the Tata
Group is shown here as an orange circle. The size of
the circle is based on the number of directorship
positions held over their lifetime.
Every company in the Tata Group is
shown here as a blue circle. The size of the
circle is based on the number of directors the
company has had over time.
Every directorship relation is shown
by a line. If a person has held a
directorship position at a company, the two
are connected by a line.
The group appears to be divided into
two clusters based on the network of
directorship roles.
Prominent leaders
bridge the groups
Second group of companies
First group of companies
Some directors are
mainly associated with
the first group of
companies
Some directors are
mainly associated with
the second group of
companies
28. SIMILARITIES IN AN SME TRANSACTION NETWORK
The same visual was
applied to the SME
clientele of a bank
• Identified clusters of
SMEs transacting with
each other
• Targeted non-clients
in the middle of a
client cluster
• Enhanced service for
client in the middle of
non-clients
This resulted in a
28% QOQ GROWTH
in new accounts
(against a default QoQ
base of 3-8% in the
city for the last 5
years)
We’ve used network diagrams to detect terrorism, corporate fraud,
de-dup customers, and identify product affinities
30. PORTFOLIO PERFORMANCE VISUAL
Worldwide$288.0mn
A: Accelerate$68.9mn
B: Build$77.2mn
C: Cut down$141.9mn
Worldwide:
$288 mn
The visualization shows the market
opportunities across various countries to
identify areas of focus. This chart has
been built as an interactive-app to
present the key findings, while letting
user click-through and drill-down to a
custom view across 4 different levels.
Open
37. FINDING PATTERNS
“
Which securities move together?
How should I diversify?
What should I sell to reduce risk?
What’s a reliable predictor of a
security?
SECURITIES
38. 68% correlation
between AUD & EUR
Plot of 6 month daily
AUD - EUR values
Block of correlated
currencies
… clustered
hierarchically
41. RESTAURANT FOUND AN UNUSUAL DIP IN SALES
A restaurant chain had data for every
single transaction made over a few
years. Plotting this as a time series
showed them nothing unusual.
However, the same data on a calendar
map reveals a very different story.
Specifically, at the bottom left point-of-sale terminal, sales dips on every
Wednesday. At the bottom right point-of-sale terminal, sales rises on
every Wednesday (almost as if to compensate for the loss.)
It turns out that the manager closes the bottom-left counter every
Wednesday afternoon due to shortage of staff, assuming that it results in
no loss of sales. There is, however, a net loss every Wednesday.
42. BANK FOUND ALL LOANS BEFORE 20TH POOR
Every loan disbursed after the 20th of the month, i.e. from the 21st to
the end of the month, shows consistently lower non-performing assets
(i.e. better quality) than any loan disbursed prior to the 20th.
The bank mapped this back to their incentive scheme. The sales team’s
commission is based only on loans disbursed until the 20th. Hence new
loans are squeezed into this period without regard for their quality.
The personal finance division of a
bank, focusing on retail loans, drove
its sales through a branch sales team.
A study of the non-performing assets
of loans generated over the course of
one year shows a strange pattern.
Analytics can detect something that you’re specifically looking for.
It takes a visual to detect what we don’t know to look for
This representation, known as a
calendar map, can show some
interesting patterns, particularly
weekday-based patterns, as the next
example will show.
50. How does Mahabharata, one of the largest epics with 1.8
million words lend itself to text analytics?
Can this ‘unstructured data’ be processed to extract
analytical insights?
What does sentiment analysis of this tome convey?
Is there a better way to explore relations between
characters?
How can closeness of characters be analysed &
visualized?
VISUALISING THE MAHABHARATA
51. 3642 LIC
3148 MTNL
2494 BSES
444 RELIANCE ENERGY
426 ESCROW
396 ICICI
378 CLG RTD
294 MAHANAGAR GAS
232 HDFC
216 MAHANGAR GAS LTD
212 ORANGE
204 LIC OF INDIA
190 ESCROW A/C
54. TWO ROUTES TO BUILDING ANALYTIC CAPABILITY
Stakeholder
groups
Objectives Initiatives Questions Data
have a set of that can be met by which answer specific using
for that meet that can address suggests
Business driven approach
Data driven approach
Importance
Ease
Quick wins
Strategic
Deferred
Revenue impact
Breadth of usage
Effort reduction
Data availability
Technology feasibility
Start small with quick
wins
Cover strategic landscape
Deferreds become easier
with growing capability
Actions
Gap in current reports
Addressed by current reports
1
2
55. TYPICAL INITIATIVES WE SEE ACROSS BANKS TODAY
Deposit mobilisation
Product
performance
Branch performance
Employee
performance
Transaction
performance (e.g.
ATM)
Performance
Product bundling
Competitive
positioning
Product management
Predicting churn
Driving cross-sell
Product
recommendations
Customer mgmt
Fraud detection
Scenario modelling
(e.g. interest rate
change)
Risk management
Data driven insights
in statements
Social listening
Client communication
Infrastructure Initiatives in parallel: Digitisation and Data Cleansing
56. NEW TECHNIQUES MAKE THESE POSSIBLE
The visuals shown in the earlier slides
were created using the Gramener
visualization server, which leverages
some of the recent innovations at
Gramener in automating
Visuals are templatized.
As the data or the parameters
change, the visuals are re-drawn
to match the data, ensuring that
the view shows live data in real-
time.
We’ve extracted common
patterns of insights that apply
across all datasets. When data is
fed in, these automated analysis
components perform a sequence
of analytic steps and display
results visually.
Binding visuals together into a
logical story using text or audio
that weaves a story is an integral
part of communicating insights.
This too is automated in
Gramener’s visualizations.
Visualizations Analysis Narration
For e.g., this has been used to
• view social media events
• election results
• oil leakages in fuel stations
• monitor retail inventory
• plan truck delivery
• monitor sentiments on social
media
This has been applied to
• identify which security would
go well with a given portfolio
• predict which telecom
customers will leave
• assess the impact of changing
delivery channel for proxy votes
This has been applied to
• automatically “writing” a
newspaper column on the day’s
stock market
• automatically writing the report
summarising the status of
clinical trials
• automated videos
These techniques are focused on automating patterns of insights made
by humans – effectively systematizing the “magic” that happens when
we find something interesting in data. This is similar to how chess
playing programs work. It’s not intelligent, as such. It just calculates
and evaluates so many moves automatically that it seems intelligent.
AUTOMATION
57. TAKE YOUR NEXT STEP TOWARDS
DATA-DRIVEN LEADERSHIP
S Anand, Chief Data Scientist, Gramener
Editor's Notes
This company asked four of its branches to change the price of a product for one year, to measure the resulting sales and therefore the price elasticity. This table shows the price and sales of the product from Jan to Nov 2010 for Boston, Chicago, Detroit and New York.
You’ll notice that the average price across all 4 cities is the same: 9.0. The average sales is the same at 7.5. The variances, i.e. the square of the standard deviation, are also the same at 10.0 and 3.75 respectively. Usually, in such cases, it’s only the summary statistics that are presented. You rarely see the individual data points.
It’s easy to conclude based on this that the four cities are identical. Yet, are they? Let’s plot this data.
You can see that in Boston, as the price increases, the sales increase by-and-large. In Chicago, it starts dropping beyond a certain price. At Detroit, it’s a nearly perfect linear increase, except for one month. Was that a data error? An unusual market condition? Fraud? In New York, the price never changed. Didn’t they get the instructions? And yet, there is one outlier. Is that a data error? Unusual market? Fraud?
Not only are we able to see that the cities are different, we are also able to see the pattern of their behaviour, and further, identify anomalous data points for further exploration. If there’s one piece of advice that we normally give people, it is: plot data raw. It invariably leads to insights that are not obvious from summary data.
A data insight is not guaranteed until a story line is defined.
A story line is obtained from the correct visual consumption of enormous data sets. Scores of datasets do not guarantee meaningful insights but if connected throughout with exact use-cases, each and every mile stone can be connected and actionable insights can be derived at the end.
Once, the process is established, the future data processing/consumption becomes easy.
We did the simplest possible thing – plot the number of customers who had meter readings of 0, 1, 2, 3, etc. – all the way up to 300 and beyond. (Effectively, we drew a histogram.)
As expected, it was log-normal. Relatively few users with low meter readings, and few with high meter readings. But what was striking were the spikes – at 50 units, 100 units, 200 units and 300 units – precisely at the slab boundaries.
Given the metering system, there is a strong economic incentive to stay at or within a slab boundary. Exceeding it increases the unit rate. However, there are two ways this could happen. Either the consumer watches their meter carefully, and the instant it hits 100, stops using their lights and fans – or a certain amount of money changes hands.
It was easy to see from this that there was fraud happening, but what stumped us were the spikes at 10, 20, 30, 40, etc. Here, there’s no economic incentive. There’s no significant difference between a meter reading of 10 vs 11, so there was no incentive to commit fraud. However, we later learnt that we were looking at this the wrong way. This was not a case of fraud, but of laziness. These were the meter readings taken by staff that never visited the premises, and were cooking up numbers.
When people cook up numbers, they cook up round numbers. (An official said that he had to let go of one person who had not taken readings in a colony of houses for as long as six months. “Sir, there’s a pack of dogs in the colony” was his official statement.)
The other question is, what is the nature of this fraudulent contract. Is it monthly? The meter reading guy appears and charges a small sum to adjust the reading? Or is it an annual contract that’s paid upfront? We looked at the meter readings of some of the people who were consistently at the slab boundaries. For example, the table in the middle has the readings of 10 customers, one per row. In the first row, the readings are consistently at 200 for 9 of the 12 months. However, there’s a spike in Jan-11 to 350 units. This indicated a monthly contract with a failure to pay in just one month. However, we later learnt that many of the people on this list were famous personalities. In fact, the lady in the first row had an event at their place in Jan-11, and the actual reading was expected to be well over a thousand units. But since the electricity board has a policy of not often auditing those that were in the highest slab (above 300), a more likely explanation was a collusion of the lineman with the customer to place her in the highest slab just this month, to avoid scrutiny.
Lastly, we were examining the level at which fraud can be controlled. The last table above shows the extent of fraud of each section in one city, month on month. (The extent of fraud can be measured by the relative height of the spikes compared to the expected value.) Sections vary in the level of fraud, with Section 1 having significantly more fraud than Section 9. We also observe that fraud generally decreases in the winter season (Dec – Feb) when the need for cooling is less. But what’s most striking is the negative fraud in Section 5 in Jun-10. It stays low for a couple of months, and then, as if to compensate, shoots up to 82% in Sep-10.
We learnt that this coincided with the appointment and transfer of a new section manager – under whose “regime”, fraud seems to have been dramatically controlled. It appears that a good organisation level to control fraud is at the 5,000 people strong section manager level, rather than the 100,000 people strong staff level.
Medical Institutions have vital heuristics. Each and every diagnosis has parameters latched onto it. An initial scan must be done to identify the basic ailment and proceed further. We thought how can we speed it up? A person has a severe heart attack and he cannot wait for all the scans to be done to proceed to the next sequence of treatment.
Rather, we can have a simple set of parameters which has to be checked quickly and admit the patient for treatment. The decision of admitting to a critical care unit or not is simplified and sped up. The visual cues hence can help the nurse take quick decisions statistically rather than taking a decision by wit.
Measure the pressure, use stethoscope and sphygmomanometer. If it comes out to be more than 91, he has to be admitted immediately to the intensive care unit. If the pulse is not more than 91, the age must be checked, if the age is more than 62, chances of patient stabilizing without any intensive care is ruled out. But, if the age comes out to be lesser than 62, his pulse must be diagnosed. The pulse must not be higher than 100, if it is higher than 100, the patient must be taken to the emergency ward.
Thus, a step by step pre-defined process identifying the causes and the remedies will help in saving lives. This simple visual cue through a dashboard not only saves many lives daily but also technologically aides medical workforce to record and reproduce the patient history.
Decision tree model used here helps in breaking down complicated situations down to easier-to-understand scenarios.
A decision tree is a visual representation of choices, consequences, probabilities and opportunities. They are visual representations of the average outcome.
Applying the same fundamental to predict the churn handling we were able to calculate the cost per customer and improvements which were done.
On an average, whether an outgoing call was made from the phone. In case of a viable answer, we were able to fix 3 buckets of 0-4 days, 5 to 14 and more than 15 days. If the call has not been made for more than 15 days, there will no recharge voucher applied and the customer may likely leave the network. In cases where the call has been done within 15 days and the simultaneous recharge has been done only once, what has been the recharge amount. If amount is greater than 50, the loop starts from beginning and we establish that the consumer is engaged and spending will not be huge.
Earlier, the telecom operator for whom the design has been done was spending more. The decision tree helped them to save 62% of their costs with only 3.2% of cases on an overall basis.
This also deals with customer prepaid churn for a telecom operator. Instead of decision tree, in this use case we applied Support Vector Machines to understand the customer costs and improvements to the earlier model used by the organization, if any. (This is independent of the last use case in previous slide).
The basic SVM networks represent various points in space which can be divided into categories by a visible demarcation. The first visual arranges the points in 4 quadrants where the axis and nearby elements’ area remain unoccupied.
The adjacent shows up a soft margin SVM model depicting customers and the cost incurred.
On final analysis, we received that the cost per customer comes out to be 34 with an improvement of 66.6% with negligible scores of missed and wasted opportunities.
We were working with the wealth management team of a European bank. They said, “We have a problem. When telling our customers what transactions to make, we base our advice on two very simple principles. First, if you have two securities that behave similarly, you should consolidate. For example, there is no benefit in holding shares of two oil companies. When the price of one rises, the other invariably rises too. So it’s practically like holding the same company’s stock.”
“On the other hand, having consolidated, make sure you have a good hedge. For example, if you hold oil companies, buy a bit of gold. When oil companies drop, gold typically rises. Gold is a reasonably good hedge against oil companies.”
He said, “This is the basis of the bulk of the advice we give clients. But in order to arrive at this advice, our analysts have to go through 150 reports, which is humanly impossible. We know they don’t actually do that. We sometimes pass these reports on to our clients. They clearly never read these. As a result, our transaction volumes are not as high as we would like to be, mainly because people do not understand why they need to make a trade.”
So, what we did was put a variant of this visual together. On the right, you have a series of currencies like the Australian dollar, the Euro, the British pound, etc; some commodities like silver and gold; and some stock indices like Sensex, FTSE, and S&P.
The cells here have a number inside that indicates the pairwise correlation between a pair of securities. For example, the number 68 on the top left indicates a 68% correlation between the Australian dollar and the Euro. To the left of the Euro and just below the dollar (diagonally opposite to the 68), there’s a scatter plot that shows the daily prices of both these currencies. Each dot is one day’s data. The x-axis shows the Australian dollar value. The y-axis shows the Euro value. This helps identify what the pattern of movements of any two currencies is. From this, you can easily see visually that the Australian dollar and the Euro both tend to move together. Or, where there are strong correlations like the FTSE & S&P, the pattern is almost a straight line.
In some cases there are negative correlations. For instance, if you take the Sensex against the Japanese Yen, the correlation is -79%. The cells are coloured based on their correlation values. Greens indicate strong positive correlation. Reds indicate strong negative correlation.
These are also grouped hierarchically. On the left, we have a series of lines indicating clusters. The most similar securities are grouped together. So FTSE and S&P with a 98% correlation are very close. The ones that are less correlated are kept further away based on a tree-structure.
This leads to clustering of securities. For example, there is a green block in the center which has SGD, JPY, XAU, CHF and CNY. All of these are fairly well correlated. When any one currency in this block goes up, all the others go up as well. When any one goes down, all others go down as well.
Similarly, you have another block to its top left: S&P, FTSE, Sensex and to a certain extent, the Pakistani Rupee. These move together as a block as well.
But when this block goes up, all the currencies in the other block go down, as indicated by the red negative correlations between these two blocks.
This can be used very easily for decision making. For example, one client who was trading with Singapore and Japan looked at the strong correlation and decided to consolidate their holdings in Japanese Yen. They then moved up and down this column to find a good hedge. FTSE looked like a good hedge – it was the most negatively correlated with JPY at that time -- and they decided to place a third of their portfolio in FTSE.
A sheet like this improves people’s understanding of relatively complex data, and results in significantly increased trade volumes.
We were working with a restaurant who had 7 months’ worth of sales data, and asked what we could do with this data. It was a fairly open-ended problem.
Among other things, we looked at the various product categories they sold, such as starters, breads, desserts, etc. and the pairwise correlations between each of these.
The number in each cell shows the pairwise correlation between any two products. The 17 on the top left, for example, indicates a 17% correlation between side dishes and meals. The scatter plots diagonally opposite show the correlations between these visually as well. These are colour coded based on the correlation. The redder it is, the more negative the correlation. The greener it is, the more positive the correlation.
There are a few patterns that emerge. For example: desserts are positively correlated with every product. The row and column are green right through, indicating that it doesn’t matter what people eat – they usually have desserts at the end.
Starters are an interesting category. They were introduced 4 years ago as a loss-leader, with the aim of increasing the restaurant’s menu variety and to bring in footfall. As a result, they were priced at cost. You can see from this that starters sell well with breads (rotis, naans, etc). They sell well with desserts, but then, everything sells well with desserts. But they reduce the sales of every other product!
What’s been happening is that since starters were so attractive, people were coming in, ordering starters and desserts, and leaving. As a result, this initiative had been a net loss for the profit margin, though it had not been spotted for nearly four years.
When you look at the correlations at an individual item level, it turns out that there’s one product that is negatively correlated with almost every other product: the 1 litre mineral water bottle.
This is a curious phenomenon, and our client explained this once they realised what was happening. Theirs is a low-end chain of restaurants and it’s mostly individuals (not families) that visit this restaurant. Their customers are rather price-conscious. When they buy 1 litre of water, they want to make sure that they do not waste it. And when an entire litre is consumed, there’s not much space in the stomach for other things.
An obvious solution was to replace the 1 litre packaging with a smaller 200ml bottle. This ends up turning the entire row and column of reds into neutral yellows, resulting in an overall increase in sale of all products.
For the same chain, we also looked at the daily sales across restaurants. Here are a series of calendar maps showing the daily sales for four different points of sale terminals at one restaurant. Each calendar map shows a calendar for 7 months. Each day is coloured based on the value of sales on that day. Red indicates low sales, green indicates high sales.
For the two terminals at the front (i.e. the ones you see on top), sales was relatively low during the first two months, but picked up steadily thereafter. It’s easy to spot the exceptions among this. For example, the 30th and 31st of January were good days for both terminals.
Interestingly, when you look at the terminal at the bottom left, there is a red bar indicating consistent dip in sales every Wednesday. Almost as if to compensate, the terminal at the bottom right has an increase in sales every Wednesday – but not as significant as the dip.
We did not have an explanation for this, though our client did a few weeks later. It turned out that the person manning the bottom left counter takes half-day off every Wednesday, and was not being replaced by the manager. The queue naturally shifts over to the other terminal, increasing the sales. But this restaurant is in an area where there are many other food outlets. Once the queue reaches a certain size, people drop off, resulting in a net loss in sales every Wednesday – a loss that had gone unobserved for at least 7 months.