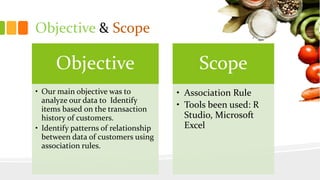
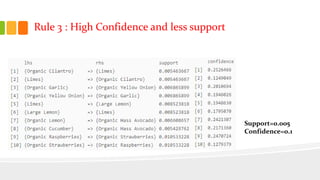
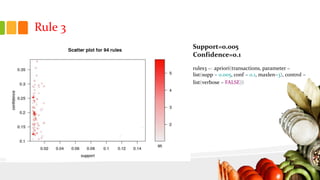
INSTACART ASSOCIATION ANALYSIS
Presented By,
Sharanya Prathap
Mount Carmel College
B.VOC (Analytics)
Batch 2018
Table of Content
• Scope and objectives
• Introduction
• Modelling process
Data extraction
Data cleansing
• Association analysis
• Conclusion
Objective & Scope
Objective
• Our main objective was to
analyze our data to Identify
items based on the transaction
history of customers.
• Identify patterns of relationship
between data of customers using
association rules.
Scope
• Association Rule
• Tools been used: R
Studio, Microsoft
Excel
What is Instacart?
• Online grocery ordering app ,store.
• Aims to Deliver Groceries in an Hour.
Modelling Process
– Data Extraction
Data is extracted from Kaggle. This is an anonymized data on
customer orders over time.
- Data Cleaning
Naturally, unstructured data. Hence, data cleaning (or cleansing,
scrubbing) is important in further analysis. We cleaned our data, Orders
data for days_since_prior_order consist of some missing values so first we
will replace all our missing values with some mode of the values.
Data Dictionary
EDA
Objective 1
Identify the items based on the transaction
history of customers using affinity analysis.
Analyzing the baskets
While most of the users have 8 products in their baskets, the average basket
contains 10 products. For determining the number of products in the future
baskets
The idea is to look at the purchase
history of each user, get the average
number of items in the baskets and
use this number for predicting the
number of items in future baskets.
The count and list the 15 most popular products in the basket
Fresh Veggie and Fresh Fruits are
most often sold by Aisle
So, basically we conclude that Fruits,Veggies Products have high probability to be ordered by
customers when he makes his next purchase
Milk or Dairy Products are the highest
reordered by customer
So, basically we conclude that Milk/Dairy Products have high probability to be ordered by
customers when he makes his next purchase
Association Analysis:
Association Identifies how the data items are associated with
each other.
Association rules are created by analyzing data patterns and
using the criteria support and confidence to identify the most
important relationships.
Support and Confidence
Support
• Support measures the probability of collection of items
being brought together.
Confidence
• Confidence measures that if a customer buys one product
‘A’ they will buy another product ‘B’, or A=>B. The
confidence of A =>B can be estimated as frequency that
someone will buy both A and B divided by the probability
they will buy A.
Rule 1:Low support and High Confidence
Support=0.003269976
Confidence=0.01
Rule 1
Support=0.003269976
Confidence=0.01
rules <- apriori(transactions, parameter =
list(supp = 0.003269976, conf = 0.01,
maxlen=3), control = list(verbose = FALSE))
Rule 2:Support and Confidence
Support=0.001
Confidence=0.4
Rule 2
Support=0.001
Confidence=0.4
rules2 <- apriori(transactions, parameter =
list(supp = 0.001, conf = 0.4, maxlen=3),
control = list(verbose = FALSE))
Rule 3 : High Confidence and less support
Support=0.005
Confidence=0.1
Rule 3
Support=0.005
Confidence=0.1
rules3 <- apriori(transactions, parameter =
list(supp = 0.005, conf = 0.1, maxlen=3), control =
list(verbose = FALSE))
Conclusion
Using the association rules (rule 1-3), the next purchase of a
customer can be predicted based on his purchase history.
Rules can be refined further based on support and
confidence combination.
Using Jakart Index affinity between different item
combinations can be calculated which would help in
prediction of next purchase of customer.
THANK YOU

Instacart Market Basket Analysis

  • 1.
    INSTACART ASSOCIATION ANALYSIS PresentedBy, Sharanya Prathap Mount Carmel College B.VOC (Analytics) Batch 2018
  • 2.
    Table of Content •Scope and objectives • Introduction • Modelling process Data extraction Data cleansing • Association analysis • Conclusion
  • 3.
    Objective & Scope Objective •Our main objective was to analyze our data to Identify items based on the transaction history of customers. • Identify patterns of relationship between data of customers using association rules. Scope • Association Rule • Tools been used: R Studio, Microsoft Excel
  • 4.
    What is Instacart? •Online grocery ordering app ,store. • Aims to Deliver Groceries in an Hour.
  • 5.
    Modelling Process – DataExtraction Data is extracted from Kaggle. This is an anonymized data on customer orders over time.
  • 6.
    - Data Cleaning Naturally,unstructured data. Hence, data cleaning (or cleansing, scrubbing) is important in further analysis. We cleaned our data, Orders data for days_since_prior_order consist of some missing values so first we will replace all our missing values with some mode of the values.
  • 7.
  • 8.
    EDA Objective 1 Identify theitems based on the transaction history of customers using affinity analysis.
  • 9.
  • 10.
    While most ofthe users have 8 products in their baskets, the average basket contains 10 products. For determining the number of products in the future baskets The idea is to look at the purchase history of each user, get the average number of items in the baskets and use this number for predicting the number of items in future baskets.
  • 11.
    The count andlist the 15 most popular products in the basket
  • 12.
    Fresh Veggie andFresh Fruits are most often sold by Aisle So, basically we conclude that Fruits,Veggies Products have high probability to be ordered by customers when he makes his next purchase
  • 13.
    Milk or DairyProducts are the highest reordered by customer So, basically we conclude that Milk/Dairy Products have high probability to be ordered by customers when he makes his next purchase
  • 14.
    Association Analysis: Association Identifieshow the data items are associated with each other. Association rules are created by analyzing data patterns and using the criteria support and confidence to identify the most important relationships.
  • 15.
    Support and Confidence Support •Support measures the probability of collection of items being brought together. Confidence • Confidence measures that if a customer buys one product ‘A’ they will buy another product ‘B’, or A=>B. The confidence of A =>B can be estimated as frequency that someone will buy both A and B divided by the probability they will buy A.
  • 16.
    Rule 1:Low supportand High Confidence Support=0.003269976 Confidence=0.01
  • 17.
    Rule 1 Support=0.003269976 Confidence=0.01 rules <-apriori(transactions, parameter = list(supp = 0.003269976, conf = 0.01, maxlen=3), control = list(verbose = FALSE))
  • 18.
    Rule 2:Support andConfidence Support=0.001 Confidence=0.4
  • 19.
    Rule 2 Support=0.001 Confidence=0.4 rules2 <-apriori(transactions, parameter = list(supp = 0.001, conf = 0.4, maxlen=3), control = list(verbose = FALSE))
  • 20.
    Rule 3 :High Confidence and less support Support=0.005 Confidence=0.1
  • 21.
    Rule 3 Support=0.005 Confidence=0.1 rules3 <-apriori(transactions, parameter = list(supp = 0.005, conf = 0.1, maxlen=3), control = list(verbose = FALSE))
  • 22.
    Conclusion Using the associationrules (rule 1-3), the next purchase of a customer can be predicted based on his purchase history. Rules can be refined further based on support and confidence combination. Using Jakart Index affinity between different item combinations can be calculated which would help in prediction of next purchase of customer.
  • 23.