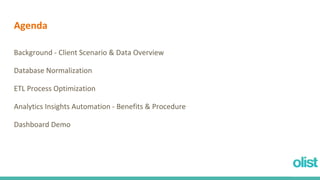
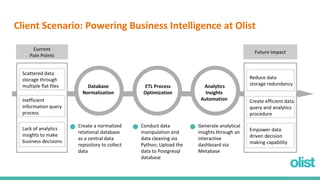
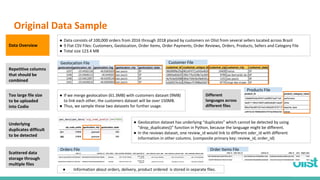
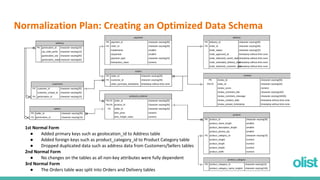
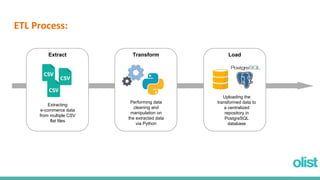
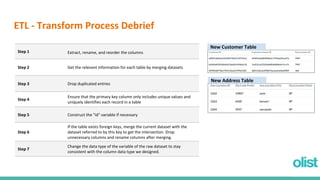
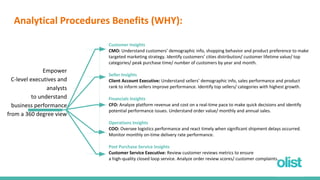
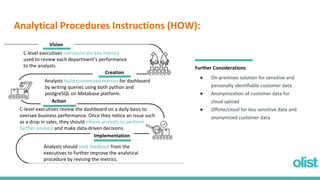
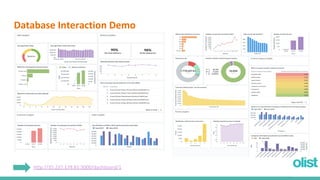
Olist
A Brazilian E-commerce Company
APAN 5310 Project Team 1
Juno Zhu | Manasa Damera | Sarah Faye Wu | Yuhuan Su
Agenda
Background - Client Scenario & Data Overview
Database Normalization
ETL Process Optimization
Analytics Insights Automation - Benefits & Procedure
Dashboard Demo
Client Scenario: Powering Business Intelligence at Olist
Database
Normalization
Create a normalized
relational database
as a central data
repository to collect
data
ETL Process
Optimization
Conduct data
manipulation and
data cleaning via
Python; Upload the
data to Postgresql
database
Analytics
Insights
Automation
Generate analytical
insights through an
interactive
dashboard via
Metabase
Scattered data
storage through
multiple flat files
Inefficient
information query
process
Lack of analytics
insights to make
business decisions
Current
Pain Points
Reduce data
storage redundancy
Create efficient data
query and analytics
procedure
Empower data
driven decision
making capability
Future Impact
Original Data Sample
Repetitive columns
that should be
combined
Geolocation File Customer File
Too large file size
to be uploaded
into Codio
Data Overview
● Data consists of 100,000 orders from 2016 through 2018 placed by customers on Olist from several sellers located across Brazil
● 9 Flat CSV Files: Customers, Geolocation, Order Items, Order Payments, Order Reviews, Orders, Products, Sellers and Category File
● Total size 123.4 MB
● If we merge geolocation (61.3MB) with customers dataset (9MB)
to link each other, the customers dataset will be over 150MB.
● Thus, we sample these two datasets for further usage.
Underlying
duplicates difficult
to be detected
● Geolocation dataset has underlying “duplicates” which cannot be detected by using
“drop_duplicates()” function in Python, because the language might be different.
● In the reviews dataset, one review_id would link to different oder_id with different
information in other columns. (composite primary key: review_id, order_id)
Scattered data
storage through
multiple files
Different
languages across
different files
Products File
Orders File Order Items File
● Information about orders, delivery, product ordered is stored in separate files.
Normalization Plan: Creating an Optimized Data Schema
1st Normal Form
● Added primary keys such as geolocation_id to Address table
● Added foreign keys such as product_category_id to Product Category table
● Dropped duplicated data such as address data from Customers/Sellers tables
2nd Normal Form
● No changes on the tables as all non-key attributes were fully dependent
3rd Normal Form
● The Orders table was split into Orders and Delivery tables
Extract
ETL Process:
Transform Load
Uploading the
transformed data to
a centralized
repository in
PostgreSQL
database
Extracting
e-commerce data
from multiple CSV
flat files
Performing data
cleaning and
manipulation on
the extracted data
via Python
ETL - Transform Process Debrief
Step 1 Extract, rename, and reorder the columns
Step 2 Get the relevant information for each table by merging datasets
Step 3 Drop duplicated entries
Step 4
Ensure that the primary key column only includes unique values and
uniquely identifies each record in a table
Step 5 Construct the "id" variable if necessary
Step 6
If the table exists foreign keys, merge the current dataset with the
dataset referred to by this key to get the intersection. Drop
unnecessary columns and rename columns after merging.
Step 7
Change the data type of the variable of the raw dataset to stay
consistent with the column data type we designed.
New Customer Table
New Address Table
Analytical Procedures Benefits (WHY):
Customer Insights
CMO: Understand customers’ demographic info, shopping behavior and product preference to make
targeted marketing strategy. Identify customers’ cities distribution/ customer lifetime value/ top
categories/ peak purchase time/ number of customers by year and month.
Seller Insights
Client Account Executive: Understand sellers’ demographic info, sales performance and product
rank to inform sellers improve performance. Identify top sellers/ categories with highest growth.
Financials Insights
CFO: Analyze platform revenue and cost on a real-time pace to make quick decisions and identify
potential performance issues. Understand order value/ monthly and annual sales.
Operations Insights
COO: Oversee logistics performance and react timely when significant shipment delays occurred.
Monitor monthly on-time delivery rate performance.
Post Purchase Service Insights
Customer Service Executive: Review customer reviews metrics to ensure
a high-quality closed loop service. Analyze order review scores/ customer complaints.
Empower
C-level executives and
analysts
to understand
business performance
from a 360 degree view
Analytical Procedures Instructions (HOW):
C-level executives communicate key metrics
used to review each department’s performance
to the analysts.
Creation
Vision
Analysts build customized metrics for dashboard
by writing queries using both python and
postgreSQL on Metabase platform.
Action
C-level executives review the dashboard on a daily basis to
oversee business performance. Once they notice an issue such
as a drop in sales, they should inform analysts to perform
further analysis and make data-driven decisions.
Implementation
Analysts should seek feedback from the
executives to further improve the analytical
procedure by revising the metrics.
Further Considerations
● On-premises solution for sensitive and
personally identifiable customer data
● Anonymization of customer data for
cloud upload
● Offsite/cloud for less sensitive data and
anonymized customer data
Database Interaction Demo
http://35.237.178.81:3000/dashboard/1
Thank you!
Q&A
References
Data Sources:
1. Kaggle (Brazilian E-Commerce Public Dataset by Olist),
https://www.kaggle.com/olistbr/brazilian-ecommerce/home
2. Silberschatz, A., Korth, H. F., and Sudarshan, S. (2011). Database System Concepts (6th Edition). McGraw-Hill.
ISBN-13: 978-0073523323
Code - Data sampling [Link]
Code - Create database & Extract, Transform, Load in Python [Link]

Team project - Data visualization on Olist company data

  • 1.
    Olist A Brazilian E-commerceCompany APAN 5310 Project Team 1 Juno Zhu | Manasa Damera | Sarah Faye Wu | Yuhuan Su
  • 2.
    Agenda Background - ClientScenario & Data Overview Database Normalization ETL Process Optimization Analytics Insights Automation - Benefits & Procedure Dashboard Demo
  • 3.
    Client Scenario: PoweringBusiness Intelligence at Olist Database Normalization Create a normalized relational database as a central data repository to collect data ETL Process Optimization Conduct data manipulation and data cleaning via Python; Upload the data to Postgresql database Analytics Insights Automation Generate analytical insights through an interactive dashboard via Metabase Scattered data storage through multiple flat files Inefficient information query process Lack of analytics insights to make business decisions Current Pain Points Reduce data storage redundancy Create efficient data query and analytics procedure Empower data driven decision making capability Future Impact
  • 4.
    Original Data Sample Repetitivecolumns that should be combined Geolocation File Customer File Too large file size to be uploaded into Codio Data Overview ● Data consists of 100,000 orders from 2016 through 2018 placed by customers on Olist from several sellers located across Brazil ● 9 Flat CSV Files: Customers, Geolocation, Order Items, Order Payments, Order Reviews, Orders, Products, Sellers and Category File ● Total size 123.4 MB ● If we merge geolocation (61.3MB) with customers dataset (9MB) to link each other, the customers dataset will be over 150MB. ● Thus, we sample these two datasets for further usage. Underlying duplicates difficult to be detected ● Geolocation dataset has underlying “duplicates” which cannot be detected by using “drop_duplicates()” function in Python, because the language might be different. ● In the reviews dataset, one review_id would link to different oder_id with different information in other columns. (composite primary key: review_id, order_id) Scattered data storage through multiple files Different languages across different files Products File Orders File Order Items File ● Information about orders, delivery, product ordered is stored in separate files.
  • 5.
    Normalization Plan: Creatingan Optimized Data Schema 1st Normal Form ● Added primary keys such as geolocation_id to Address table ● Added foreign keys such as product_category_id to Product Category table ● Dropped duplicated data such as address data from Customers/Sellers tables 2nd Normal Form ● No changes on the tables as all non-key attributes were fully dependent 3rd Normal Form ● The Orders table was split into Orders and Delivery tables
  • 6.
    Extract ETL Process: Transform Load Uploadingthe transformed data to a centralized repository in PostgreSQL database Extracting e-commerce data from multiple CSV flat files Performing data cleaning and manipulation on the extracted data via Python
  • 7.
    ETL - TransformProcess Debrief Step 1 Extract, rename, and reorder the columns Step 2 Get the relevant information for each table by merging datasets Step 3 Drop duplicated entries Step 4 Ensure that the primary key column only includes unique values and uniquely identifies each record in a table Step 5 Construct the "id" variable if necessary Step 6 If the table exists foreign keys, merge the current dataset with the dataset referred to by this key to get the intersection. Drop unnecessary columns and rename columns after merging. Step 7 Change the data type of the variable of the raw dataset to stay consistent with the column data type we designed. New Customer Table New Address Table
  • 8.
    Analytical Procedures Benefits(WHY): Customer Insights CMO: Understand customers’ demographic info, shopping behavior and product preference to make targeted marketing strategy. Identify customers’ cities distribution/ customer lifetime value/ top categories/ peak purchase time/ number of customers by year and month. Seller Insights Client Account Executive: Understand sellers’ demographic info, sales performance and product rank to inform sellers improve performance. Identify top sellers/ categories with highest growth. Financials Insights CFO: Analyze platform revenue and cost on a real-time pace to make quick decisions and identify potential performance issues. Understand order value/ monthly and annual sales. Operations Insights COO: Oversee logistics performance and react timely when significant shipment delays occurred. Monitor monthly on-time delivery rate performance. Post Purchase Service Insights Customer Service Executive: Review customer reviews metrics to ensure a high-quality closed loop service. Analyze order review scores/ customer complaints. Empower C-level executives and analysts to understand business performance from a 360 degree view
  • 9.
    Analytical Procedures Instructions(HOW): C-level executives communicate key metrics used to review each department’s performance to the analysts. Creation Vision Analysts build customized metrics for dashboard by writing queries using both python and postgreSQL on Metabase platform. Action C-level executives review the dashboard on a daily basis to oversee business performance. Once they notice an issue such as a drop in sales, they should inform analysts to perform further analysis and make data-driven decisions. Implementation Analysts should seek feedback from the executives to further improve the analytical procedure by revising the metrics. Further Considerations ● On-premises solution for sensitive and personally identifiable customer data ● Anonymization of customer data for cloud upload ● Offsite/cloud for less sensitive data and anonymized customer data
  • 10.
  • 11.
  • 12.
    References Data Sources: 1. Kaggle(Brazilian E-Commerce Public Dataset by Olist), https://www.kaggle.com/olistbr/brazilian-ecommerce/home 2. Silberschatz, A., Korth, H. F., and Sudarshan, S. (2011). Database System Concepts (6th Edition). McGraw-Hill. ISBN-13: 978-0073523323 Code - Data sampling [Link] Code - Create database & Extract, Transform, Load in Python [Link]