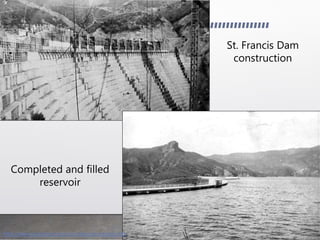
Bonab University
Civil Engineering Department
Bonab-Iran
Dam failure
Sajad Behnajad
The cause of failure may be
classified as
• hydraulic failures (for all types of dams)
• failures due to seepage
1. through foundation (all except arch dams)
2. through body of dam (embankment dam)
• failures due to stresses developed within structure
Arch dams fail instantaneously, whereas the gravity
dams take some multiples of 10minutes
The percentage distribution of
dam breaks and its attributes causes of
failure
Foundation problems 40 %
Inadequate spillway 23 %
Poor construction 12 %
Uneven settlement 10 %
High pore pressure 5 %
Acts of war 3 %
Embankment slips 2 %
Defective materials 2 %
Incorrect operations 2 %
Earthquakes 1 %
Dam failures effects
• Dam failure results in a catastrophic break followed by
a flood wave often with considerable loss of life or
property
• More than a dozen dams have failed in South
Carolina amid catastrophic flooding that has
destroyed homes and businesses and left more than
a dozen people dead
• The structures that have failed in South Carolina are
like the vast majority of dams around the world: they
are made of earth
Dam failures are most likely to
happen for one of five reasons
• Overtopping
• Foundation Defects and Slope Instability
• Cracking
• Inadequate maintenance and upkeep
• Piping
Overtopping
• caused by water spilling over the top of a dam.
Overtopping of a dam is often a precursor of dam
failure. National statistics show that overtopping due
to inadequate spillway design, debris blockage of
spillways, or settlement of the dam crest account for
approximately 34% of all U.S. dam failures
Foundation Defects and Slope
Instability
• Foundation defects, including settlement and slope
instability, cause about 30% of all dam failures
Piping
• It happens when seepage through a dam is not
properly filtered and soil particles continue to
progress and form sink holes in the dam
• 20% of U.S. dam failures have been caused by piping
(internal erosion caused by seepage).
Failure Prevention
 Failure could have been prevented if some of these
points had been observed
 Failure is a complex process
 Begins with some abnormality in behavior (not
detected)
 Consequent deteriorations (not observed)
 Further damage or disaster
• Inspection and Monitoring of dams as well as data
analysis and interpretation has a critical role in the
field of dam safety
St. Francis Dam Disaster
Geography
• Located 40 miles NE of Los Angeles
• In city of Santa Clarita
• Developing city
• Agriculture, electricity (Edison), mostly immigrants
• Inside San Francisquito Canyon
Background
• Designed by William Mulholland, Dept. of Power
and Water
• 1924 – construction began
• Originally
• Capacity: 30,000 acre-feet
• 180 ft high, 600 ft long
• 1st change
• 10ft height increase
• Capacity: 32,000 acre-feet
• 2nd change (July 1925)
• 10ft height increase
• Capacity: 38,000 acre-feet
• Wing dyke added (600ft long)
• 1926 – construction complete
William Mulholland
Completed and filled
reservoir
St. Francis Dam
construction
http://www.scvhistory.com/scvhistory/scvhistory.htm
• 1926-1928
• Cracks developing in dam and abutments
• Mulholland investigates and dismisses
• 7 March 1928
• Reservoir fills to capacity
• More leaks develop
• Mulholland investigates and dismisses
• 12 March 1928
• East side of reservoir roadbed sagging 1 – 5 feet
• More leaks and cracks
• Mulholland and assistant inspect and dismiss
Evidence of leaks
http://www.scvhistory.com/scvhistory/scvhistory.htm
• 12 March 1928 – Dam fails 11:57 pm
• 12 bill gallons of water
• 18 mi/hr initially, 5 mi/hr into Pacific
• Traveled 55 miles to the Pacific Ocean
• Took 5 ½ hrs
Dam after failure
http://www.scvhistory.com/scvhistory/scvhistory.htm
Impacts
• Deaths: 450 estimated
• Many found downstream
• Tent residents of unknown count
• +900 homes destroyed
• 1,200 buildings damaged
• 10 bridges knocked out
• Power lost in multiple cities
• Crops, businesses and livestock affected
Overturned railroad tracks
Debris and overturned cars
http://www.scvhistory.com/scvhistory/scvhistory.htm
Disaster Management
• Awareness and preparedness
• No disaster plan
• No one ever thought it would break
• Mulholland was aware of cracks/leaks and maximum capacity
• Dismissed them because said, “This is typical for a concrete dam of
this size.”
How was the community affected
• Many people lost jobs
• Edison electric power plants ruined
• Agriculture crops devastated
• Agriculture devastated
• 7,900 acres
• Citrus, walnuts, apricots, grapes, alfalfa, pecans
• Tent residents
• Lost jobs and displaced
• Rebuild homes and businesses
• Took very long for people to get back on their feet
Recommendations
• Warning system needed
• You can never be too careful, the risk of failure will always be there no matter the
confidence
• More response by police force
• Efficiency needed with system of communication
• Reservoir shouldn’t have been built there
• The geography is extremely dangerous
Sources
• http://www.scvhistory.com/scvhistory/scvhistory.htm
• http://en.wikipedia.org/wiki/San_Francisquito_Canyon
• http://web.umr.edu/~rogersda/st_francis_dam/lessons_learned
_from_the_st_francis_dam_failure(geostrata_mar-apr_2006).pdf
• http://web.umr.edu/~rogersda/st_francis_dam/reassessment_o
f_st_francis_dam_failure.pdf
• http://web.umr.edu/~rogersda/st_francis_dam/Mapping%20th
e%20St%20Francis%20Dam%20Outburst%20Flood%20with%2
0GIS.pdf
• Sharif University Presentation based on dam failure
• Outland, Charles F. Man – Made Disaster: the story of St.
Francis Dam. Glendale, California: The Arthur H. Clark
Company, 1963.
Thank You

Dam failure

  • 1.
    Bonab University Civil EngineeringDepartment Bonab-Iran Dam failure Sajad Behnajad
  • 2.
    The cause offailure may be classified as • hydraulic failures (for all types of dams) • failures due to seepage 1. through foundation (all except arch dams) 2. through body of dam (embankment dam) • failures due to stresses developed within structure Arch dams fail instantaneously, whereas the gravity dams take some multiples of 10minutes
  • 3.
    The percentage distributionof dam breaks and its attributes causes of failure Foundation problems 40 % Inadequate spillway 23 % Poor construction 12 % Uneven settlement 10 % High pore pressure 5 % Acts of war 3 % Embankment slips 2 % Defective materials 2 % Incorrect operations 2 % Earthquakes 1 %
  • 4.
    Dam failures effects •Dam failure results in a catastrophic break followed by a flood wave often with considerable loss of life or property • More than a dozen dams have failed in South Carolina amid catastrophic flooding that has destroyed homes and businesses and left more than a dozen people dead • The structures that have failed in South Carolina are like the vast majority of dams around the world: they are made of earth
  • 5.
    Dam failures aremost likely to happen for one of five reasons • Overtopping • Foundation Defects and Slope Instability • Cracking • Inadequate maintenance and upkeep • Piping
  • 6.
    Overtopping • caused bywater spilling over the top of a dam. Overtopping of a dam is often a precursor of dam failure. National statistics show that overtopping due to inadequate spillway design, debris blockage of spillways, or settlement of the dam crest account for approximately 34% of all U.S. dam failures
  • 7.
    Foundation Defects andSlope Instability • Foundation defects, including settlement and slope instability, cause about 30% of all dam failures
  • 8.
    Piping • It happenswhen seepage through a dam is not properly filtered and soil particles continue to progress and form sink holes in the dam • 20% of U.S. dam failures have been caused by piping (internal erosion caused by seepage).
  • 9.
    Failure Prevention  Failurecould have been prevented if some of these points had been observed  Failure is a complex process  Begins with some abnormality in behavior (not detected)  Consequent deteriorations (not observed)  Further damage or disaster • Inspection and Monitoring of dams as well as data analysis and interpretation has a critical role in the field of dam safety
  • 10.
  • 11.
    Geography • Located 40miles NE of Los Angeles • In city of Santa Clarita • Developing city • Agriculture, electricity (Edison), mostly immigrants • Inside San Francisquito Canyon
  • 12.
    Background • Designed byWilliam Mulholland, Dept. of Power and Water • 1924 – construction began • Originally • Capacity: 30,000 acre-feet • 180 ft high, 600 ft long • 1st change • 10ft height increase • Capacity: 32,000 acre-feet • 2nd change (July 1925) • 10ft height increase • Capacity: 38,000 acre-feet • Wing dyke added (600ft long) • 1926 – construction complete William Mulholland
  • 13.
    Completed and filled reservoir St.Francis Dam construction http://www.scvhistory.com/scvhistory/scvhistory.htm
  • 14.
    • 1926-1928 • Cracksdeveloping in dam and abutments • Mulholland investigates and dismisses • 7 March 1928 • Reservoir fills to capacity • More leaks develop • Mulholland investigates and dismisses • 12 March 1928 • East side of reservoir roadbed sagging 1 – 5 feet • More leaks and cracks • Mulholland and assistant inspect and dismiss Evidence of leaks http://www.scvhistory.com/scvhistory/scvhistory.htm
  • 15.
    • 12 March1928 – Dam fails 11:57 pm • 12 bill gallons of water • 18 mi/hr initially, 5 mi/hr into Pacific • Traveled 55 miles to the Pacific Ocean • Took 5 ½ hrs Dam after failure http://www.scvhistory.com/scvhistory/scvhistory.htm
  • 16.
    Impacts • Deaths: 450estimated • Many found downstream • Tent residents of unknown count • +900 homes destroyed • 1,200 buildings damaged • 10 bridges knocked out • Power lost in multiple cities • Crops, businesses and livestock affected
  • 17.
    Overturned railroad tracks Debrisand overturned cars http://www.scvhistory.com/scvhistory/scvhistory.htm
  • 18.
    Disaster Management • Awarenessand preparedness • No disaster plan • No one ever thought it would break • Mulholland was aware of cracks/leaks and maximum capacity • Dismissed them because said, “This is typical for a concrete dam of this size.”
  • 19.
    How was thecommunity affected • Many people lost jobs • Edison electric power plants ruined • Agriculture crops devastated • Agriculture devastated • 7,900 acres • Citrus, walnuts, apricots, grapes, alfalfa, pecans • Tent residents • Lost jobs and displaced • Rebuild homes and businesses • Took very long for people to get back on their feet
  • 20.
    Recommendations • Warning systemneeded • You can never be too careful, the risk of failure will always be there no matter the confidence • More response by police force • Efficiency needed with system of communication • Reservoir shouldn’t have been built there • The geography is extremely dangerous
  • 21.
    Sources • http://www.scvhistory.com/scvhistory/scvhistory.htm • http://en.wikipedia.org/wiki/San_Francisquito_Canyon •http://web.umr.edu/~rogersda/st_francis_dam/lessons_learned _from_the_st_francis_dam_failure(geostrata_mar-apr_2006).pdf • http://web.umr.edu/~rogersda/st_francis_dam/reassessment_o f_st_francis_dam_failure.pdf • http://web.umr.edu/~rogersda/st_francis_dam/Mapping%20th e%20St%20Francis%20Dam%20Outburst%20Flood%20with%2 0GIS.pdf • Sharif University Presentation based on dam failure • Outland, Charles F. Man – Made Disaster: the story of St. Francis Dam. Glendale, California: The Arthur H. Clark Company, 1963.
  • 22.