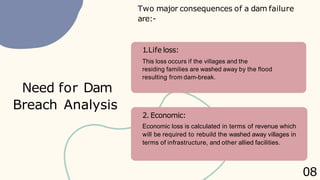
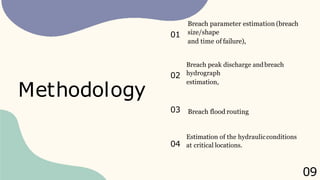
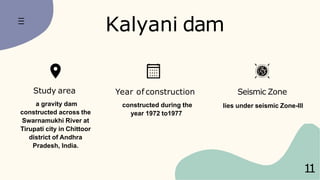
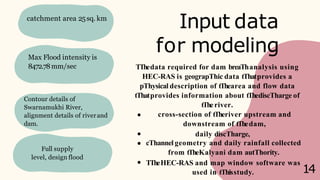
Dam Breach Analysis
Presented by
Akash Palve
Pratik Mulik
Prathamesh More
Swati Mohite
A Project on
01
Hello, classmates!
We areGroup 13!
02
Pratik
Group Leader
03
Prathamesh
Researcher
Swati
Presentation
designer
Meet theGroup
Akash
Resource Collector
material dams.
Dams are structures constructed across rivers to
serve various purposes. With the progression of
time, various types of dams were constructed
based on the location and prerequisite of society
and designs were enhanced with the advancement
of technology. The types of dam commonly found
are:-
Earthen/Rockfill dams
Concrete and Multi-arch dams
Gravity Dams
Buttress dams
Concrete, steel, timber andcomposite
Introduction
04
Abstract
TTheconstruction of Dams serve various purposes-
power generation, irrigation, flood control, etc.
WitThall tThebenefits, failure of dam structure can
cause tremendous losses by tThegeneration of
unforeseen floods in tThedownstream area.
To reduce these threats dam breach analysis
becomes necessary to predict inundation levelsand
flood-prone zones in the downstream area of the
dam.
Implementation of Dam breaThanalysis can benefit
tThepeople living downstream of tThedam against
floods witThtTheThelpof inundation maps wThicThcan be
generated by incorporation of results from dam
breaThanalysis witThGIS.
05
AIM
Our First Aim
to estimate theoutput
discharge from the
reservoir
Our SecondAim
the route of the flood
wave downstream
06
Objectives
07
Our First Objective
Determination of outflow
hydrograph and the peak
discharge.
Our SecondObjective
Estimation of dam breach
parameters using
appropriate empirical
formulae. Our Third Objective
Routing of peak discharge and
prediction of hydrograph at
different sections in downstream
up to the point ofconsideration.
Our Fourth Objective
Mapping of Inundation levels.
Two major consequences of a dam failure
are:-
1.Life loss:
This loss occurs if the villages and the
residing families are washed away by the flood
resulting from dam-break.
2. Economic:
Economic loss is calculated in terms of revenue which
will be required to rebuild the washed away villages in
terms of infrastructure, and other allied facilities.
Need for Dam
Breach Analysis
08
Methodology
Breach parameter estimation (breach
size/shape
and time of failure),
01
Breach peak discharge andbreach
hydrograph
estimation,
02
Breach flood routing
03
Estimation of the hydraulicconditions
at critical locations.
04
09
Dam break has been a theme of concern and research for a
long time.
study incorporates occurrence and proliferation of
breach with time and analysis of the subsequent flood.
extensive research has been done in the area of
prediction of breach shape and its alteration with time.
immense literature and case histories available about
dam-break modelling.
1
0
LITERATURE REVIEW
Year of construction
constructed during the
year 1972 to1977
Seismic Zone
lies under seismic Zone-III
Kalyani dam
1
1
Study area
a gravity dam
constructed across the
Swarnamukhi River at
Tirupati city in Chittoor
district of Andhra
Pradesh, India.
Design flood of the dam =1614 cumec with 25 Mm 3 as live
storage between hills which are part of Seshachalam Hill
ranges
Elevation of the area =50 to 600 m.
Has catchment area = 48.56 sq m
daily summer temperatures range = 36°C to 46 °C
The winter temperatures = 12 °C to 14 °C with an average
annual rainfall of 918.1 mm.
District receives an average annual of 438.0 mm rainfall
through the South-WestMonsoon
396.0 mm from North East Monsoon
Vegetation of thearea comprises dry deciduous mixed forest
with patches of moist deciduous forests in the valleys
1
2
S t u d y a r e a
1
3
Input data
for modeling
catchment area 25sq. km
Max Flood intensity is
8472.78mm/sec
Contour details of
Swarnamukhi River,
alignment details of riverand
dam.
Full supply
level, design flood
used in tThisstudy.
TThedata required for dam breaThanalysis using
HEC-RAS is geograpThic data tThatprovides a
pThysical description of tThearea and flow data
tThatprovides information about tThediscTharge of
tTheriver.
cross-section of tTheriver upstream and
downstream of tThedam,
daily discTharge,
cThannel geometry and daily rainfall collected
from tTheKalyani dam autThority.
TTheHEC-RAS and map window software was
14
Bhakra Nangal Dam
Study area
built on Sutlej River
Year of construction
initially started in 1984
and completed in 1963
Seismic Zone
Zone -IV
1
5
Highest straight gravity dam in India
with a height of about 207.26metersand
it runs across 168.35km
length of 518.25(1,700ft) meters and a
width of 9.1 meters (30ft)approximately
Elevation of area-226m
Temperature- 22C to 31C
Annual rainfall-786 mm
1
6
References
https://iaeme.com/MasterAdmin/Jou
rnal_uploads/IJCIET/VOLUME_9_ISS
UE_5/IJCIET_09_05_041.pdf
01
02
1
7
https://www.irjet.net/archives/V4/i
5/IRJET-V4I511.pdf

Dam Breach Analysis.pptx

  • 1.
    Dam Breach Analysis Presentedby Akash Palve Pratik Mulik Prathamesh More Swati Mohite A Project on 01
  • 2.
  • 3.
  • 4.
    material dams. Dams arestructures constructed across rivers to serve various purposes. With the progression of time, various types of dams were constructed based on the location and prerequisite of society and designs were enhanced with the advancement of technology. The types of dam commonly found are:- Earthen/Rockfill dams Concrete and Multi-arch dams Gravity Dams Buttress dams Concrete, steel, timber andcomposite Introduction 04
  • 5.
    Abstract TTheconstruction of Damsserve various purposes- power generation, irrigation, flood control, etc. WitThall tThebenefits, failure of dam structure can cause tremendous losses by tThegeneration of unforeseen floods in tThedownstream area. To reduce these threats dam breach analysis becomes necessary to predict inundation levelsand flood-prone zones in the downstream area of the dam. Implementation of Dam breaThanalysis can benefit tThepeople living downstream of tThedam against floods witThtTheThelpof inundation maps wThicThcan be generated by incorporation of results from dam breaThanalysis witThGIS. 05
  • 6.
    AIM Our First Aim toestimate theoutput discharge from the reservoir Our SecondAim the route of the flood wave downstream 06
  • 7.
    Objectives 07 Our First Objective Determinationof outflow hydrograph and the peak discharge. Our SecondObjective Estimation of dam breach parameters using appropriate empirical formulae. Our Third Objective Routing of peak discharge and prediction of hydrograph at different sections in downstream up to the point ofconsideration. Our Fourth Objective Mapping of Inundation levels.
  • 8.
    Two major consequencesof a dam failure are:- 1.Life loss: This loss occurs if the villages and the residing families are washed away by the flood resulting from dam-break. 2. Economic: Economic loss is calculated in terms of revenue which will be required to rebuild the washed away villages in terms of infrastructure, and other allied facilities. Need for Dam Breach Analysis 08
  • 9.
    Methodology Breach parameter estimation(breach size/shape and time of failure), 01 Breach peak discharge andbreach hydrograph estimation, 02 Breach flood routing 03 Estimation of the hydraulicconditions at critical locations. 04 09
  • 10.
    Dam break hasbeen a theme of concern and research for a long time. study incorporates occurrence and proliferation of breach with time and analysis of the subsequent flood. extensive research has been done in the area of prediction of breach shape and its alteration with time. immense literature and case histories available about dam-break modelling. 1 0 LITERATURE REVIEW
  • 11.
    Year of construction constructedduring the year 1972 to1977 Seismic Zone lies under seismic Zone-III Kalyani dam 1 1 Study area a gravity dam constructed across the Swarnamukhi River at Tirupati city in Chittoor district of Andhra Pradesh, India.
  • 12.
    Design flood ofthe dam =1614 cumec with 25 Mm 3 as live storage between hills which are part of Seshachalam Hill ranges Elevation of the area =50 to 600 m. Has catchment area = 48.56 sq m daily summer temperatures range = 36°C to 46 °C The winter temperatures = 12 °C to 14 °C with an average annual rainfall of 918.1 mm. District receives an average annual of 438.0 mm rainfall through the South-WestMonsoon 396.0 mm from North East Monsoon Vegetation of thearea comprises dry deciduous mixed forest with patches of moist deciduous forests in the valleys 1 2
  • 13.
    S t ud y a r e a 1 3
  • 14.
    Input data for modeling catchmentarea 25sq. km Max Flood intensity is 8472.78mm/sec Contour details of Swarnamukhi River, alignment details of riverand dam. Full supply level, design flood used in tThisstudy. TThedata required for dam breaThanalysis using HEC-RAS is geograpThic data tThatprovides a pThysical description of tThearea and flow data tThatprovides information about tThediscTharge of tTheriver. cross-section of tTheriver upstream and downstream of tThedam, daily discTharge, cThannel geometry and daily rainfall collected from tTheKalyani dam autThority. TTheHEC-RAS and map window software was 14
  • 15.
    Bhakra Nangal Dam Studyarea built on Sutlej River Year of construction initially started in 1984 and completed in 1963 Seismic Zone Zone -IV 1 5
  • 16.
    Highest straight gravitydam in India with a height of about 207.26metersand it runs across 168.35km length of 518.25(1,700ft) meters and a width of 9.1 meters (30ft)approximately Elevation of area-226m Temperature- 22C to 31C Annual rainfall-786 mm 1 6
  • 17.