International Journal of Engineering Research and Applications (IJERA) is an open access online peer reviewed international journal that publishes research and review articles in the fields of Computer Science, Neural Networks, Electrical Engineering, Software Engineering, Information Technology, Mechanical Engineering, Chemical Engineering, Plastic Engineering, Food Technology, Textile Engineering, Nano Technology & science, Power Electronics, Electronics & Communication Engineering, Computational mathematics, Image processing, Civil Engineering, Structural Engineering, Environmental Engineering, VLSI Testing & Low Power VLSI Design etc.
6th International Disaster and Risk Conference IDRC 2016 Integrative Risk Management - Towards Resilient Cities. 28 August - 01 September 2016 in Davos, Switzerland
Contoh Pekerjaan pemodelan gelombang dengan menggunakan CMS Wave yang dilakukan Coastal Inlet Research Program (CIRP)
M. Baharudin Fahmi
baharudinfahmi@gmail.com
Coastal Engineer
With speakers from various disciplines and professions, the SPE Distinguished Lecturer program focuses on the hottest trends, tools, and technology in E&P around the globe. View the complete 2018-2019 Distinguished Lecturer schedule at www.spe.org/dl/schedule.php.
Overbank Flow Condition in a River SectionIDES Editor
When the flows in natural or man made channel
sections exceed the main channel depth, the adjoining
floodplains become inundated and carry part of the river
discharge. Due to different hydraulic conditions prevailing in
the river and floodplain of a compound channel, the mean
velocity in the main channel and in the floodplain are different.
This leads to the transfer of momentum between the main
channel water and that of the floodplain making the flow
structure more complex. Results of some experiments
concerning the overbank flow distribution in a compound
channel are presented. Flow sharing in river channels is
strongly dependant on the interaction between flow in the
main channel and that in the floodplain. The influence of the
geometry on velocity and flow distribution and different
functional relationships are obtained. Dimensionless
parameters are used to form equations representing the over
bank flow sharing in the subsections. The equations agree
well with experimental discharge data and other published
data. Using the proposed method, the error between the
measured and calculated discharge distribution for the a
compound sections is found to be the minimum when compared
with that using other investigators.
1. Introduction to Computational Geotechnics
1. Numerical modeling approach
2. Idealized field conditions to numerical
modeling
3. Algorithm of numerical modeling
2. Commercial geotechnical programs
1. Programs developed by Itasca, Inc.
2. Programs developed by Plaxis
3. Programs developed by Geo-Slope
International Ltd.
4. Other products
3. Theoretical considerations
1. Numerical methods
2. Strength of material
3. Constitutive models
. Numerical modeling in FLAC
Part I
1. Introductory of modeling in FLAC
2. Grid generation
3. Geometry changes
4. Shallow foundation
Part II
5. Stone column
6. Slope stability
7. Soil nailing
8. Seismic considerations
5. Numerical modeling in Plaxis
• Shallow foundations
slope stability and seepage by slide software (Teton dam)AbdullahKhan798
Teton dam is being modeled by slide software and other improved models are shown. It is tried to get the correct data for teton dam there may be some errors
This work presents hydrodynamic characterization and comparative analysis of high speed crafts
(HSCs). HSCs performance characterizing is a serious concern to Hydrodynamicists because of the wide
variation of total resistance with hull-form, trim, draft and speed. Conversely, these parameters are not duly
analyzed during design due to inadequate theories. Therefore, this research investigates total resistance, wetted
surface and effective trim of four different HSC hull-forms. An interactive computer-program is developed based
on Savitsky and CAHI algorithms, and the results compared against test-data. The analysis correctly predicts
quantitatively the resistances of the four hull-forms at high speeds but with some discrepancies at speeds below
12 knots. The average standard-deviation for resistance predictions by CAHI = 4.69 kN and Savitsky= 6.13 KN.
Also, the results indicate that the transition from bow-wetting to full-planing occurs at 12 knots, and beyond
which the effective trim is fairly constant. Again, the wetted length-beam ratio (λm) drops rapidly from bowwetting
speeds to a plateau at speeds >12knot where hydrodynamic lift prevails. Standard-deviations of λm by
Savitsky’s and CAHI are 1.07 and 1.41, respectively. In conclusion, model-predictors are reasonably in good
agreement with measurement.
The rapid drawdown effects directly on the stability of upstream slope of earth
dams, where the seepage direction will be in the reverse direction due to emergency
emptiness, which causes flow from downstream to upstream through the dam body,
such flow may be not considered in design. In this research two cases of rapid
drawdown are adopted, in the first case, the reservoir is empty from service canal
(outlet flow) where the discharge of this canal is 200 m3/sec. In the second case, the
reservoir is empty by spillway canal with discharge capacity equal to 2750 m3/sec.
The results show that the discharge from spillway takes a few hours which threaten
the dam stability compering with allowable factor of safety while discharge from
outlet flow service takes a few days and the threaten was nominal, both of them under
rapid drawdown condition .
Taller internet + Internet como plataforma de negocioJFKSOFT CORP.
Este taller se dictara de forma presencial en Bogota, Colombia y tiene una duracion de 2 Horas y tendrá un costo de $10.000= pesos colombianos. Explica como se puede montar un negocio en internet con una minima inversion. Si desea participar envie un correo a jfksoft@yahoo.es especificando porque desea Participar,
01-Dinasol 2012 ROSTURI DE DILATARE ,STRUCTURALE, SEISMICEREDA SRL
CATALOGUL DE ROSTURI DINASOL 2012 -DINAC-FRANTA
DINAC ,membra a grupului american 3M prezinta o colectie completa de rosturi de pardoseli si pereti, fatade , terase, protectii la foc pentru rosturi
[Creategies] Gaste menos recursos e capte mais clientes para o seu escritório...creategies
O custo para a atração de um cliente novo é muito maior do que para a manutenção de um antigo. Além da gritante diferença de valores envolvidos em divulgação, consumidores já fidelizados demandam menos tempo de convencimento e de maturação de ideias.
DESIGN A HYDRAULIC STRUCTURE USING THE RAINFALL INTENSITY- DURATION- FREQUENC...IAEME Publication
A hydrologic analysis is an essential prerequisite for any project, is used to the evaluation of the watershed area for a stream and is used to determine the design discharge or the amount of runoff the culvert should be designed to convey. In this paper the relationship between the intensity duration-
and frequency of rainfall are used to obtain the value of discharge to design a pipe culvert for Najaf station in Iraq, from the relationship between Intensity-duration-frequency (IDF) curves, the values of intensity for 10, 100 years return periods with 15, 30, and 60 min. durations are obtained and discharge values are obtained from multiplied the catchment area for Najaf station by the values of intensity for obtaining.
Abstract: Geo-technical engineering as a subject has developed considerably in the past four decades. There
has been remarkable development in the fields of design, research and construction of dam. India is capable of
designing and constructing a dam that would withstand a seismic jolt. The country needs water and electricity
to provide its people good living standards. Hydropower is the solution to the country's requirements, and this
can be achieved by storing water in dams.
In the past, earthquake effects may have been treated too lightly in dam design. Are such dams safe,
and how have they fared in previous earthquakes, this Paper will be limited to the some of finding about one
concrete types.
What will happen to dams during severe earthquake shaking? It is obvious that at present engineers
cannot answer this question with any certainty. But we are very much aware of the threat of disastrous losses of
life and damage to property if dams should fail, and we are making great effort to increase our under standing
of this complex topic.
This Paper deals with the case study of totaladoh Dam Situated in Vidarbha Region of Maharashtra
for Seismic Analysis by I.S.Code method (Simple Beam Analysis method). This also includes future scope of
analyzing the same dam for Seismic safety by very accurate method i.e. finite element method.
Keywords: Earthquake, The finite element method, Indian Standard codes(I.S.Code), horizontal
seismic coefficient (αh ),Hydrostatic pressure, Seismic analysis,
This research is to analyses hydraulic parameters of the spillway design for WADI
HORAN Dam. The spillway design of type Ogee overflow and the design based on
Water Experiment Station (W.E.S) of the U.S. Corp of Engineers. The inflow are
routed in order to decrease the maximum discharge passing on the spillway. The
maximum discharge passing are 1400 m3/sec with maximum head over the crest equal
to 3.4 m and 50 m3/sec Attenuation and 2 hrs Reservoir Lag. Froude number is
determined in order to select the type of stilling basin, the Froude number equal to 5
that can choose type II stilling Basin. The method used for routing is Inflow- Storage
Discharge ( I.S.D.) The profile of the downstream and upstream are calculated.
Changes in dam break hydrodynamic modelling practice - Suter et alStephen Flood
Abstract: Today, many organisations rely on hydrodynamic modelling to assess the consequences of dam break failure on downstream populations and infrastructure. The availability of finite volume shock-capturing schemes and flexible mesh schematisations in widely used software platforms imply that dam break modelling projects will be carried out differently in the future: Finite volume based platforms allow widespread application of shock-capturing methods and flexible mesh platforms can represent features in the study area more realistically and are more flexible thanks to varying mesh resolutions. Furthermore, the recent adoption of Graphics Processing Unit (GPU) technology in mainstream scientific and engineering computing will also significantly decrease computation times at relatively low cost.
This paper examines the application of finite volume, flexible mesh and GPU technologies to dam break modelling. One-dimensional (1D) modelling results are compared to those from two-dimensional (2D) finite difference and finite volume approaches. The results demonstrate that there are differences between modelling approaches and that the computational speeds of 2D simulations can be significantly reduced by the use of GPU processors.
The Detail Project Report is an essential building block for any construction project. The DPR is to be prepared carefully and with sufficient details to ensure appraisal, approval, and subsequent implementation in a timely and efficient manner. The detailed project report gives us the clear idea about the existing site conditions and improvements needed to be accomplished. The DPR survey has been done for construction of a high level bridge on road pertaining @ km 6/2 (R&B) road to Kadapa district. The bridge crosses the river in normal crossing. It has total span of 50.80mts.This work has been executed under MNREGS scheme. The bridge has 3 vents of 6.37m effective span. The bridge is constructed across the stream to provide transportation facilities to people of Proddatur to various places of Kadapa District. This stream has an adequate discharge of 97.00 cusecs and it increases more during in rainy season. Traffic studies have been conducted on this road and the outcome was 120cvpd. The maximum flood level of this stream is 99.830.The linear water way is 18.00m. The design drawings and plans were given by MORT&H for execution of work. To calculate the discharge levels has been surveyed around 300mts both upstream and down streams. Funding for this project has been given by the government of A.P. The work has to be completed in a period of one year. The total estimate amount of the project is said to be 69.50 Lakhs.
This study was competent studied earth dams and species and its history and the factors influencing them and the other part of a study of the most important risks that affect earth dams (seepage through earth dams) and how to calculate the leak and methods of their account and types the seepage and forms of cost and what are the ways process is treated with filters.
1. INTRODUCTION TO SEEPAGE THROGH EARTH DAM
2.METHODS CALCULATION SEEPAGE THROGH EARTH
DAM
3. ENTRANCE, DISCHARGE, AND TRANSFARE
CONDITIONSOF LINE OF SEEPAGE
4.SIMULATE THE PRESSURE ON THE EARTH DAM USING SAP 2000 PROGRAM
5.DESIGN FILTER TO CONTROLED THE SPAAGE IN EARTH DAM
Experimental conceptualisation of the Flow Net system construction inside the...Dr.Costas Sachpazis
ABSTRACT
By means of a drainage and seepage tank, an experimental flow net system inside the body of a homogeneous earth embankment dam model, formed from Leighton Buzzard Silica sand, was developed and studied in this experimental research paper.
Water flow through dams is one of the basic problems for geotechnical engineers. Seepage analysis in an important factor to be considered in the proper design of many civil engineering structures. Seepage can occur in both through the structure itself as the case of earth dams and under foundations of an engineering structure. Successful seepage analysis is achieved on the proper and accurate construction of a flow net.
Amongst the various existing methods of seepage analysis, the “Finite Element Method” and the method of “Experimental Flow Nets” are the most widely used ones.
Construction of a flow net is mainly used for solving water flow problems through porous media where the geometry makes sometimes analytical solutions impractical. This method is usually used in soil mechanics, geotechnical or civil engineering as an initial check for problems of water flow under hydraulic structures like embankments or dams. As such, a grid obtained by drawing a series of equipotential lines and stream or flow lines is called a flow net. In this procedure the Laplace equation principles must be satisfied.
Hence, the construction of a flow net is an important tool in analysing two-dimensional irrotational flow problems and provides an approximate solution to the flow problem by following simple rules, as initially set out by Forchheimer, 1900, and later refined by Casagrande,1937. It can also be very useful tool even for problems with complex geometries, as proven in this experimental research paper.
The objectives of this experimental research paper are:
• To determine the position and shape of the flow line representing the uppermost free water surface inside the body of a dam by using a drainage and seepage tank,
• To conceptualise the flow lines system and to demonstrate that each flow line starts perpendicular to the upstream slope of the dam and that that slope is a boundary equipotential line,
• To construct an experimental flow net and subsequently to verify and analyse it by the FEA method,
• To calculate the rate of seepage through the dam body, and
• To summarise the calculations and experimental findings in a concise and readable format.
In order to achieve these objectives, an experimental flow net system inside the body of a homogeneous earth embankment dam model was formulated by using a drainage and seepage tank.
From the constructed flow net in the present experimental research paper, an attempt has been made to analyze, determine and present the following parameters:
The pressure drop from one side of the embankment to the other,
The seepage flow rate in each flow “channel”,
The total seepage flow rate, and
The pore pressure ratio, ru, for the embankment.
Key Trends Shaping the Future of Infrastructure.pdfCheryl Hung
Keynote at DIGIT West Expo, Glasgow on 29 May 2024.
Cheryl Hung, ochery.com
Sr Director, Infrastructure Ecosystem, Arm.
The key trends across hardware, cloud and open-source; exploring how these areas are likely to mature and develop over the short and long-term, and then considering how organisations can position themselves to adapt and thrive.
The Art of the Pitch: WordPress Relationships and SalesLaura Byrne
Clients don’t know what they don’t know. What web solutions are right for them? How does WordPress come into the picture? How do you make sure you understand scope and timeline? What do you do if sometime changes?
All these questions and more will be explored as we talk about matching clients’ needs with what your agency offers without pulling teeth or pulling your hair out. Practical tips, and strategies for successful relationship building that leads to closing the deal.
Neuro-symbolic is not enough, we need neuro-*semantic*Frank van Harmelen
Neuro-symbolic (NeSy) AI is on the rise. However, simply machine learning on just any symbolic structure is not sufficient to really harvest the gains of NeSy. These will only be gained when the symbolic structures have an actual semantics. I give an operational definition of semantics as “predictable inference”.
All of this illustrated with link prediction over knowledge graphs, but the argument is general.
State of ICS and IoT Cyber Threat Landscape Report 2024 previewPrayukth K V
The IoT and OT threat landscape report has been prepared by the Threat Research Team at Sectrio using data from Sectrio, cyber threat intelligence farming facilities spread across over 85 cities around the world. In addition, Sectrio also runs AI-based advanced threat and payload engagement facilities that serve as sinks to attract and engage sophisticated threat actors, and newer malware including new variants and latent threats that are at an earlier stage of development.
The latest edition of the OT/ICS and IoT security Threat Landscape Report 2024 also covers:
State of global ICS asset and network exposure
Sectoral targets and attacks as well as the cost of ransom
Global APT activity, AI usage, actor and tactic profiles, and implications
Rise in volumes of AI-powered cyberattacks
Major cyber events in 2024
Malware and malicious payload trends
Cyberattack types and targets
Vulnerability exploit attempts on CVEs
Attacks on counties – USA
Expansion of bot farms – how, where, and why
In-depth analysis of the cyber threat landscape across North America, South America, Europe, APAC, and the Middle East
Why are attacks on smart factories rising?
Cyber risk predictions
Axis of attacks – Europe
Systemic attacks in the Middle East
Download the full report from here:
https://sectrio.com/resources/ot-threat-landscape-reports/sectrio-releases-ot-ics-and-iot-security-threat-landscape-report-2024/
Software Delivery At the Speed of AI: Inflectra Invests In AI-Powered QualityInflectra
In this insightful webinar, Inflectra explores how artificial intelligence (AI) is transforming software development and testing. Discover how AI-powered tools are revolutionizing every stage of the software development lifecycle (SDLC), from design and prototyping to testing, deployment, and monitoring.
Learn about:
• The Future of Testing: How AI is shifting testing towards verification, analysis, and higher-level skills, while reducing repetitive tasks.
• Test Automation: How AI-powered test case generation, optimization, and self-healing tests are making testing more efficient and effective.
• Visual Testing: Explore the emerging capabilities of AI in visual testing and how it's set to revolutionize UI verification.
• Inflectra's AI Solutions: See demonstrations of Inflectra's cutting-edge AI tools like the ChatGPT plugin and Azure Open AI platform, designed to streamline your testing process.
Whether you're a developer, tester, or QA professional, this webinar will give you valuable insights into how AI is shaping the future of software delivery.
Let's dive deeper into the world of ODC! Ricardo Alves (OutSystems) will join us to tell all about the new Data Fabric. After that, Sezen de Bruijn (OutSystems) will get into the details on how to best design a sturdy architecture within ODC.
Slack (or Teams) Automation for Bonterra Impact Management (fka Social Soluti...Jeffrey Haguewood
Sidekick Solutions uses Bonterra Impact Management (fka Social Solutions Apricot) and automation solutions to integrate data for business workflows.
We believe integration and automation are essential to user experience and the promise of efficient work through technology. Automation is the critical ingredient to realizing that full vision. We develop integration products and services for Bonterra Case Management software to support the deployment of automations for a variety of use cases.
This video focuses on the notifications, alerts, and approval requests using Slack for Bonterra Impact Management. The solutions covered in this webinar can also be deployed for Microsoft Teams.
Interested in deploying notification automations for Bonterra Impact Management? Contact us at sales@sidekicksolutionsllc.com to discuss next steps.
GraphRAG is All You need? LLM & Knowledge GraphGuy Korland
Guy Korland, CEO and Co-founder of FalkorDB, will review two articles on the integration of language models with knowledge graphs.
1. Unifying Large Language Models and Knowledge Graphs: A Roadmap.
https://arxiv.org/abs/2306.08302
2. Microsoft Research's GraphRAG paper and a review paper on various uses of knowledge graphs:
https://www.microsoft.com/en-us/research/blog/graphrag-unlocking-llm-discovery-on-narrative-private-data/
Builder.ai Founder Sachin Dev Duggal's Strategic Approach to Create an Innova...Ramesh Iyer
In today's fast-changing business world, Companies that adapt and embrace new ideas often need help to keep up with the competition. However, fostering a culture of innovation takes much work. It takes vision, leadership and willingness to take risks in the right proportion. Sachin Dev Duggal, co-founder of Builder.ai, has perfected the art of this balance, creating a company culture where creativity and growth are nurtured at each stage.
GDG Cloud Southlake #33: Boule & Rebala: Effective AppSec in SDLC using Deplo...James Anderson
Effective Application Security in Software Delivery lifecycle using Deployment Firewall and DBOM
The modern software delivery process (or the CI/CD process) includes many tools, distributed teams, open-source code, and cloud platforms. Constant focus on speed to release software to market, along with the traditional slow and manual security checks has caused gaps in continuous security as an important piece in the software supply chain. Today organizations feel more susceptible to external and internal cyber threats due to the vast attack surface in their applications supply chain and the lack of end-to-end governance and risk management.
The software team must secure its software delivery process to avoid vulnerability and security breaches. This needs to be achieved with existing tool chains and without extensive rework of the delivery processes. This talk will present strategies and techniques for providing visibility into the true risk of the existing vulnerabilities, preventing the introduction of security issues in the software, resolving vulnerabilities in production environments quickly, and capturing the deployment bill of materials (DBOM).
Speakers:
Bob Boule
Robert Boule is a technology enthusiast with PASSION for technology and making things work along with a knack for helping others understand how things work. He comes with around 20 years of solution engineering experience in application security, software continuous delivery, and SaaS platforms. He is known for his dynamic presentations in CI/CD and application security integrated in software delivery lifecycle.
Gopinath Rebala
Gopinath Rebala is the CTO of OpsMx, where he has overall responsibility for the machine learning and data processing architectures for Secure Software Delivery. Gopi also has a strong connection with our customers, leading design and architecture for strategic implementations. Gopi is a frequent speaker and well-known leader in continuous delivery and integrating security into software delivery.
UiPath Test Automation using UiPath Test Suite series, part 4DianaGray10
Welcome to UiPath Test Automation using UiPath Test Suite series part 4. In this session, we will cover Test Manager overview along with SAP heatmap.
The UiPath Test Manager overview with SAP heatmap webinar offers a concise yet comprehensive exploration of the role of a Test Manager within SAP environments, coupled with the utilization of heatmaps for effective testing strategies.
Participants will gain insights into the responsibilities, challenges, and best practices associated with test management in SAP projects. Additionally, the webinar delves into the significance of heatmaps as a visual aid for identifying testing priorities, areas of risk, and resource allocation within SAP landscapes. Through this session, attendees can expect to enhance their understanding of test management principles while learning practical approaches to optimize testing processes in SAP environments using heatmap visualization techniques
What will you get from this session?
1. Insights into SAP testing best practices
2. Heatmap utilization for testing
3. Optimization of testing processes
4. Demo
Topics covered:
Execution from the test manager
Orchestrator execution result
Defect reporting
SAP heatmap example with demo
Speaker:
Deepak Rai, Automation Practice Lead, Boundaryless Group and UiPath MVP
Connector Corner: Automate dynamic content and events by pushing a buttonDianaGray10
Here is something new! In our next Connector Corner webinar, we will demonstrate how you can use a single workflow to:
Create a campaign using Mailchimp with merge tags/fields
Send an interactive Slack channel message (using buttons)
Have the message received by managers and peers along with a test email for review
But there’s more:
In a second workflow supporting the same use case, you’ll see:
Your campaign sent to target colleagues for approval
If the “Approve” button is clicked, a Jira/Zendesk ticket is created for the marketing design team
But—if the “Reject” button is pushed, colleagues will be alerted via Slack message
Join us to learn more about this new, human-in-the-loop capability, brought to you by Integration Service connectors.
And...
Speakers:
Akshay Agnihotri, Product Manager
Charlie Greenberg, Host
From Daily Decisions to Bottom Line: Connecting Product Work to Revenue by VP...
T4501109116
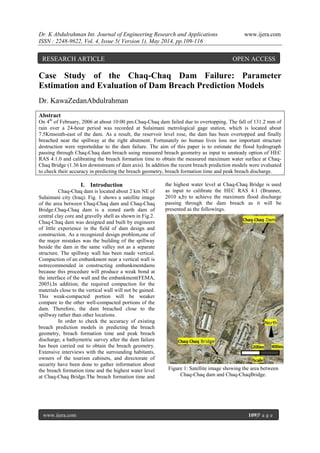
1. Dr. K Abdulrahman Int. Journal of Engineering Research and Applications www.ijera.com
ISSN : 2248-9622, Vol. 4, Issue 5( Version 1), May 2014, pp.109-116
www.ijera.com 109|P a g e
Case Study of the Chaq-Chaq Dam Failure: Parameter
Estimation and Evaluation of Dam Breach Prediction Models
Dr. KawaZedanAbdulrahman
Abstract
On 4th
of February, 2006 at about 10:00 pm.Chaq-Chaq dam failed due to overtopping. The fall of 131.2 mm of
rain over a 24-hour period was recorded at Sulaimani metrological gage station, which is located about
7.5Kmsouth-east of the dam. As a result, the reservoir level rose, the dam has been overtopped and finally
breached near the spillway at the right abutment. Fortunately no human lives loss nor important structure
destruction were reporteddue to the dam failure. The aim of this paper is to estimate the flood hydrograph
passing through Chaq-Chaq dam breach using measured breach geometry as input to unsteady option of HEC
RAS 4.1.0 and calibrating the breach formation time to obtain the measured maximum water surface at Chaq-
Chaq Bridge (1.36 km downstream of dam axis). In addition the recent breach prediction models were evaluated
to check their accuracy in predicting the breach geometry, breach formation time and peak breach discharge.
I. Introduction
Chaq-Chaq dam is located about 2 km NE of
Sulaimani city (Iraq). Fig. 1 shows a satellite image
of the area between Chaq-Chaq dam and Chaq-Chaq
Bridge.Chaq-Chaq dam is a zoned earth dam of
central clay core and gravelly shell as shown in Fig.2.
Chaq-Chaq dam was designed and built by engineers
of little experience in the field of dam design and
construction. As a recognized design problem,one of
the major mistakes was the building of the spillway
beside the dam in the same valley not as a separate
structure. The spillway wall has been made vertical.
Compaction of an embankment near a vertical wall is
notrecommended in constructing embankmentdams
because this procedure will produce a weak bond at
the interface of the wall and the embankment(FEMA,
2005).In addition; the required compaction for the
materials close to the vertical wall will not be gained.
This weak-compacted portion will be weaker
compare to the other well-compacted portions of the
dam. Therefore, the dam breached close to the
spillway rather than other locations.
In order to check the accuracy of existing
breach prediction models in predicting the breach
geometry, breach formation time and peak breach
discharge; a bathymetric survey after the dam failure
has been carried out to obtain the breach geometry.
Extensive interviews with the surrounding habitants,
owners of the tourism cabinets, and directorate of
security have been done to gather information about
the breach formation time and the highest water level
at Chaq-Chaq Bridge.The breach formation time and
the highest water level at Chaq-Chaq Bridge is used
as input to calibrate the HEC RAS 4.1 (Brunner,
2010 a,b) to achieve the maximum flood discharge
passing through the dam breach as it will be
presented as the followings.
Figure 1: Satellite image showing the area between
Chaq-Chaq dam and Chaq-ChaqBridge.
RESEARCH ARTICLE OPEN ACCESS
2. Dr. K Abdulrahman Int. Journal of Engineering Research and Applications www.ijera.com
ISSN : 2248-9622, Vol. 4, Issue 5( Version 1), May 2014, pp.109-116
www.ijera.com 110|P a g e
Figure 2: Photo of Chaq- Chaq dam after failure.
II. Breach GeometryData
Bathymetric survey has been carried out to obtain the breach geometries;Table 1 shows the geometry
parameters of Chaq-Chaq dam and its breach.
Table 1: Geometry parameters of Chaq-Chaq dam.
Parameter Height
of dam
H (m)
Top
width
(m)
Upstream
slope (v:h)
Downstream
slope (v:h)
Breach
Bottom
width
(m)
Breach
Average
width
(m)
Breach
Top
width
(m)
Dam
crest
level
(masl)
Value 14.5 9 1:3 1:2 29.6 38 46 780
III. Breach hydraulic data
Due to insufficient spillway capacity Chaq-
Chaq dam was overtopped and then failed. According
to a local witness (who was the formal responsible of
the dam and his house was located about 100 m far
from the dam) the maximum depth of water above
the dam crest was between 0.5 − 0.6 m. So, he was
also estimated the breach formation time to be
between 1 to 1.5 hours. In addition the maximum
water level due to the dam failure flood at Chaq-Chaq
bridge which is located about 1.36 km downstream of
the dam has been decided based on eyewitness
accounts. The maximum water level at the bridge was
around 759.4-759.5maslas corresponded to 20-30 cm
below the lower cord of the bridge. There was a
security team at the bridge to prevent peoples from
passing the bridge because there was a potential of
bridge failure due to the flood before and during the
dam failure. The flood extent at the bridge was seen
by the security team. Table 2 shows some of the
hydraulic parameters of Chaq-Chaq dam and Chaq-
Chaq Bridge.
Table 2: Hydraulic parameters of the Chaq-Chaq dam and bridge.
Para
meter
Depth
of
overt
oppin
g (m)
Breach
formati
on
time
(hr)
Reservoir
storage at
NPL El.
777.5
MCM
Reservoir
storage at
El. 780.0
MCM
Reservoir
storage at
El. 780.6
MCM
Spillway
length
(m)
Spillwa
y crest
level
(masl)
Minimum
stream bed
level at the
bridge
(masl)
High
cord
level
of the
bridge
(masl)
low
cord
level
of the
bridge
(masl)
Maxim
um
water
level
at the
bridge
(masl)
Value 0.6 1-1.5 1.4 2.344 2.55 15 777.5 754.4 761 759.7 759.6
Flow
Direction
Spillway Dam BodyCore
Shell
3. Dr. K Abdulrahman Int. Journal of Engineering Research and Applications www.ijera.com
ISSN : 2248-9622, Vol. 4, Issue 5( Version 1), May 2014, pp.109-116
www.ijera.com 111|P a g e
IV. Upstream and downstream cross
sections data
One-dimensional dam breach hydraulic
modelof HEC-RAS is used frequentlyto predict the
flood inundation area due to a dam breachflood
through the downstream valley. It was found
thatHEC-RAS performed well, with relatively good
agreement between predicted and measured water
levels(Yochum etal.,2008) and(Gee, 2010).
HEC-RAS modeling system is a public
domain model developed by the US Army Corp of
Engineers (Brunner, 2010 a,b). It performs one-
dimensional (1D) steady and unsteady flow
simulations on a full network of natural or man-made
open channels. Additionally, it has the ability to
model storage areas and dam break problems as well
as bridges and culverts hydraulics.
In order to model the flooding in the stream
valley using HEC‐RAS; cross sections data are
required. In this study a topographic map of 1m
interval is obtained in AutoCAD format from the
municipality of Sulaimanya.Then, the river reach in
the Chaq-Chaq system extending over a length of
4.15 km from upstream end of the reservoir to the
downstream portion of the damis considered for
analysis.
The cross sections data of the river reach
aredeveloped by AutoCAD Civil 3D 2013, by using
this software the main channel as well as right and
left overbank have beennoted and coded in the
hydraulic model. A number of 21 cross sections at
the upstream of the dam are used to model the
reservoir area and19 cross sections were developed at
the downstream portion. Extra cross sections were
added by interpolation at a maximum distance of 75
m.
The values of Manning’s roughness
coefficient were entered directly into the cross
section editor to describe the channel and overbanks.
These values were determined by visual inspection
and satellite imagesbased on guidance fromChow
(1959). The Manning’s roughness coefficient values
were set at 0.028 for main channel and the two
overbanks. These values have been assumed because
the stream reach under study is clean with stones and
high flow stages are expected during the dam break
analysis (Parhi etal, 2012).
V. HEC-RAS Model
The unsteady option of HEC-RASrequires
the breach geometry and breach formation time as
input in order to model a dam breach flood.The
breach geometry is readily available from the
bathymetric survey but breach formation time is still
a matter of uncertainty (1-1.5 hrs).
Breach formation time is the most sensitive
parameter in developing a hydraulic model for dam
break problems and breach hydrograph development.
Therefore, in this study it is attempted to calibrate the
breach formation time through simulation of breach
flood using HEC-RAS 4.1 unsteady model. For
calibration of Breach formation time value; the
observedWSE at the downstream bridge has been
considered.
A weir coefficient of 1.1 was used in this
analysis; the trigger time of breach is set such that it
corresponds to the time of peak of a developed inflow
hydrograph as it will be explained in the next
paragraph. At that time the water surface elevation
was equal to 780.57 m which is close to the observed
water surface elevation ( 780.5 − 780.6 m). This
equality in the simulated and the observed WSE
proves that the developed inflow hydrograph is
accurate and that there was under-estimate for the
inflow hydrograph in the design of Chaq-Chaq Dam.
VI. Boundary conditions
The upstream boundary condition is
modeled using the flood hydrograph corresponding to
the measured 131.2 mm rainfall depth during 24 hrs
on a 151 𝑘𝑚2
of catchment area. The flood
hydrograph is developed from contributing
catchments using NRCSunit hydrograph (UH)
method. The NRCS dimensionless UH is a synthetic
unit hydrograph in which the discharge is expressed
by the ratio of discharge to peak discharge and the
time by the ratio of time to the time of rise of the unit
hydrograph(Chow etal., 1988). Fig.3 shows the
developed inflow flood hydrograph. Details on how
to develop flood hydrograph using NRCS UH can be
found in McCuin (2005).
The downstream boundary condition is set
to normal depth and an approximate water surface
slope is assumed for the friction slope.
4. Dr. K Abdulrahman Int. Journal of Engineering Research and Applications www.ijera.com
ISSN : 2248-9622, Vol. 4, Issue 5( Version 1), May 2014, pp.109-116
www.ijera.com 112|P a g e
Figure 3: Inflow flood hydrograph.
VII. Initial conditions
The WSE upstream of the dam is set to 780
m which is the crest elevation of the dam; while WSE
at the downstream reach is set such that 2 m depth of
water is existing.
VIII. Hydraulic model result
Using of surveyed dam breach geometry
combined with standard approaches for developing
the upstream hydrograph boundary conditiona HEC
RAS model was developed to generate different
breach hydrograph corresponding to different breach
formation times, namely 1.25 hrs, 1.50hrsand
1.60hrs.Fig. 4 provides a plot of modeled water
surface profiles at different times of the simulation
and Fig. 5 shows the outflow flood hydrograph
through the dam breach.
Each hydrograph was routed through the
downstream reach to produce different water surface
elevations at the downstream bridge; the results of
the model at the bridge location are shown in Table 3.
The percentage of errorsbetween the predicted water
surface elevation and theobservedwater surface
elevation at the downstream bridge are depicted in
the Table 4.
Figure 4: water surface profiles at different times of simulation corresponding to 1.6 hrsof breach formation
time.
0.00
20.00
40.00
60.00
80.00
100.00
120.00
140.00
160.00
180.00
200.00
0 10 20 30 40 50 60 70 80 90
Flood(m3/sec)
Time (hrs)
0 1000 2000 3000 4000
750
760
770
780
Main Channel Distance (m)
Elevation(m)
Legend
WS 04FEB2006 2340
WS 04FEB2006 2200
Ground
Bridgesection
DamAxis
FirstSectionatupstream
Chaq Chaq Ch1
5. Dr. K Abdulrahman Int. Journal of Engineering Research and Applications www.ijera.com
ISSN : 2248-9622, Vol. 4, Issue 5( Version 1), May 2014, pp.109-116
www.ijera.com 113|P a g e
Figure 5: Outflow flood hydrograph due to Chaq-Chaq dam breach.
Table 3: Results of the model at the bridge location at different breach formation time.
Breach
formati
on time
(hr)
River
Sta
Time
of peak
(hrs)
Q
Total
(𝒎 𝟑
/s
)
Min
Ch
El
(m)
W.S.
Elev
(m)
Crit
W.S.
(m)
E.G.
Elev
(m)
E.G.
Slope
(m)
VelC
hnl.
(m/s)
Flow
Area
(𝒎 𝟐
)
Top
Width
(m)
Froud
e #
Chl
1.25
Just
upstrea
m of
bridge
4FEB200
62325
929.5 754.4 760.60 758.4 760.8
0.0005
17
2.37 492.4 287.2 0.32
1.5
Just
upstrea
m of
bridge
04FEB20
06 2335
919.1 754.4 759.92 758.4 760.2
0.0009
71
2.94 392.1 208.1 0.43
1.6
Just
upstrea
m of
bridge
04FEB20
06 2340
915 754.4 759.55 758.4 760
0.0012
81
3.24 352.9 165.3 0.48
Table 4: Departures of estimated and observed water surface elevations at Chaq-Chaq Bridge corresponding to
different BFT.
Breach formation time
(hr)
Estimated WSE at
Chaq-Chaq bridge
using HEC RAS (m)
ObservedWSE at Chaq-
Chaq bridge (m)
Difference between
estimated and measured
WSE (m)
1.25 760.60 759.50 1.10
1.5 759.92 759.50 0.42
1.6 759.55 759.50 0.05
A comparison of the predictedWSE with the
observed WSE at the bridge indicates that a breach
formation time of 1.60 hrs may be considered the
most accurate value, with a differenceof 0.05 m in
WSE.The modeling indicates a peak breach flood
discharge of979.2 m3
s and this value attenuates at
the bridge to 915.4 m3
s.
IX. Existing Empirical Breach Prediction
Models
Simulation of dam breach floods is essential
to characterize and identify hazards due to
hypothetical dam failures. Hydraulic modelssuch as
HEC-RASare often used for the analysis of
downstream impacts resulting from potential
damfailures. Estimation of the dam breach
parameters, such as formation time, width and side
slopes,has usually done external to the hydraulic
model. If input breach parameters cannot be
predicted with sufficient accuracy, more conservative
parameters and associated increased costs may be
1200 1800 2400 0600
04Feb2006 05Feb2006
0
200
400
600
800
1000
1200
Plan: 1.1 weir 1.5 River: Chaq Chaq Reach: Ch1 RS: 19.5
Time
Flow(m3/s)
Legend
Flow
Beginning of
dam failure
@time of 2200
Peak outflow@
time of 2340
6. Dr. K Abdulrahman Int. Journal of Engineering Research and Applications www.ijera.com
ISSN : 2248-9622, Vol. 4, Issue 5( Version 1), May 2014, pp.109-116
www.ijera.com 114|P a g e
required (Wahl, 1997).This paper aims to check the
reliability of the existing breach prediction
methodologies in estimating the breach parameters of
Chaq-Chaq dam.
Four important breach parameters
namelytop width, average width, breach formation
time and peak discharge pass through the beach are
estimated by thefollowing breach prediction models
Froehlich (1995, 2008), Xu and Zhang (2009) and
Pierce etal. (2010)and the results are compared to the
measured values (breach geometries) and HEC-RAS
output values (breach formation time and peak
discharge).
Froehlich (1995) model was selected based
on the results obtained by(Wahl, 2004) which
showed that this model is more accurate than other
existing prediction models up to the time the paper
was published.Froehlich (1995) as cited in (Wahl,
2004), developed the following formulas based on
75, 34 and 31 case studies for Bavg , Tf and Qp ;
respectively:
Bavg =0.1803× ko × Vw
0.32
× Hb
0.19
… … … … … … … … … … . . … … … … … … … (1)
Tf = 0.00254 × Vw
0.53
× Hb
−0.9
… … … … … … … … … … . . … … … … … … … … … (2)
Qp = 0.607Vw
0.295
Hw
1.24
… … … … … … … … … … … . … … … … … … … … … … . . (3)
Where Ko = constant = 1.4 if there is overtopping and 1.0 if else, Z=1.4 if there is overtopping, otherwise
Z=1.0, Vw = volume of reservoir at the time of failure, hb =height of breach, Bavg = average width, Tf =
breach formation time and Qp = peak discharge.
Froehlich (2008) developed the following formulas based on 74, 23 case studies for Bavg , and tf; respectively:
Bavg = 0.27Ko Vw
0.32
Hb
0.04
… … … … … . . … … … … … … . … … … . . … … … … . . (4)
Tf = 0.0175
Vw
gHb
2 … … … … … … … … … … … … … … … . … … … … … … … … . (5)
Where Ko = constant = 1.3 if there is overtopping and 1.0 if else, Z=1.0 if there is overtopping, if not Z=0.7.
Xu and Zhang (2009) proved that his model is more accurate than other models. This model was developed
using 182 case studies to estimateBt,Bavg , Tf and Qp; respectively:
Bt
Hb
= 1.062
Hd
Hr
0.092
Vw
1
3
Hw
0.508
eB1 … … … … … … … … … … … … … … … … . (6)
With Bt = top width of the breach, Hd = dam height, Hr = 15m , Hw = height of water at the time of
failure,B1 = b3 + b4 + b5, in which b3 = 0.061, 0.088, and −0.089 for dams with core-walls, concrete faced
dams, and homogeneous or zoned-fill dams, b4 = 0.299 and −0.239 for overtopping and seepage erosion or
piping, b5 = 0.411, −0.062, and−0.289 for high, medium, and low dam erodibility
Bave
Hb
= 0.787
Hd
Hr
0.133
Vw
1
3
Hw
0.652
eB2 … … … … … . … … … … … … … … … . (7)
with B2 = b3 + b4 + b5, in which b3 = −0.041, 0.026, and − 0.226 for dams with core-walls, concrete faced
dams, and homogeneous or zoned-fill dams, respectively, 𝑏4 = 0.149 𝑎𝑛𝑑 − 0.389 for overtopping and seepage
erosion/piping, respectively, 𝑏5 = 0.291, −0.14, and − 0.391 for high, medium, and low dam erodibility,
respectively
Tf
Tr
= 0.304
Hd
Hr
0.707
Vw
1
3
Hw
1.228
eB3 … … … … … … … … … … … … . … … … . (8)
withTr = 1 hr., B3 = b3 + b4 + b5 , in which b3 = −0.327, −0.674, and − 0.189 for dams with core-walls,
concrete faced dams, and homogeneous/ zoned-fill dams, respectively, b4 = −0.579 and − 0.611 for
overtopping and seepage erosion/piping, respectively, b5=−1.205, −0.564, and 0.579 for high, medium, and low
dam erodibility, respectively.
Qp
gVw
5/3
= 0.175
Hd
Hr
0.199
Vw
1
3
Hw
−1.274
eB4 … … … … . … … … … … . … … … (9)
withB4 = b3 + b4 + b5, in which b3 = −0.503, −0.591, and − 0.649 for dams with core-walls, concrete faced
dams, and homogeneous or zoned-fill dams, respectively, b4 = −0.705 and − 1.039 for overtopping and
7. Dr. K Abdulrahman Int. Journal of Engineering Research and Applications www.ijera.com
ISSN : 2248-9622, Vol. 4, Issue 5( Version 1), May 2014, pp.109-116
www.ijera.com 115|P a g e
seepage erosion/piping, respectively, b5 = −0.007, −0.375, and − 1.362 for high, medium, and low dam
erodibility, respectively.
Pierce (2010) showed that his developed multiple-regression model using 87 case studies is more accurate than
the Froehlich (1995) in predicting peak-discharge through an embankment dam breach.
Qp = 0.038Vw
0.475
Hd
1.09
… … … … … … … … … … … … … … … . . . … … … … … (10)
X. Comparison with considered empirical breach prediction models
Applying the above equations to Chaq-Chaq dam failure yields the results shown in Table 5.
Table 5: Results of empirical models applied to Chaq-Chaq dam failure.
Breach
parameter
Observed
value
HEC RAS
Prediction
Froehlich
(1995)
Prediction
Froehlich
(2008)
Prediction
Xu and
Zhang(2009)
𝐏𝐫𝐞𝐝𝐢𝐜𝐭𝐢𝐨𝐧 𝐛
Pierce
(2010)
𝑩𝒕 (m) 46 N.A. 57.25 𝑎
51 𝑎 54.5 N.A.
𝑩 𝒂𝒗𝒆 (m) 38 N.A. 47.1 43.8 38.4 N.A.
𝑻 𝒇 (hr) 1-1.5 1.6 0.57 0.62 1.17 N.A.
𝑸 𝒑 (
𝒎 𝟑
𝑺
) N.A. 979.2 1364 N.A. 1274 809
Side slope
Z
1.13 N.A. 1.4 1 N.A. N.A.
a. Obtained by using values of Z and 𝐵𝑎𝑣𝑒
b. Medium dam erodibility is assumed.
Table 6: Percentage of errors between predicted and measured values.
Breach
parameter
Froehlich
(1995)
Prediction
Froehlich (2008)
Prediction
Xu and Zhang
(2009)
Prediction
Pierce
(2010)
Prediction
𝑩𝒕 (m) 24 10.8 18.5 N.A.
𝑩 𝒂𝒗𝒆 (m) 23.9 15.2 1.0 N.A.
𝑻 𝒇 (hr)* -64.4 -61.2 -26.8 N.A.
𝑸 𝒑 (
𝒎 𝟑
𝑺
)* 39.2 N.A. 30.1 -17.3
*HEC RAS results are considered as measured values
Generally, all the models over-predict the
breach top width andthe averagewidth.This trend of
the models to over-predict the breach size may be
attributed to the fact that they are developed based on
the assumption of breach forms in a shape of
trapezoid, while Chaq-Chaq breach has a vertical side
near the spillway which may be considered as an odd
case. However,Xu and Zhang (2009) predicts the
average breach width more accurate than others,
where the percentage of the error between the
predicted and the measured values is 1% as shown in
table (6). While the predicted breach top width using
Froehlich (2008) appears to be better than others with
an error of 10.8% and Xu and Zhang comes in the
second order with an error of 18.5%.
All the used models under-predict the breach
formation time, includingXu and Zhang (2009) who
was the best where it gives an error of -26.8%.
Froehlich (1995 and 2008) errors are -65.4% and -
62.4%; respectively.
The predictedpeak flood discharge using the
considered empirical models shows that most of these
equations tend to over-predictthe value of this
parameter; except Pierce (2010) which yields a value
lower than that indicated by HEC RAS model. Pierce
(2010)yieldsapeak flood discharge with an error of -
17.3%, Xu and Zhang (2009)estimates the peak
discharge with an error of 30.1% andFroehlich
(1995)estimates the peak discharge with an error of
39.2%.
XI. Conclusions
Simulation of dam breach floods is essential
to characterize and identify hazards due to
hypothetical dam failures. Hydraulic models such as
HEC-RAS are often used for the analysis of
downstream impacts resulting from potential dam
failures. Estimation of the dam breach parameters,
such as formation time, width and side slopes, has
usually done external to the hydraulic model.
8. Dr. K Abdulrahman Int. Journal of Engineering Research and Applications www.ijera.com
ISSN : 2248-9622, Vol. 4, Issue 5( Version 1), May 2014, pp.109-116
www.ijera.com 116|P a g e
Due to uncertainty in determining the exact
value of the breach formation time; different values
of breach formation time have been coded into the
HEC RAS 4.1 to calibrate its valueby using the
observed highest water level at Chaq-Chaq Bridge.In
this context a breach formation time of 1.6 hrs was
achieved. Themaximum flood discharge passing
through the dam breach for the corresponding breach
formation time was 979.2 𝑚3
𝑠for the corresponding
breach formation times.
The most competitive and recent breach
prediction models were examined to determine the
most accurate onein predicting the breach
parameters.In this context; Xu and Zhang (2009)
performs better than other in predicting the average
breach width and the breach formation time.
Froehlich (2008) predicts the top breach width more
accurate than other models andXu and Zhang(2009)
is in the second order. The peak flood discharge
passing the breach of the dam is under-estimated by
pierce (2010) with an error of 17.3%, while Xu and
Zhang (2009) over-estimates the peak discharge with
an error of 30.1%.
As a conclusion Xu and Zhang (2009) can
be considered as the most accurate breach prediction
model because it was the best in predicting the breach
width and the breach formation time.
XII. Acknowledgments
The writer acknowledges the support from
the municipality of Sulaimani especially the GIS
department (Shahlaa A. F., Azad A. H., and
Mohammed H.). Thanks also go to Dr. RizgarS. and
Dr. NihadB.for their valuable notations.
Bibliography
[1] Pierce M. W.; Thornton C. I.; Abt S. R.
(2010). Predicting Peak Outflow from
Breached Embankment Dams. Journal of
Hydrologic Engineering, 15(5), 339-349.
[2] Atallah, T. A. (2002). A review on dams and
breach parameters estimation. Virginia:
MSc. Thesis .
[3] Brunner, G. W. (2010 a). HEC-RAS river
analysis system. User’s Manual, version4.1,
Hydrologic Engineering Center. Institute for
Water Resources, U. S. Army Corps of
Engineers, Davis, Calif.
[4] Brunner, G. W. (2010 b). HEC-RAS river
analysis system. Hydraulic Refference
Manual version 4.1, Hydrologic Engineering
Center. Institute for Water Resources, U.S.
Army Corps of Engineers, Davis, Calif.
[5] Chow, V. T. (1959). Open channel
hydraulics. New York: McGraw-Hill Book
Company.
[6] Chow, V. T., Maidment, D. R., Mays, L. W.
(1988). Applied hydrology. McGRAW-
HILL.
[7] FEMA. (2005). Conduits through
embankment dams. Federal Emergency
Management Agency.
[8] Froehlich, D. C. (2008). Embankment dam
breach parameters and their uncertainties.
Journal of Hydraulic Engineering, 134(12),
1708-1721.
[9] Gee, D. M. (2010). Dam breach modeling
with HEC-RAS using embankment erosion
process models. World Environmental and
Water Resources Congress (pp. 1347-1356).
Davis: ASCE.
[10] McCuin, R. H. (2005). Hydrologic analysis
and design. New Jersey: Pearson.
[11] Parhi, P. K., Sankhua, R. N., Roy, G. P.
(2012). Calibration of Channel Roughness
for Mahanadi River, (India) Using HEC-
RAS Model. Journal of Water Resource and
Protection, 4, 847-850.
[12] Wahl, T. L. (2004). Uncertainty of
predictions of embankment dam. Journal of
Hydraulic Engineering, 130(5), 389-397.
[13] Xu, Y., Zhang, L. M. . (2009). Breaching
parameters for earth and rockfill dams.
Journal of Geotechnical and
Geoenvironmental Engineering, 135(12),
1957-1970.
[14] Yochum, S. E., Goertz L. A., Jones, P. H.
(2008). Case study of the Big Bay dam
failure: accuracy and comparison of breach
predictions. Journal of Hydraulic
Engineering, 134(9), 1285-1293.