More Related Content
Similar to Daily livestock report nov 2 2012 (8)
More from joseleorcasita (20)
Daily livestock report nov 2 2012
- 1. Vol. 10, No. 213 / November 2, 2012
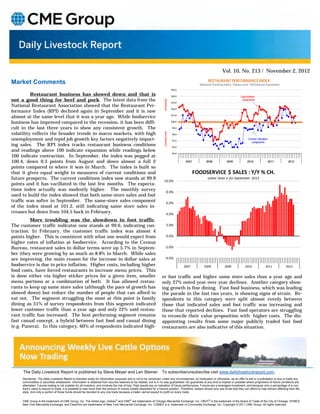
Market Comments RESTAURANT PERFORMANCE INDEX
National Tracking Index. Values over 100 Indicate Expansion
105.0
Restaurant business has slowed down and that is 104.0 Expectations
not a good thing for beef and pork. The latest data from the component
EXPANSION
103.0
National Restaurant Association showed that the Restaurant Per-
102.0
formance Index (RPI) declined again in September and it is now
almost at the same level that it was a year ago. While foodservice 101.0
business has improved compared to the recession, it has been diffi- 100.0
cult in the last three years to show any consistent growth. The 99.0
volatility reflects the broader trends in macro markets, with high
CONTRACTION
98.0
unemployment and tepid job growth key factors negatively impact- 97.0
Current situation
component
ing sales. The RPI index tracks restaurant business conditions 96.0
and readings above 100 indicate expansion while readings below
95.0
100 indicate contraction. In September, the index was pegged at
100.4, down 0.3 points from August and down almost a full 2 2007 2008 2009 2010 2011 2012
points compared to where it was in March. The index is built so
that it gives equal weight to measures of current conditions and FOODSERVICE $ SALES : Y/Y % CH.
future prospects. The current conditions index now stands at 99.9 Latest Data is for September 2012
10.0%
points and it has vacillated in the last few months. The expecta-
tions index actually was modestly higher. The monthly survey 8.0%
used to build the index showed that both same-store sales and foot
traffic was softer in September. The same-store sales component 6.0%
of the index stood at 101.2, still indicating same store sales in-
creases but down from 104.5 back in February. 4.0%
More troubling was the slowdown in foot traffic.
The customer traffic indicator now stands at 99.6, indicating con- 2.0%
traction. In February, the customer traffic index was almost 4
points higher. This is consistent with what one would expect from 0.0%
higher rates of inflation at foodservice. According to the Census
Bureau, restaurant sales in dollar terms were up 5.7% in Septem- ‐2.0%
ber (they were growing by as much as 8.8% in March. While sales
are improving, the main reason for the increase in dollar sales at ‐4.0%
foodservice is due to price inflation. Higher costs, including higher 2007 2008 2009 2010 2011 2012
food costs, have forced restaurants to increase menu prices. This
is done either via higher sticker prices for a given item, smaller er foot traffic and higher same store sales than a year ago and
menu portions or a combination of both. It has allowed restau- only 27% noted year over year declines. Another category show-
rants to keep up same store sales (although the pace of growth has ing growth is fine dining. Fast food business, which was leading
slowed down) but reduce the number of people that can afford to the parade in the last two years, is showing signs of strain. Re-
eat out. The segment struggling the most at this point is family spondents in this category were split almost evenly between
dining as 51% of survey respondents from this segment indicated those that indicated sales and foot traffic was increasing and
lower customer traffic than a year ago and only 22% said restau- those that reported declines. Fast food operators are struggling
rant traffic has increased. The best performing segment remains to reconcile their value proposition with higher costs. The dis-
fast casual concept, a hybrid between fast food and casual dining appointing results from some major publicly traded fast food
(e.g. Panera). In this category, 60% of respondents indicated high- restaurants are also indicative of this situation.
The Daily Livestock Report is published by Steve Meyer and Len Steiner. To subscribe/unsubscribe visit www.dailylivestockreport.com.
Disclaimer: The Daily Livestock Report is intended solely for information purposes and is not to be construed, under any circumstances, by implication or otherwise, as an offer to sell or a solicitation to buy or trade any
commodities or securities whatsoever. Information is obtained from sources believed to be reliable, but is in no way guaranteed. No guarantee of any kind is implied or possible where projections of future conditions are
attempted. Futures trading is not suitable for all investors, and involves the risk of loss. Past results are no indication of future performance. Futures are a leveraged investment, and because only a percentage of a con-
tract’s value is require to trade, it is possible to lose more than the amount of money initially deposited for a futures position. Therefore, traders should only use funds that they can afford to lose without affecting their life-
style. And only a portion of those funds should be devoted to any one trade because a trader cannot expect to profit on every trade.
CME Group is the trademark of CME Group, Inc. The Globe logo, Globex® and CME® are trademarks of Chicago Mercantile Exchange, Inc. CBOT® is the trademark of the Board of Trade of the City of Chicago. NYMEX,
New York Mercantile Exchange, and ClearPort are trademarks of New York Mercantile Exchange. Inc. COMEX is a trademark of Commodity Exchange, Inc. Copyright © 2011 CME Group. All rights reserved.