The document discusses human activity recognition using the AdaBoost classifiers on the WISDM dataset, highlighting its applications in various fields such as health monitoring and elder care. The study tests different classifiers, finding that the usage of AdaBoost with specific algorithms like Random Forest and J48 significantly improves accuracy. The research shows the challenges faced in designing human activity recognition systems and evaluates the performance of various classifiers using a standardized dataset.
![International Journal of Trend in Scientific Research and Development (IJTSRD) @ www.ijtsrd.com eISSN: 2456-6470
@ IJTSRD | Unique Paper ID – IJTSRD28073 | Volume – 3 | Issue – 6 | September - October 2019 Page 208
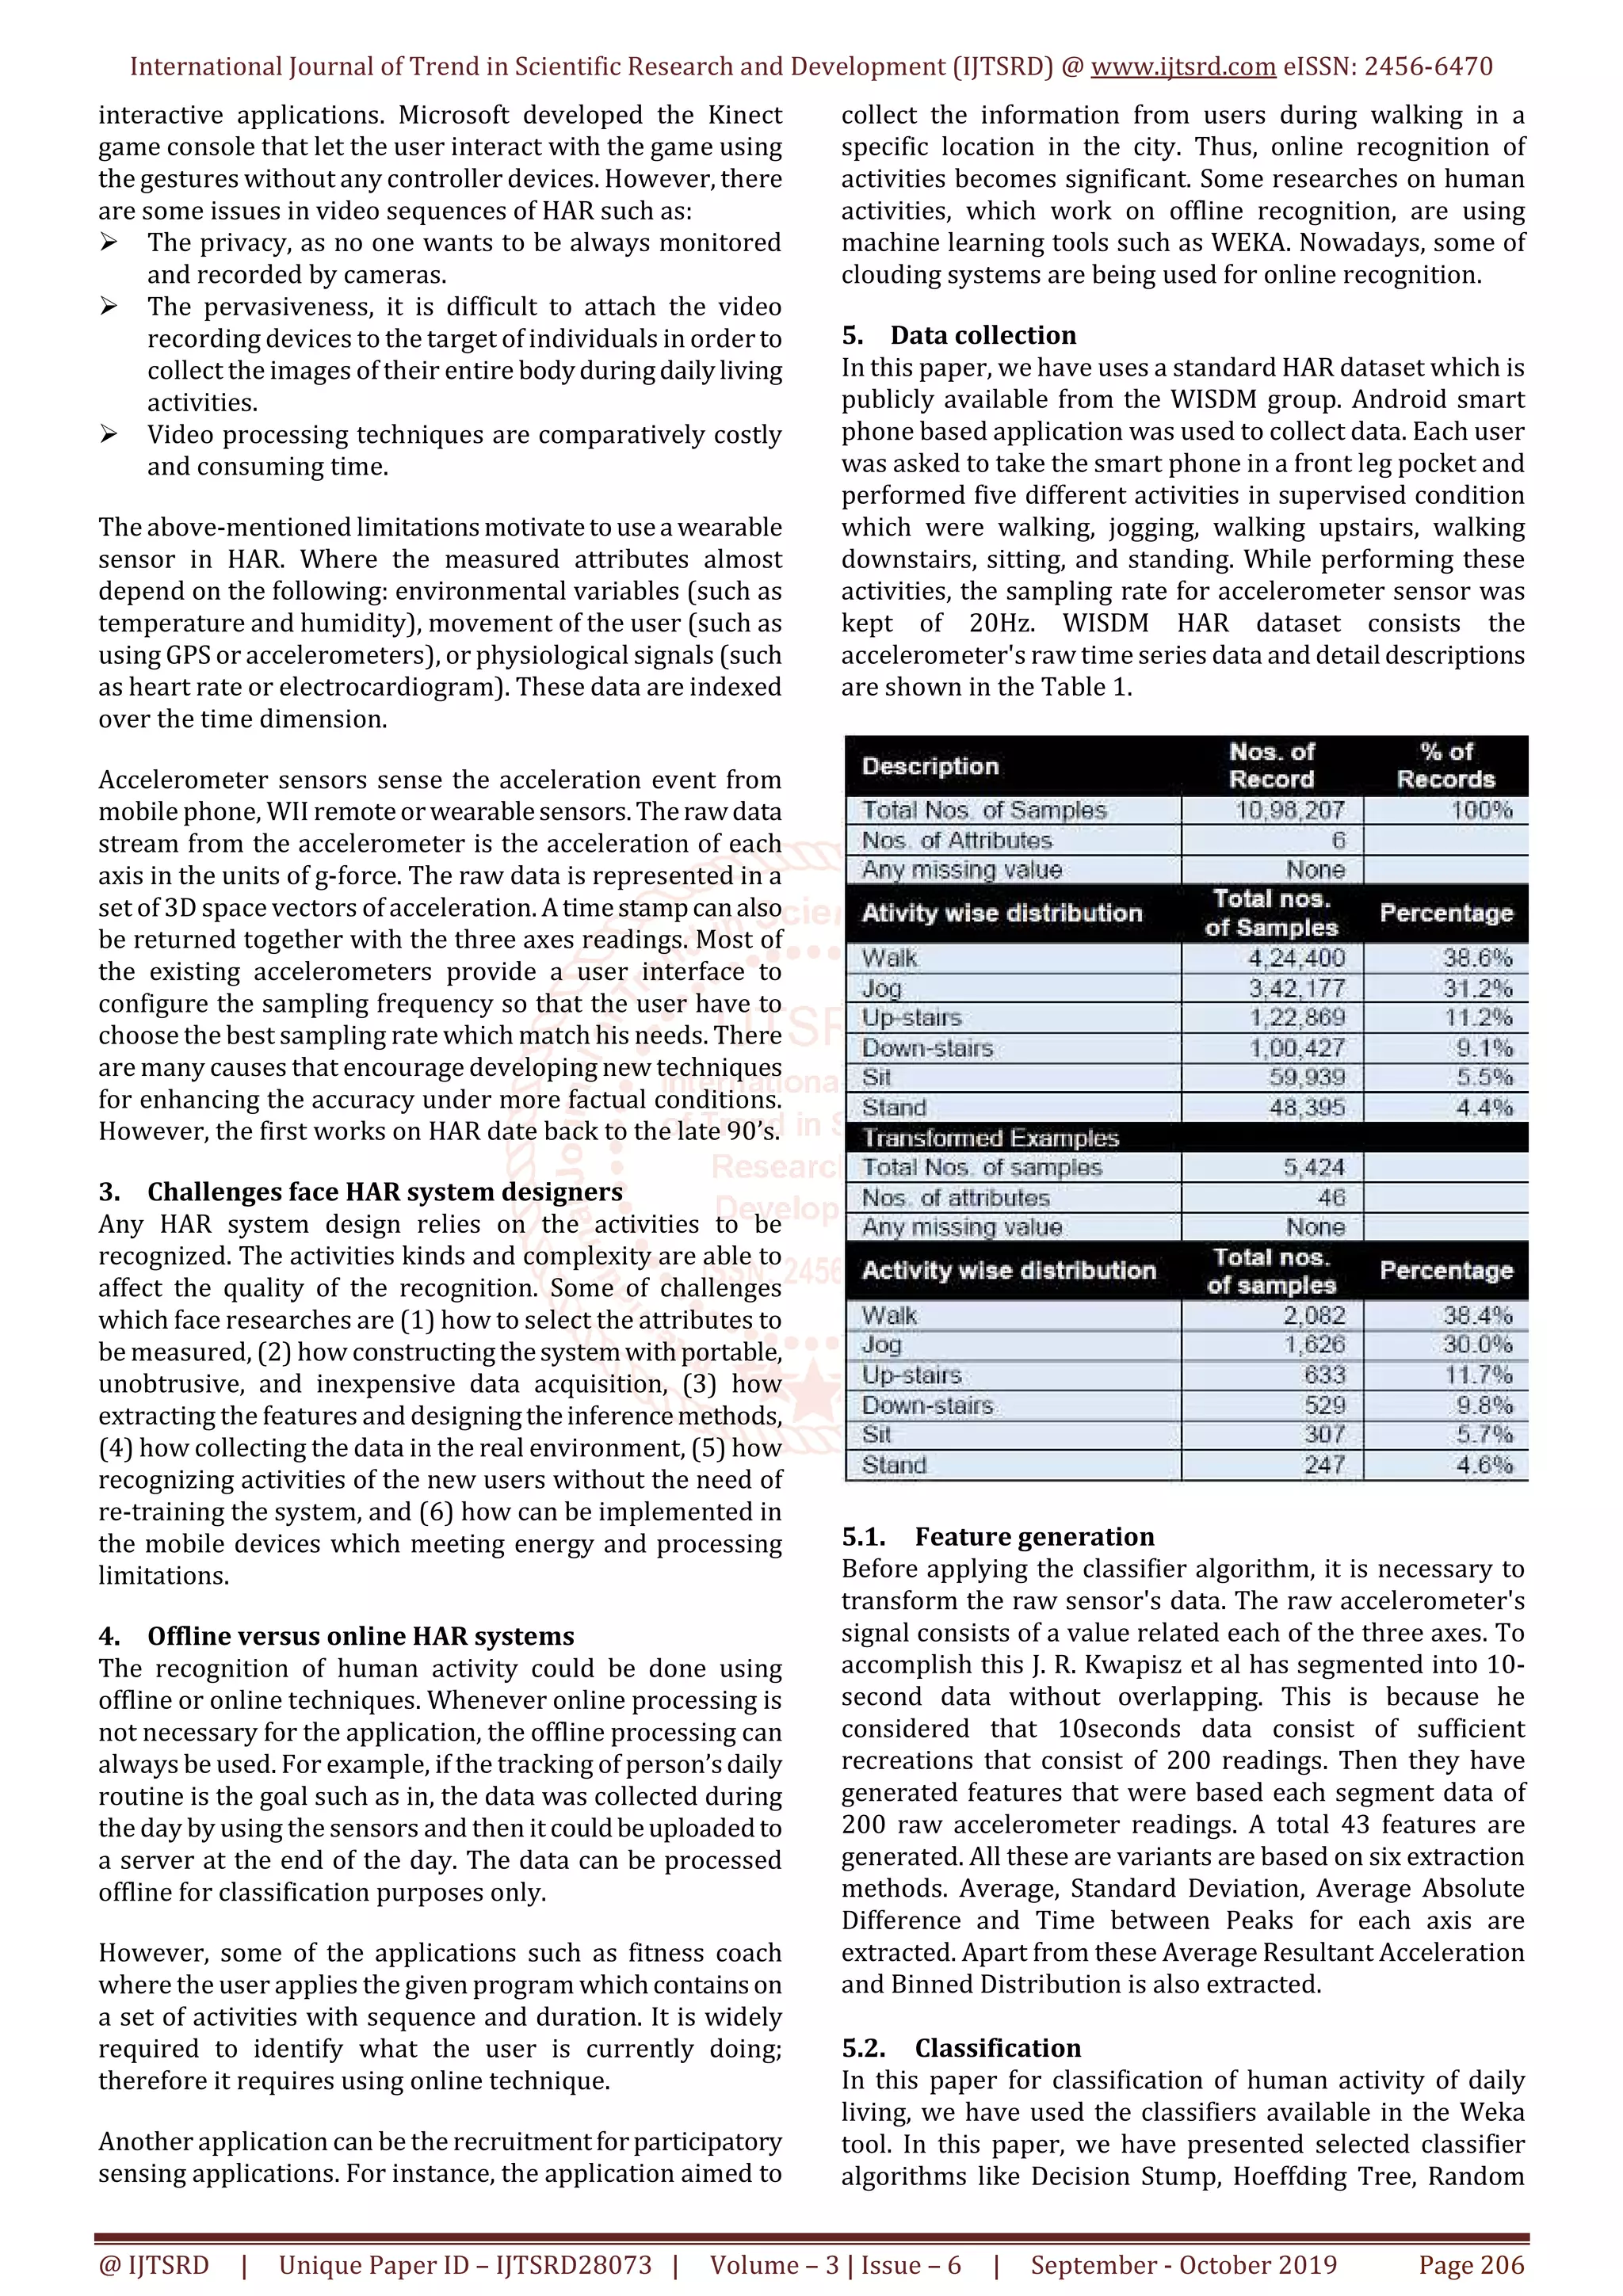
6.2. Performance criteria for classifiers
The performance criteria for classifiers are as shown in
Table 8 to Table 13.
Table8. Performance Criteria for Adaboost.M1 Meta
Classifier with Decision Stump
Class TPRate FPRate Precision Recall F-Measure MCC ROCArea PRCArea
Walking 0.968 0.553 0.522 0.968 0.678 0.446 0.708 0.519
Jogging 0.886 0.032 0.923 0.886 0.904 0.865 0.93 0.876
Upstairs 0 0 ? 0 ? ? 0.624 0.152
Downstairs 0 0 ? 0 ? ? 0.651 0.135
Sitting 0 0 ? 0 ? ? 0.654 0.08
Standing 0 0 ? 0 ? ? 0.651 0.064
WeightedAvg. 0.638 0.222 ? 0.638 ? ? 0.753 0.5
Table9. Performance Criteria for Adaboost.M1 Meta
Classifier with Hoeffding Tree
Class TPRate FPRate Precision Recall F-Measure MCC ROCArea PRCArea
Walking 0.895 0.218 0.72 0.895 0.798 0.66 0.91 0.851
Jogging 0.935 0.038 0.912 0.935 0.924 0.891 0.979 0.971
Upstairs 0.182 0.039 0.382 0.182 0.247 0.201 0.832 0.327
Downstairs 0.206 0.029 0.433 0.206 0.279 0.25 0.81 0.316
Sitting 0.941 0.007 0.894 0.941 0.917 0.912 0.998 0.979
Standing 0.809 0.017 0.691 0.809 0.745 0.735 0.991 0.783
WeightedAvg. 0.756 0.104 0.719 0.756 0.725 0.653 0.92 0.778
Table10. Performance Criteria for Adaboost.M1 Meta
Classifier with Random Tree
Class TPRate FPRate Precision Recall F-Measure MCC ROCArea PRCArea
Walking 0.981 0.022 0.965 0.981 0.973 0.956 0.997 0.996
Jogging 0.985 0.009 0.979 0.985 0.982 0.974 0.999 0.998
Upstairs 0.793 0.031 0.77 0.793 0.781 0.752 0.976 0.857
Downstairs 0.682 0.021 0.778 0.682 0.727 0.701 0.975 0.813
Sitting 0.977 0.003 0.958 0.977 0.968 0.966 1 0.995
Standing 0.935 0.002 0.962 0.935 0.948 0.946 0.997 0.981
WeightedAvg. 0.929 0.017 0.927 0.929 0.928 0.913 0.993 0.962
Table11. Performance Criteria for Adaboost.M1 Meta
Classifier with REP Tree
Class TPRate FPRate Precision Recall F-Measure MCC ROCArea PRCArea
Walking 0.992 0.016 0.975 0.992 0.984 0.974 0.997 0.992
Jogging 0.969 0.007 0.984 0.969 0.976 0.967 0.989 0.988
Upstairs 0.791 0.029 0.785 0.791 0.788 0.76 0.982 0.872
Downstairs 0.759 0.029 0.737 0.759 0.748 0.721 0.978 0.801
Sitting 0.954 0.001 0.99 0.954 0.972 0.97 0.991 0.981
Standing 0.902 0 0.991 0.902 0.945 0.943 0.946 0.915
WeightedAvg. 0.933 0.014 0.934 0.933 0.933 0.92 0.988 0.954
Table12. Performance Criteria for Adaboost.M1 Meta
Classifier with J48
Class TPRate FPRate Precision Recall F-Measure MCC ROCArea PRCArea
Walking 0.97 0.025 0.96 0.97 0.965 0.943 0.995 0.993
Jogging 0.975 0.016 0.964 0.975 0.97 0.957 0.998 0.994
Upstairs 0.704 0.027 0.773 0.704 0.737 0.705 0.964 0.829
Downstairs 0.739 0.032 0.713 0.739 0.726 0.696 0.967 0.794
Sitting 0.971 0.002 0.967 0.971 0.969 0.967 0.994 0.972
Standing 0.955 0.001 0.979 0.955 0.967 0.966 0.996 0.988
WeightedAvg. 0.917 0.021 0.916 0.917 0.917 0.898 0.989 0.953
Table13. Performance Criteria for Adaboost.M1 Meta
Classifier with Random Forest
Class TPRate FPRate Precision Recall F-Measure MCC ROCArea PRCArea
Walking 0.984 0.014 0.978 0.984 0.981 0.969 0.998 0.997
Jogging 0.988 0.006 0.986 0.988 0.987 0.982 1 0.999
Upstairs 0.816 0.027 0.802 0.816 0.809 0.784 0.986 0.908
Downstairs 0.744 0.022 0.788 0.744 0.765 0.741 0.984 0.883
Sitting 0.987 0.001 0.981 0.987 0.984 0.983 1 0.999
Standing 0.976 0.001 0.976 0.976 0.976 0.974 1 0.995
WeightedAvg. 0.942 0.012 0.941 0.942 0.942 0.93 0.996 0.976
7. Conclusion
This paper surveys the state-of-the-art in human activity
recognition based on measured acceleration components.
It can be concluded that the Random Forest, REP Tree and
J48 algorithms which have a little “v” next to their results
means that the difference in the accuracyofthesealgorithms
compared to Decision Stump, and Hoeffding Tree is
statistically significant. This paper also shows the accuracy
of these algorithms compared to Decision Stump, and
Hoeffding Tree is high, so it can be said that these two
algorithms achieved a statistically significantly better result
than the Decision Stump, and Hoeffding Tree and Random
Tree baseline.
8. References
[1] Khan, Adil Mehmood and Lee, Young-Koo and Lee,
Sungyoung Y and Kim, Tae-Seong [2010] A triaxial
accelerometer-based physical-activity recognition via
augmented-signal features and a hierarchical
recognizer,
Information Technology in Biomedicine, IEEE
Transactions;14:5–1166.
[2] Casale, Pierluigi, Pujol Oriol, Radeva Petia. [2011]
Human activity recognition from accelerometer data
using a wearable device, Pattern Recognition and
Image Analysis, 289, Springer.
[3] A. G. Renehan, M. Tyson, M. Egger, R. F. Heller, M.
Zwahlen, Bodymass index and incidence of cancer: a
systematic review and metaanalysis of prospective
observational studies, TheLancet371(2008)569-578.
[4] A. P. C. S. Collaboration, et al., Body mass index and
cardiovascular disease in the asia-pacific region: an
overview of 33 cohorts involving 310 000participants,
International journal of epidemiology 33 (2004) 751-
758.
[5] M. Javan Roshtkhari and M. D. Levine, “Human activity
recognition in videos using a single example,” Image
Vis. Comput., vol. 31, no. 11, pp. 864–876, Nov. 2013.
[6] Redmon, J., Farhadi, A.: Yolo9000: Better, faster,
stronger. In: Computer Vision and Pattern Recognition
(CVPR), 2017 IEEE Conference on, IEEE (2017) 6517–
6525.
[7] Slim S. O., Atia A., Mostafa MS.M. (2016) An
Experimental Comparison Between Seven
Classification Algorithms for Activity Recognition. In
The 1st International Conference on Advanced
Intelligent System and Informatics (AISI2015),
November 28-30, 2015, Beni Suef, Egypt. Advances in](https://image.slidesharecdn.com/32dailyhumanactivityrecognitionusingadaboostclassifiersonwisdmdataset-191113091931/75/Daily-Human-Activity-Recognition-using-Adaboost-Classifiers-on-Wisdm-Dataset-4-2048.jpg)
![International Journal of Trend in Scientific Research and Development (IJTSRD) @ www.ijtsrd.com eISSN: 2456-6470
@ IJTSRD | Unique Paper ID – IJTSRD28073 | Volume – 3 | Issue – 6 | September - October 2019 Page 209
Intelligent Systems and Computing, vol 407. Springer,
Cham.
[8] T. HAYASHI, M. NISHIDA, N. KITAOKA, T. TODA and K.
TAKEDA, "Daily ActivityRecognitionwithLarge-Scaled
Real-Life Recording Datasets Based on Deep Neural
Network Using Multi-Modal Signals", IEICE
Transactions on Fundamentals of Electronics,
Communications and Computer Sciences, vol. 101, no.
1, pp. 199-210, 2018.
[9] T. Hayashi, M. Nishida, N. Kitaoka,andK.Takeda,“Daily
activity recognition based on dnn using environmental
sound and acceleration signals,” European Signal
Processing Conference, pp.2306–2310, IEEE, 2015.
[10] M. Saeed, J. Pietilä, and I. Korhonen. “An Activity
Recognition Framework Deploying theRandomForest
Classifier and A Single Optical Heart Rate Monitoring
and Triaxial Accelerometer WristBand.”Sensors(Basel,
Switzerland), 18(2), 2018.
[11] Shirahama, K.; Grzegorzek, M. On the Generality of
Codebook Approach for Sensor-based Human Activity
Recognition. Electronics 2017, 6, 44.
[12] Kose, Mustafa.; Incel, O.D.; Ersoy, C. Online Human
Activity Recognition on Smart Phones.InProceeedings
of the Workshop on Mobile Sensing: From
Smartphones and Wearables toBigData,Beijing,China,
16 April 2012; pp. 11–15.
[13] Dean M. Karantonis, Michael R. Narayanan, Merryn
Mathie, Nigel H. Lovell, Branko G. Celler [2006]
Implementation of a real-time human movement
classifier using a triaxial accelerometerforambulatory
monitoring, IEEE Transactions on Information
Technology in Biomedicine, 10(1): 156–167
[14] N Ravi, N Dandekar, P Mysore, and ML Littman. [2005]
Activity recognition from accelerometer data.IAAI-05:
American Association for Artificial Intelligence.](https://image.slidesharecdn.com/32dailyhumanactivityrecognitionusingadaboostclassifiersonwisdmdataset-191113091931/75/Daily-Human-Activity-Recognition-using-Adaboost-Classifiers-on-Wisdm-Dataset-5-2048.jpg)