Download to read offline


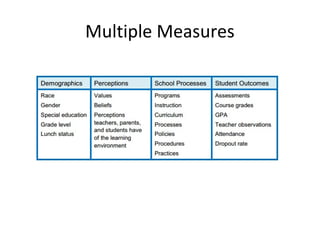


The document discusses instructional data analysis and data teams. It defines a data team as a group of educators that collaboratively uses data to identify opportunities for improvement, develop plans to address them, implement changes, and reflect on results. The document outlines the data team process and provides examples of how data can be analyzed, including examining frequency distributions by subgroup, common core strand analysis, and comparing p-values. It emphasizes using data to inform instructional decisions and continually assessing the impact of changes made by data teams.


![Data driven ppt_presentation[1]](https://cdn.slidesharecdn.com/ss_thumbnails/datadrivenpptpresentation1-100710102551-phpapp02-thumbnail.jpg?width=640&height=640&fit=bounds)


