Download as PDF, PPTX
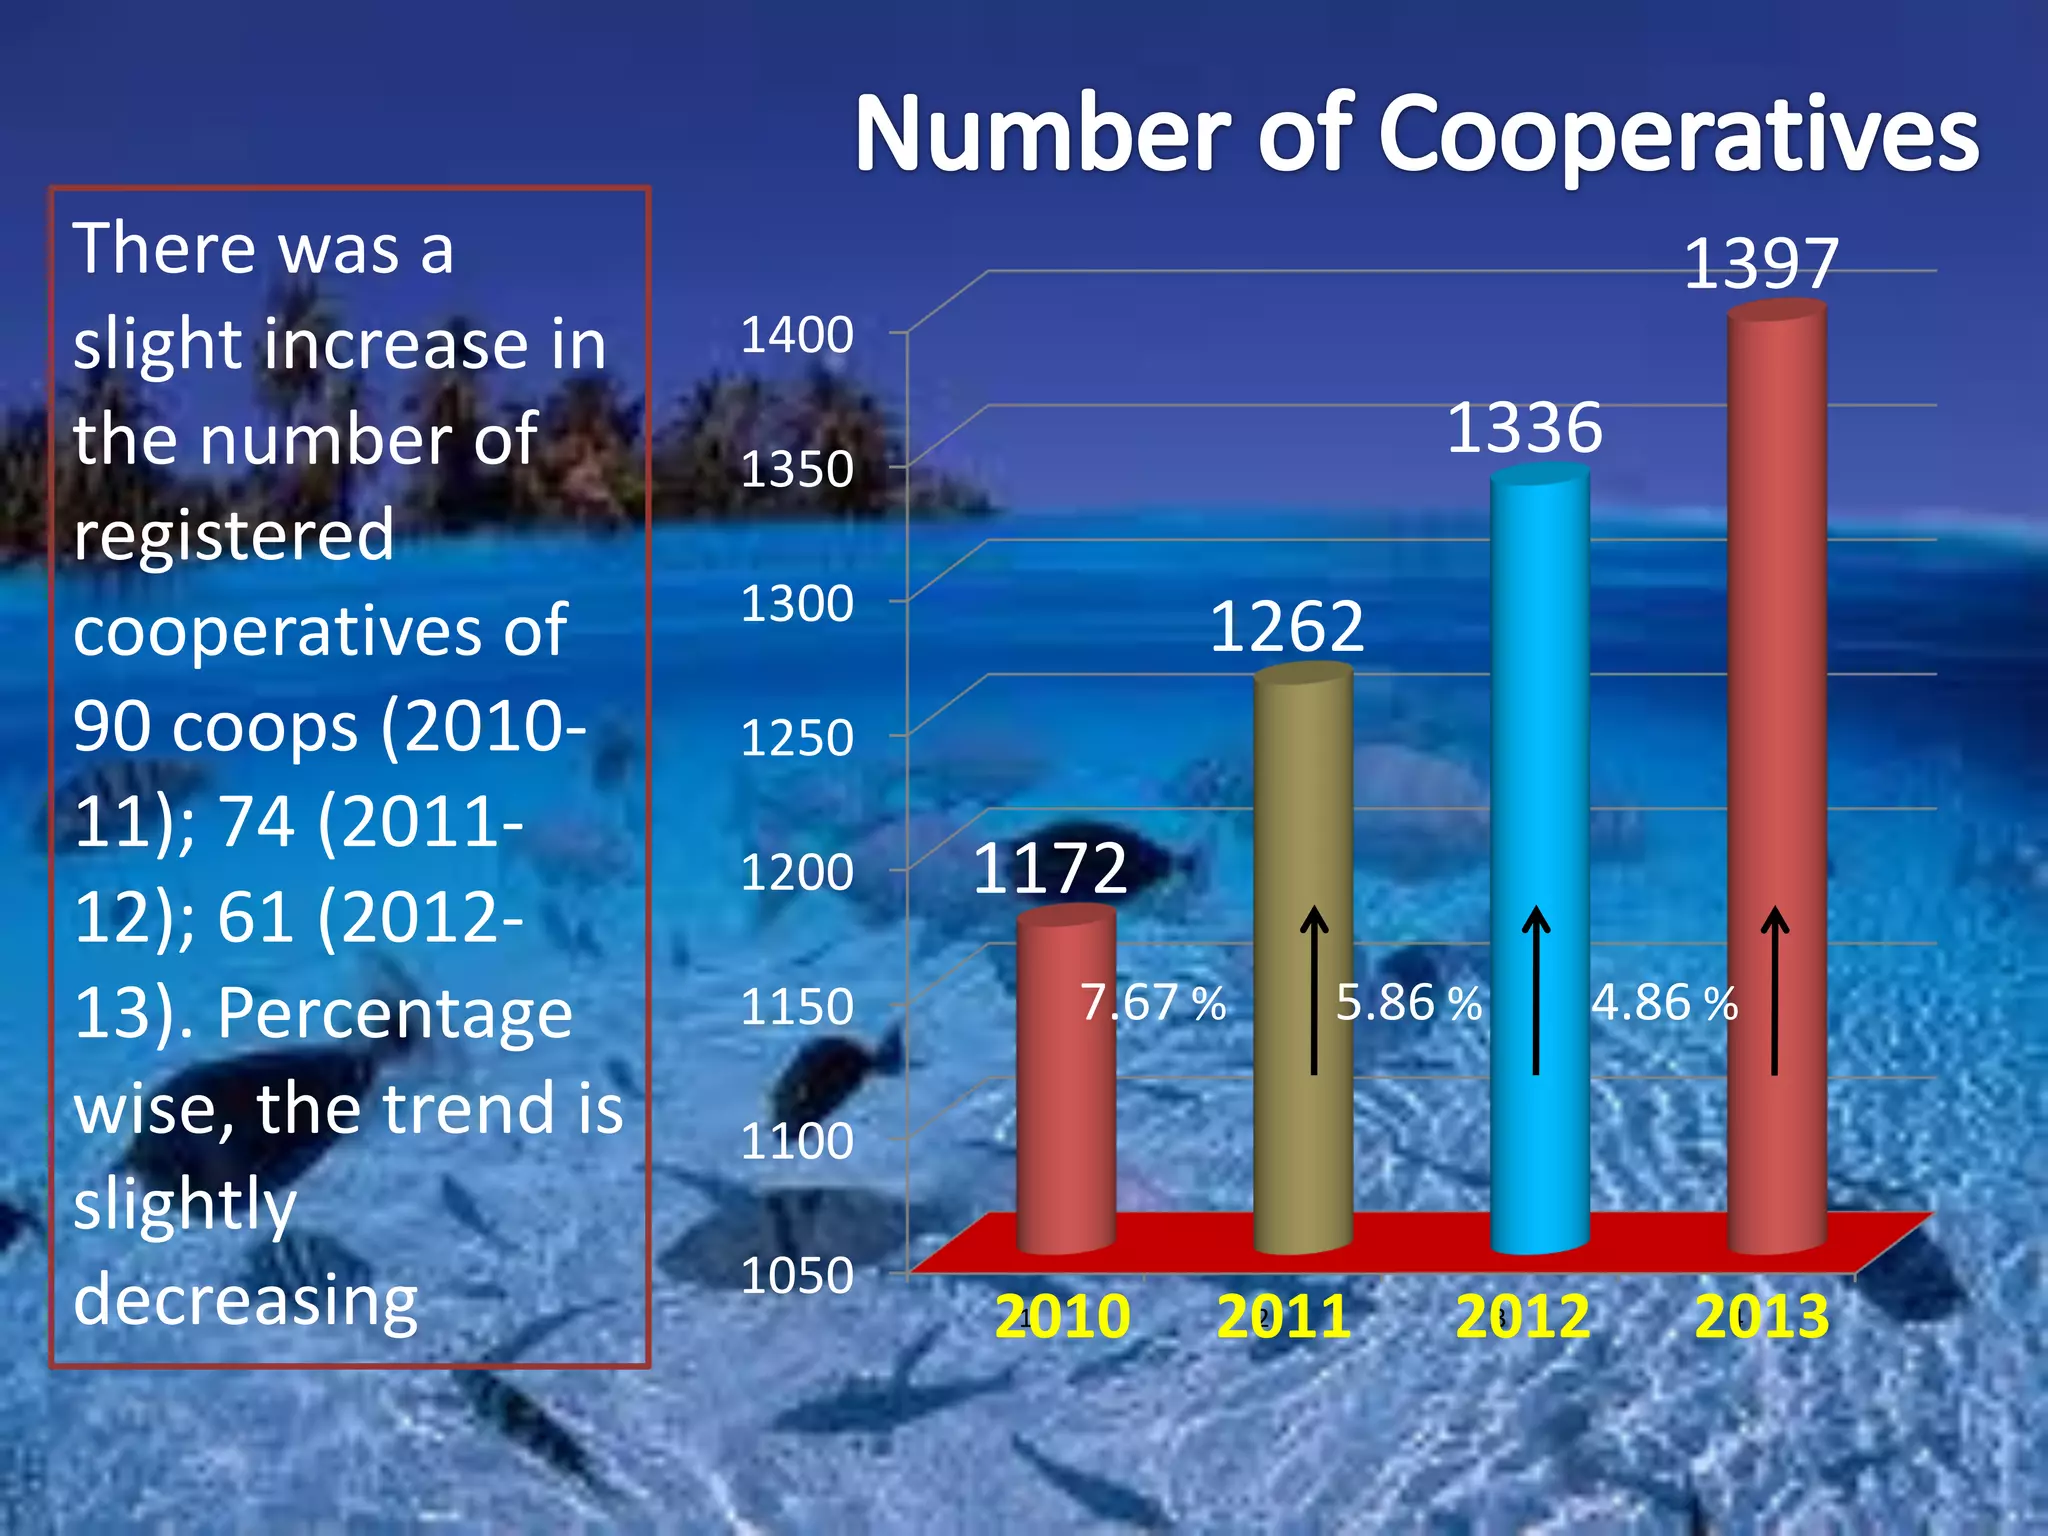
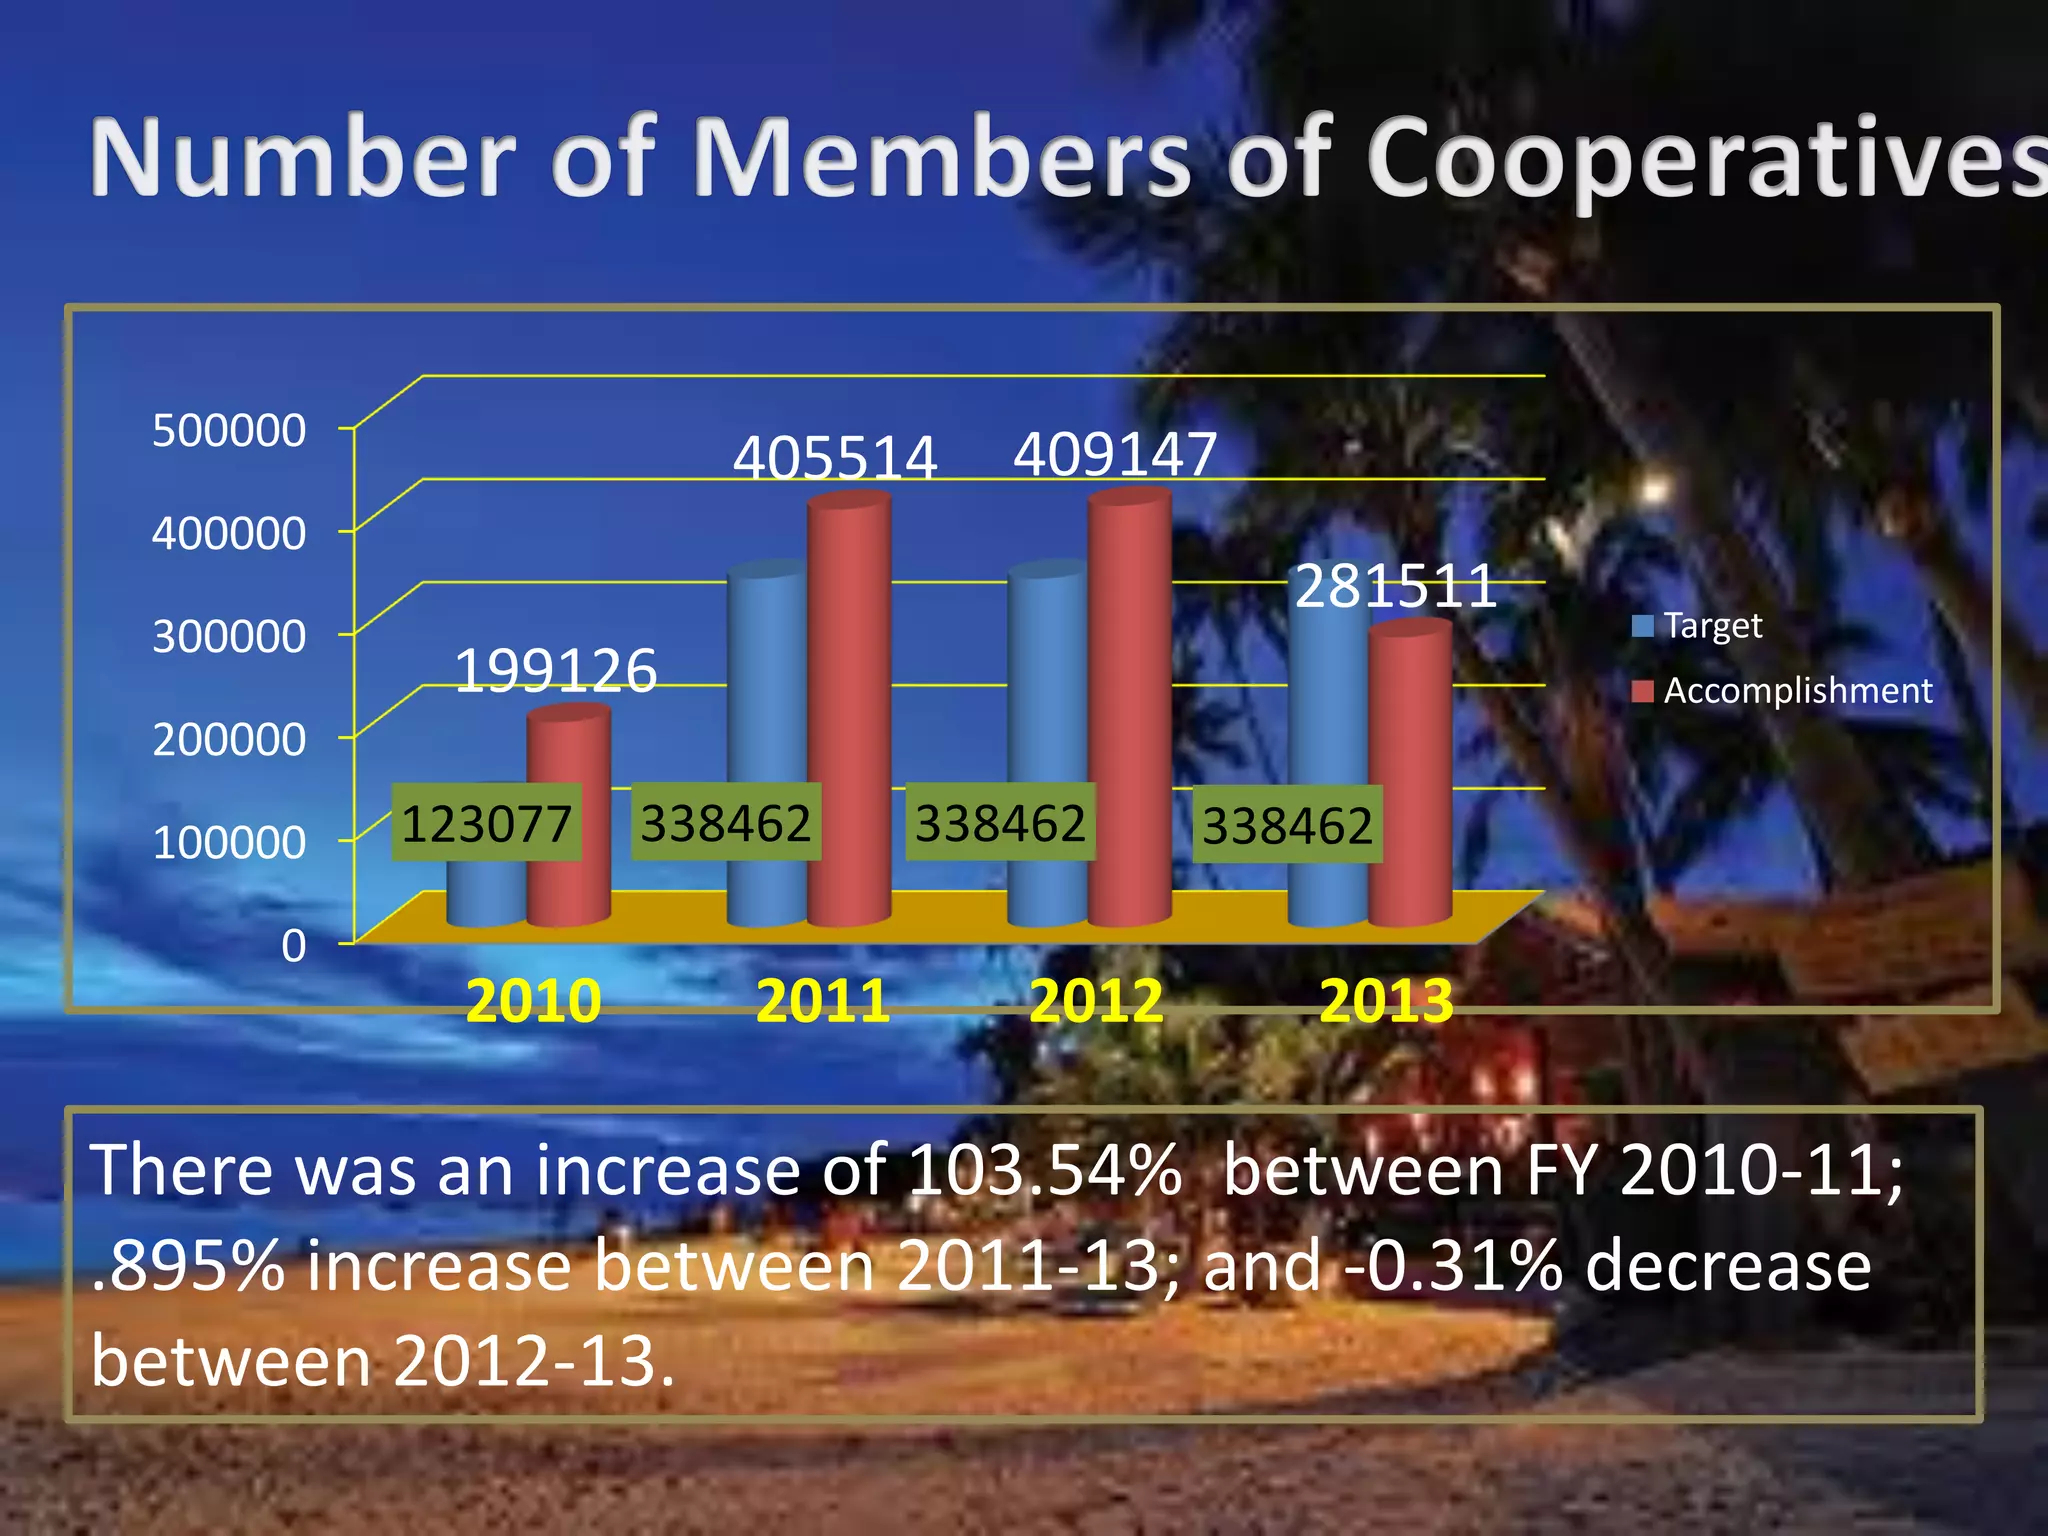
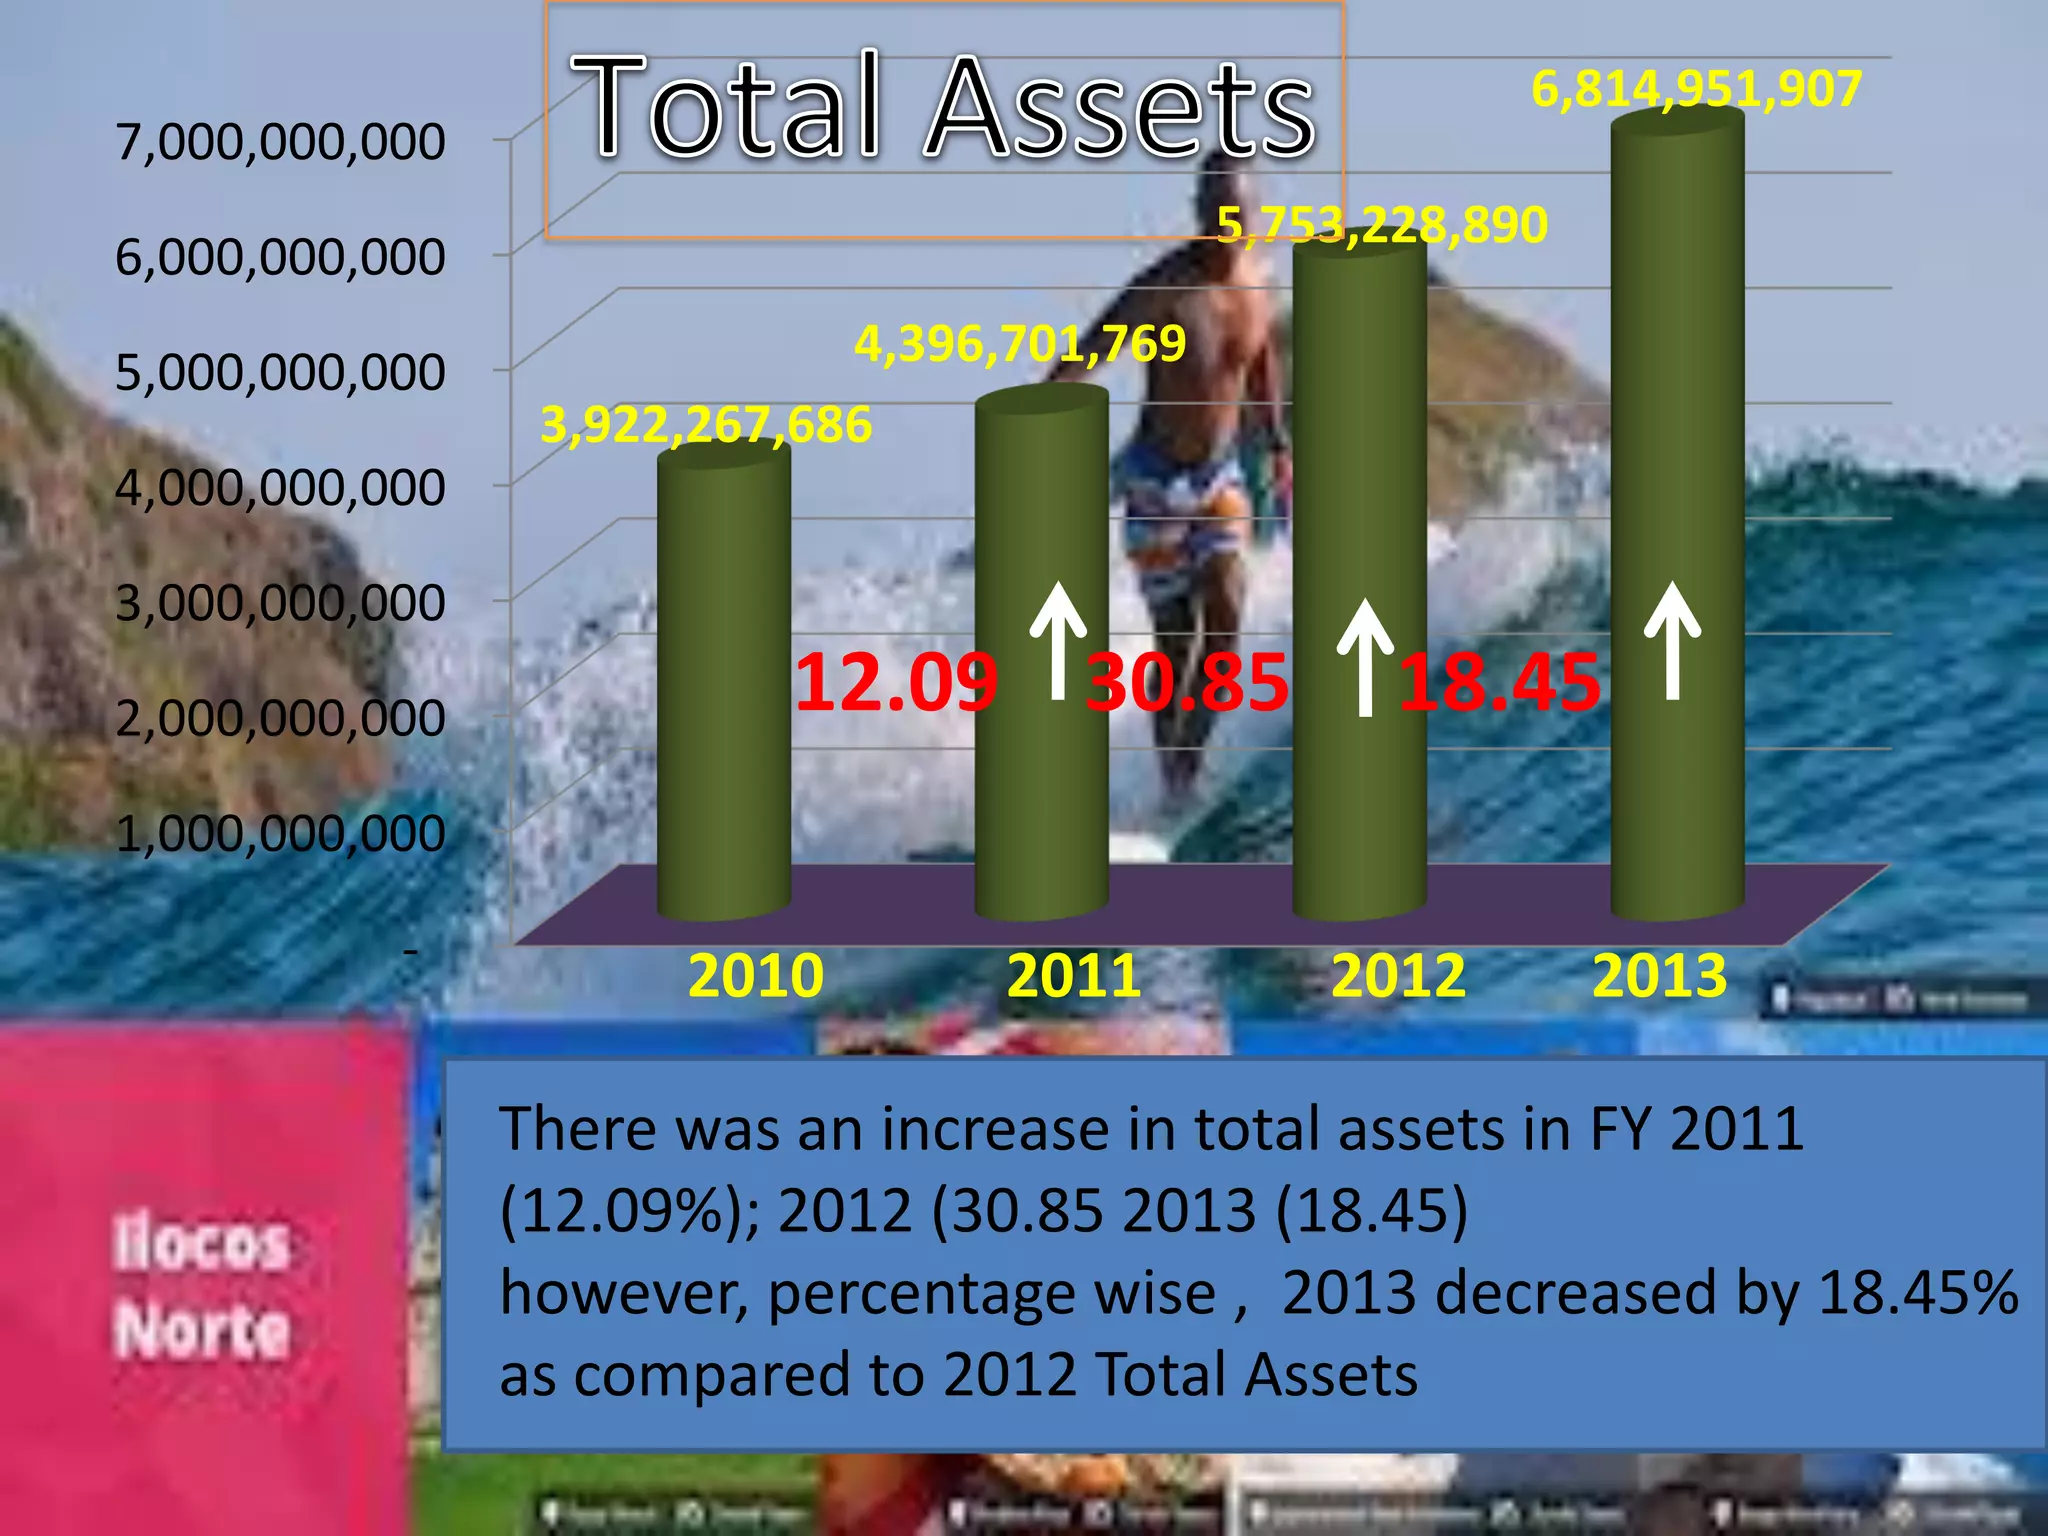
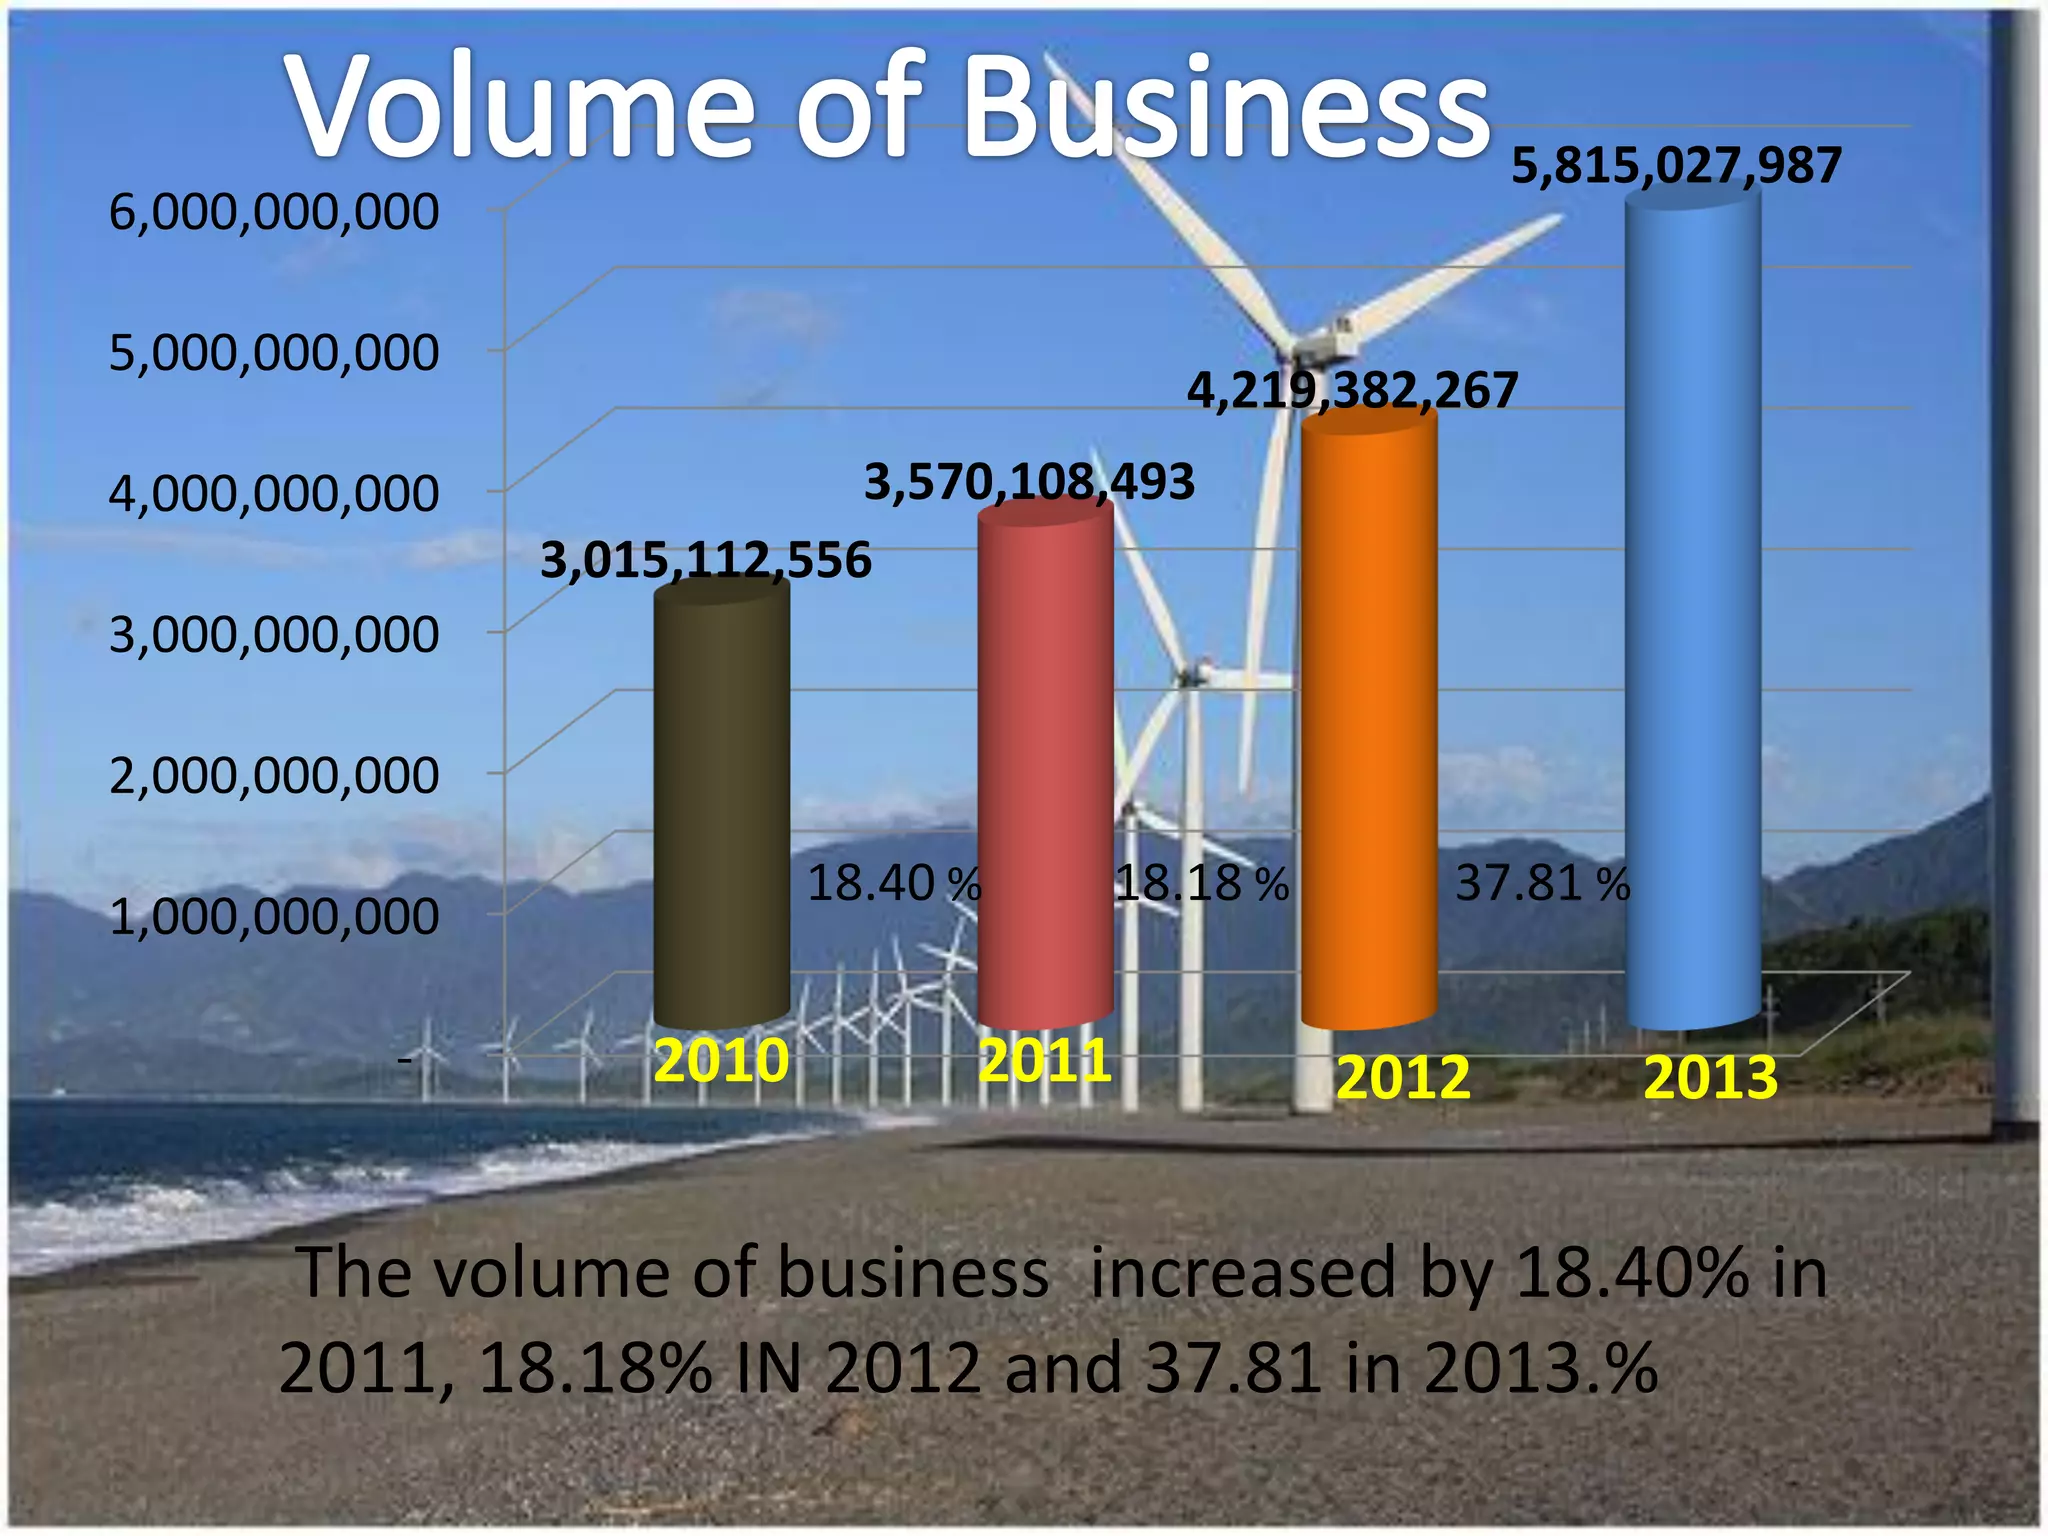
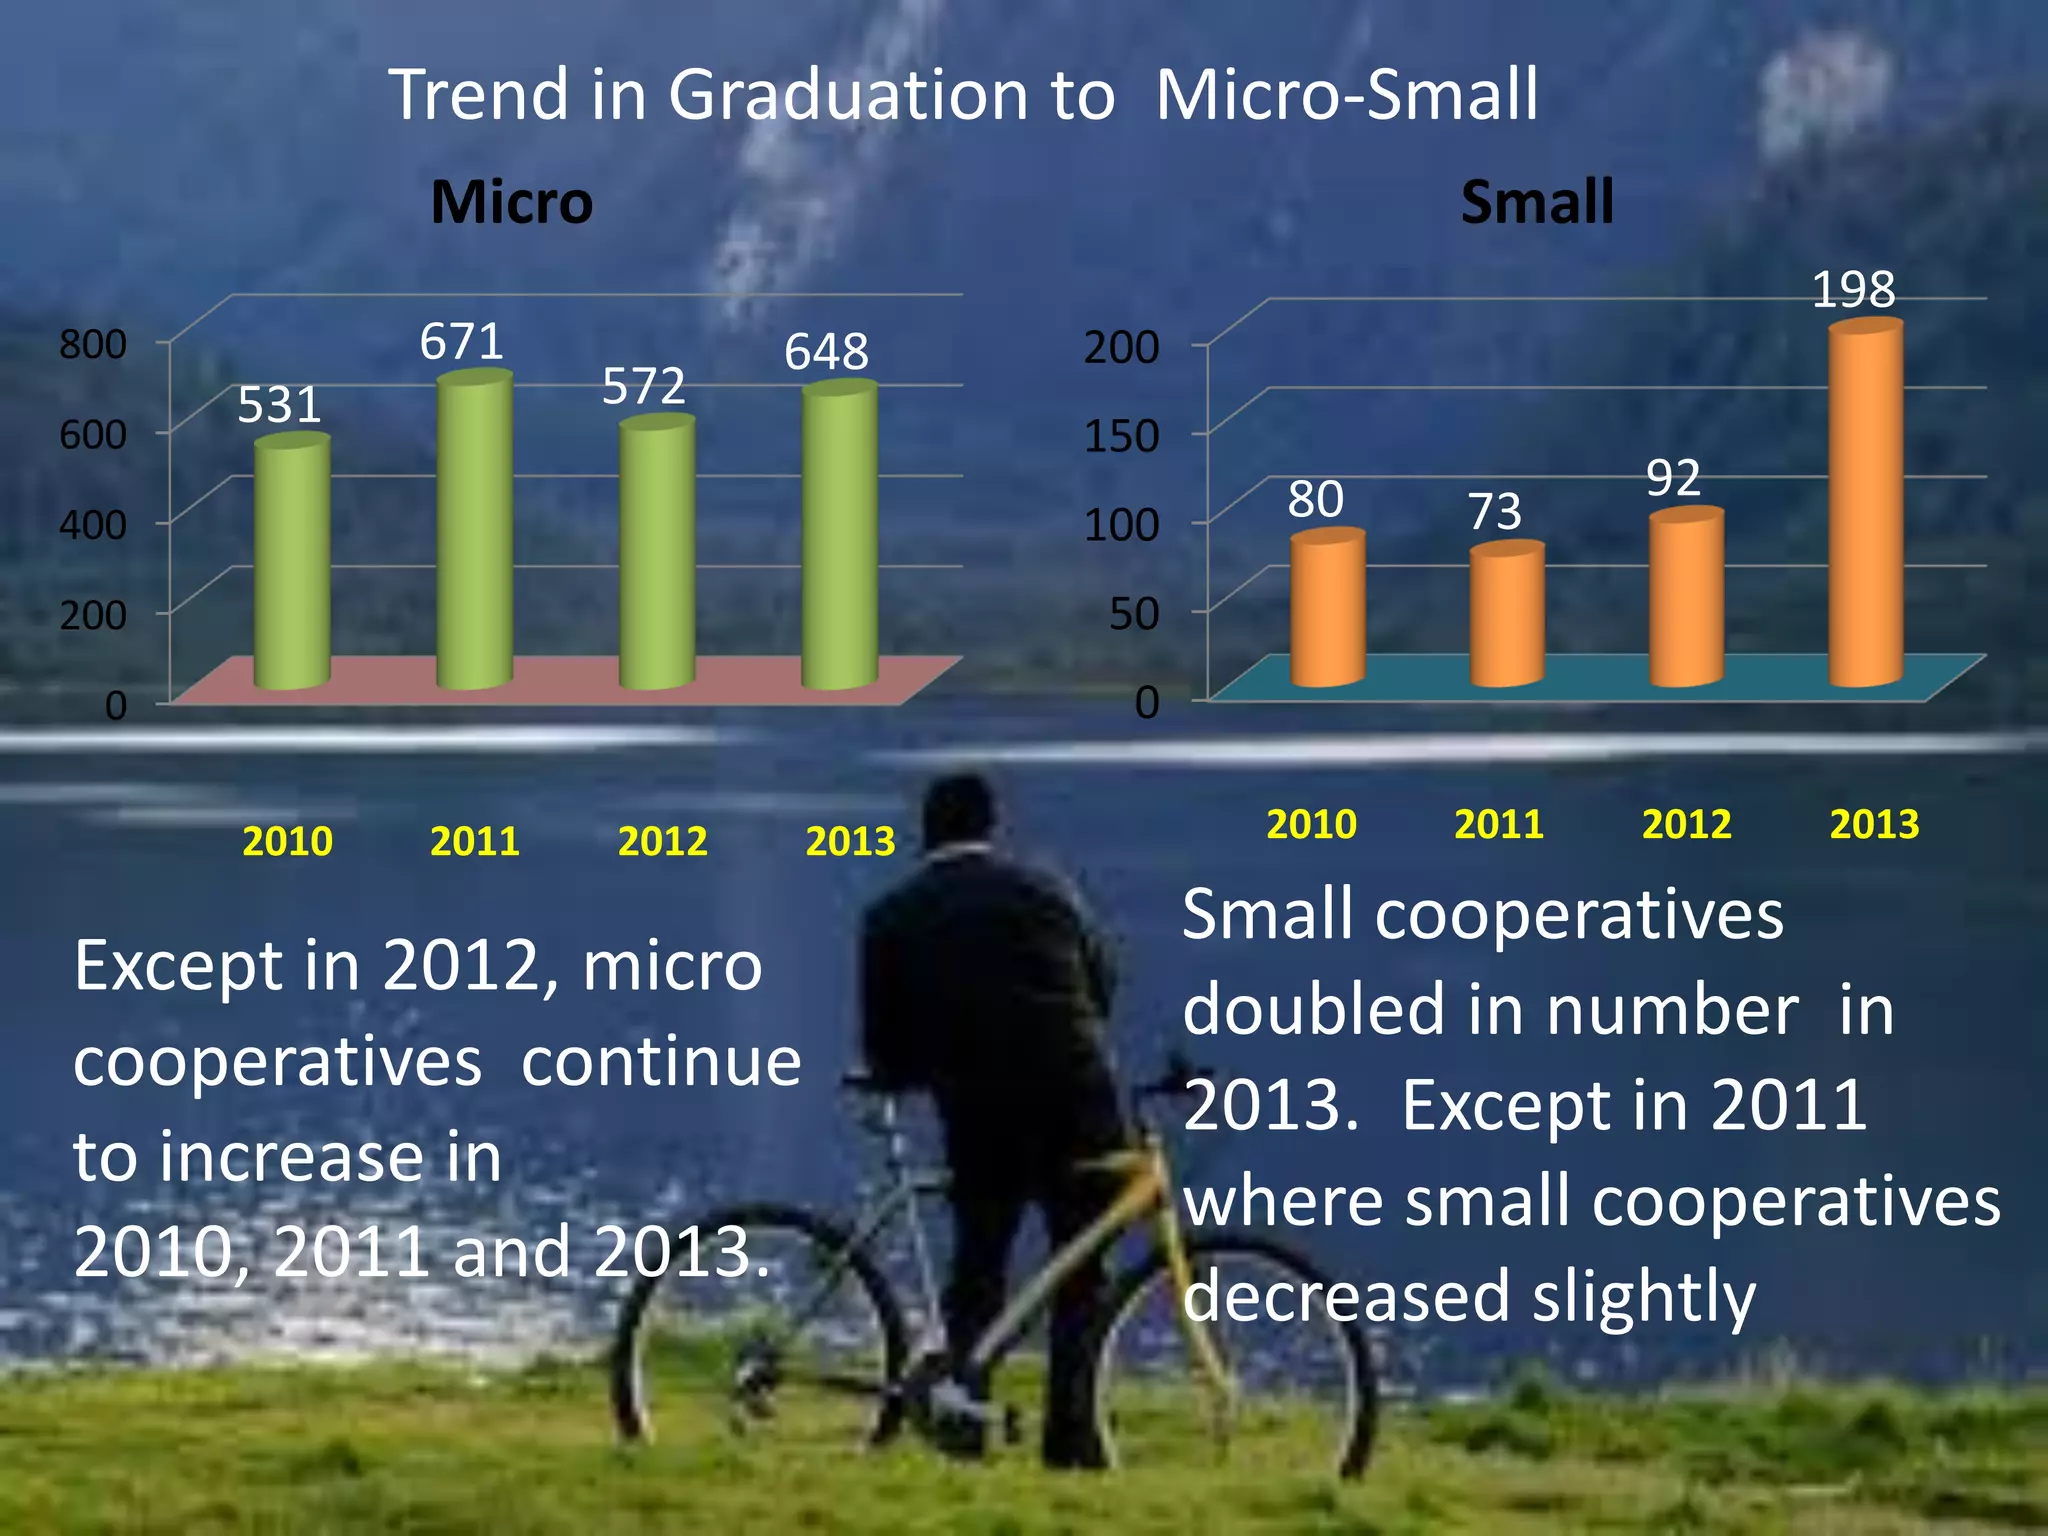
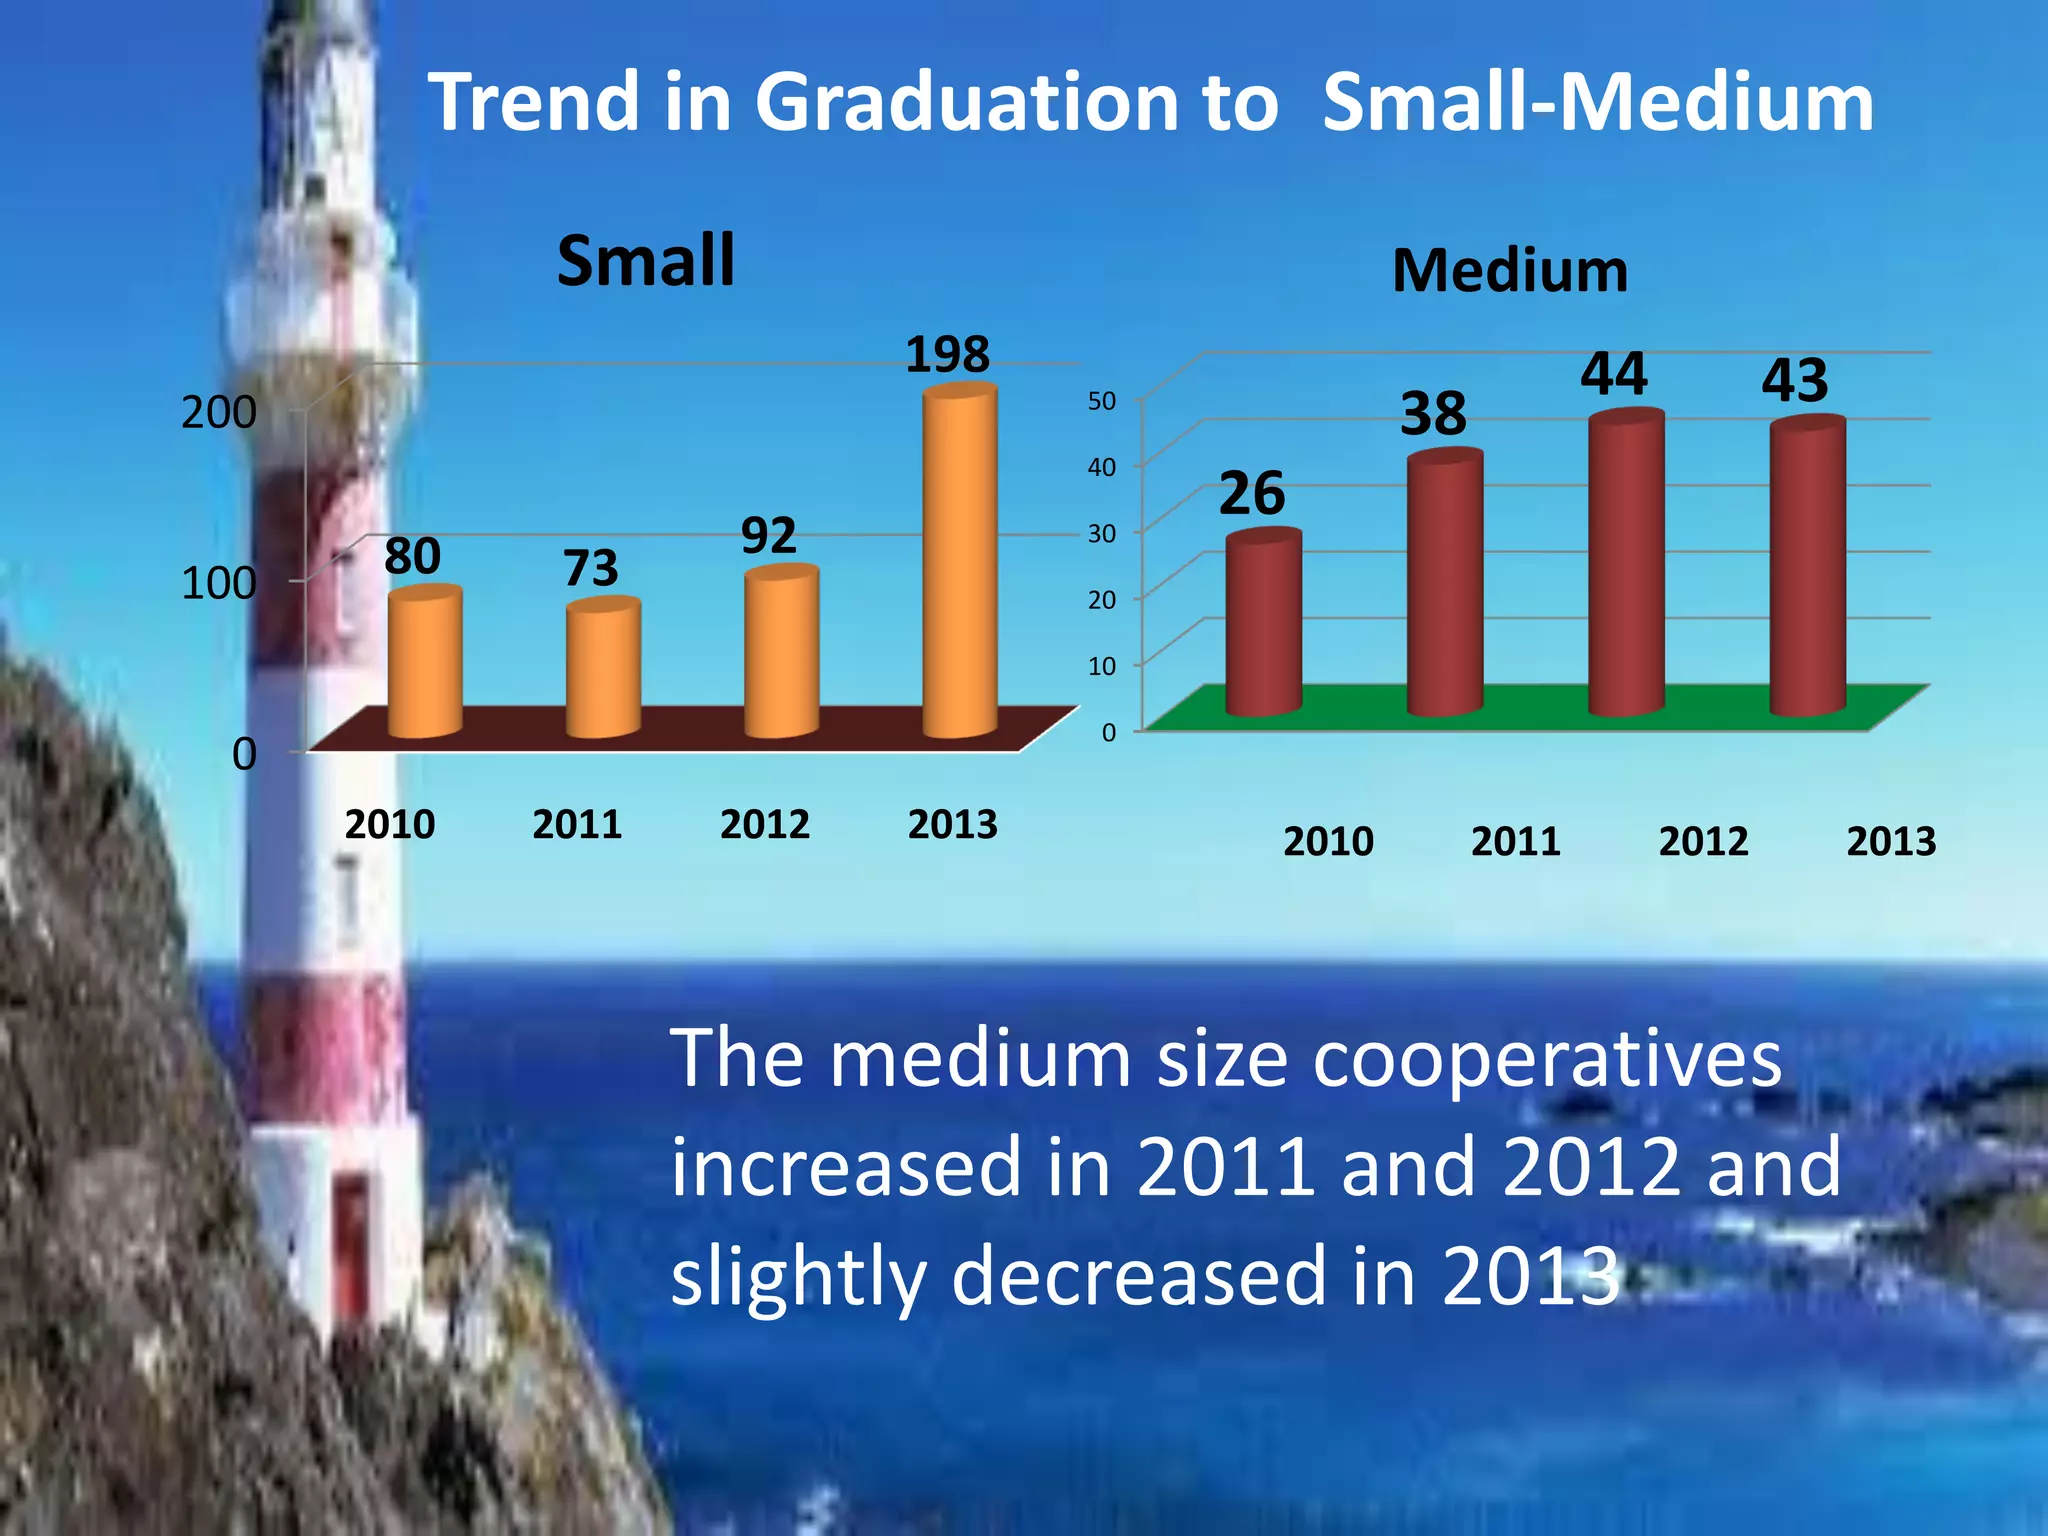
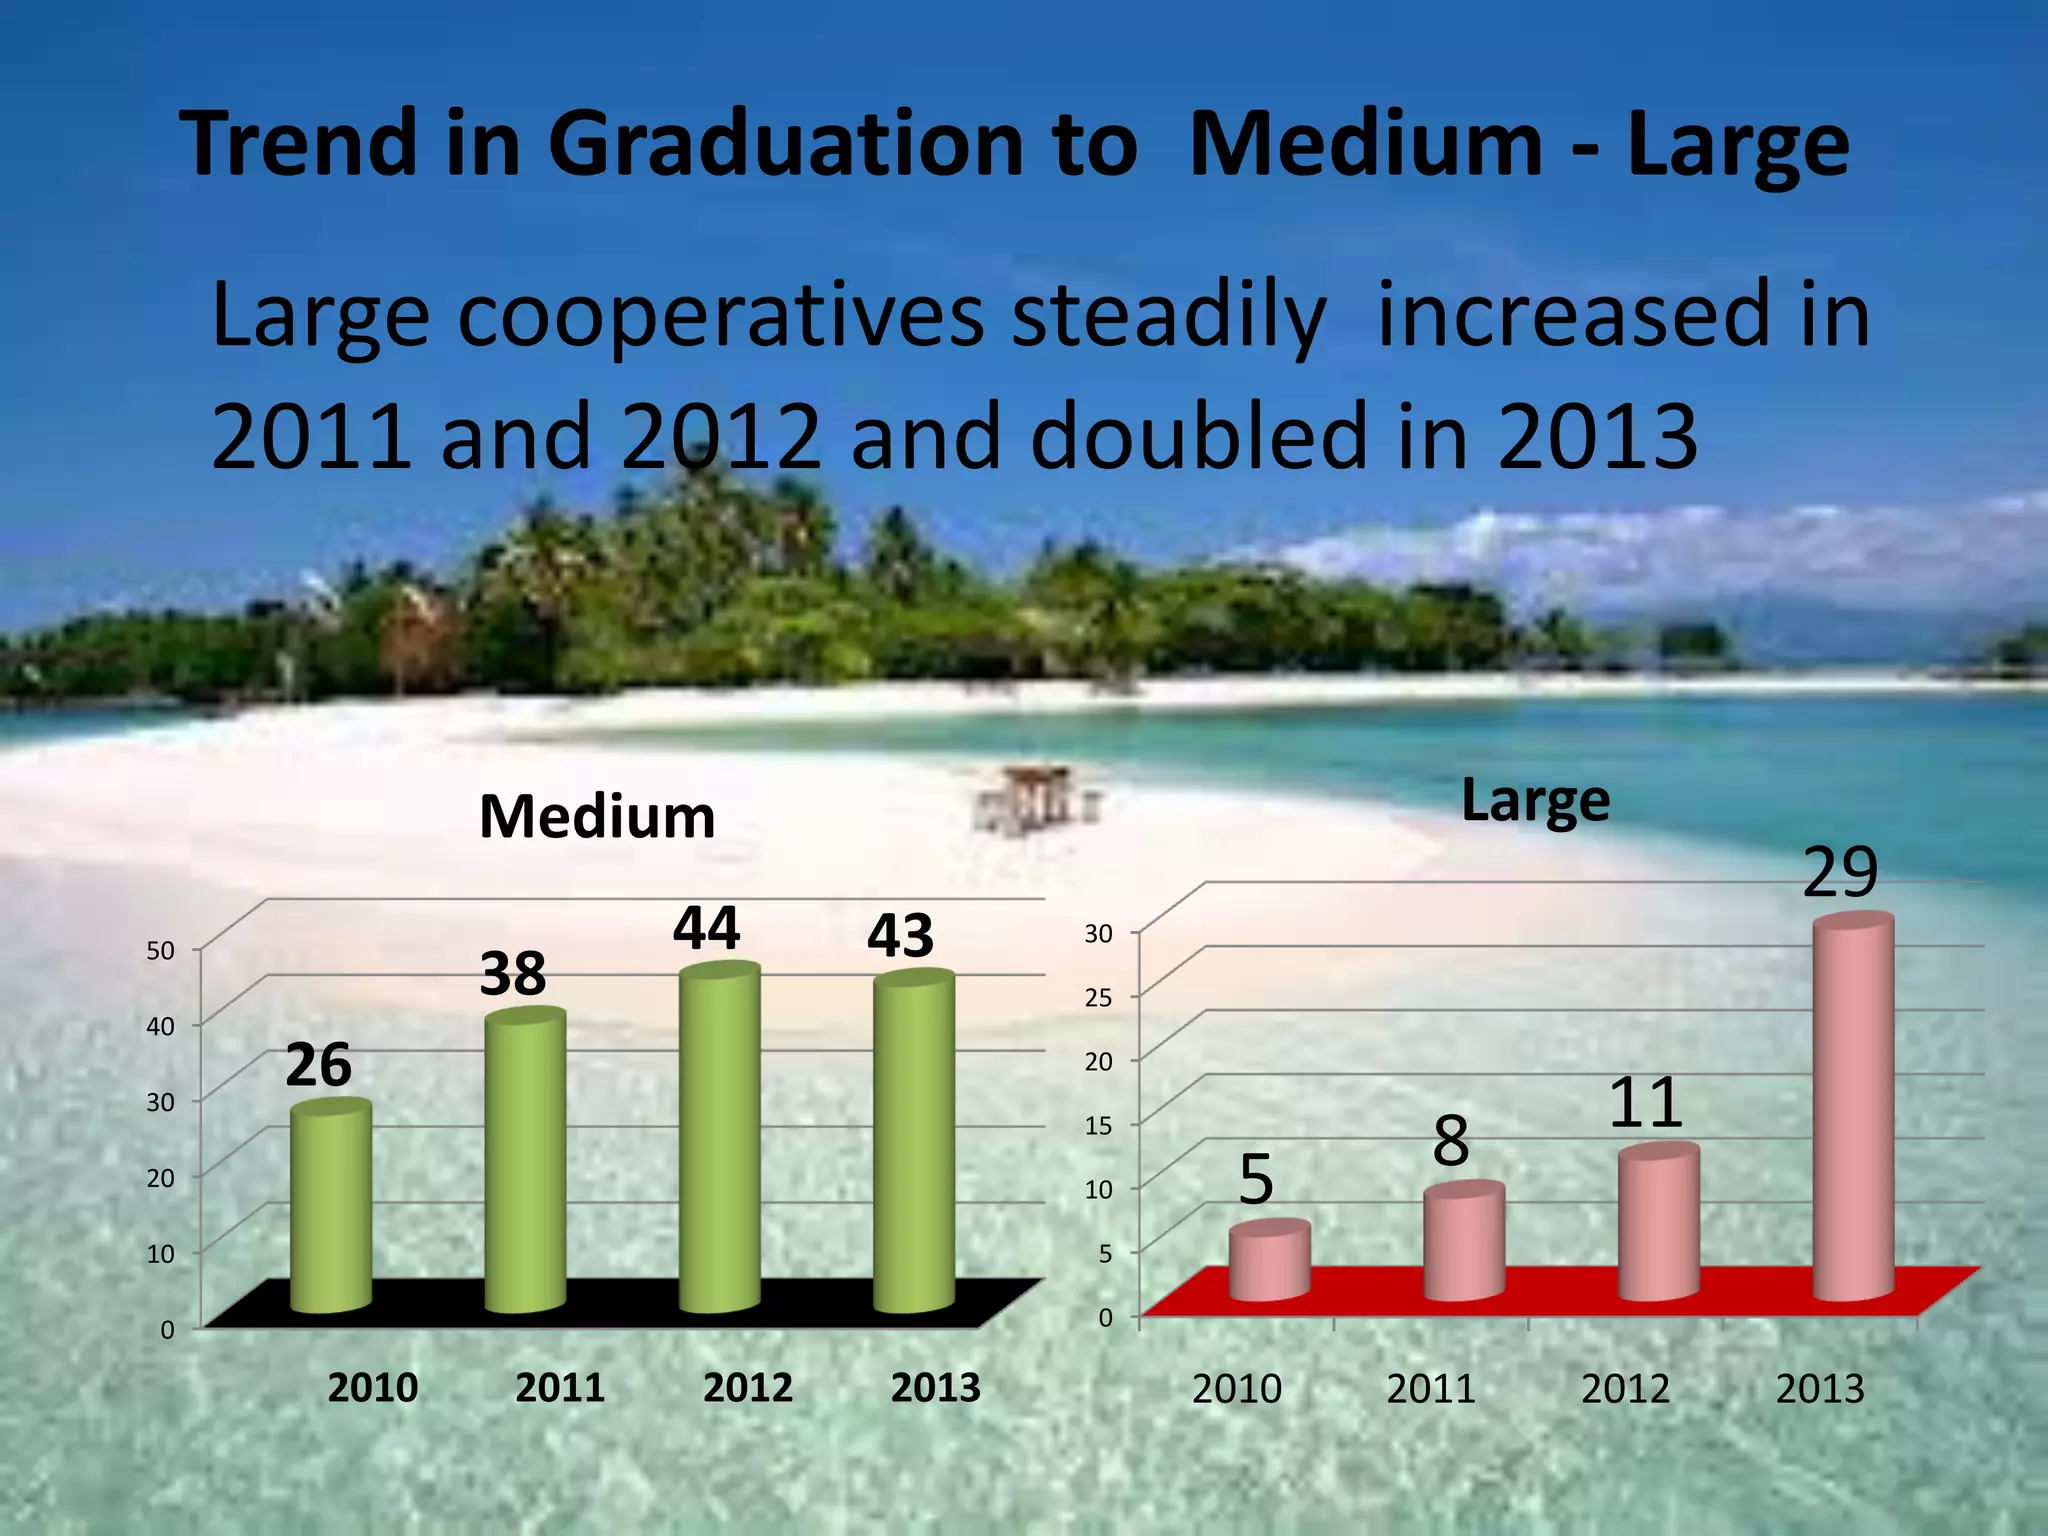
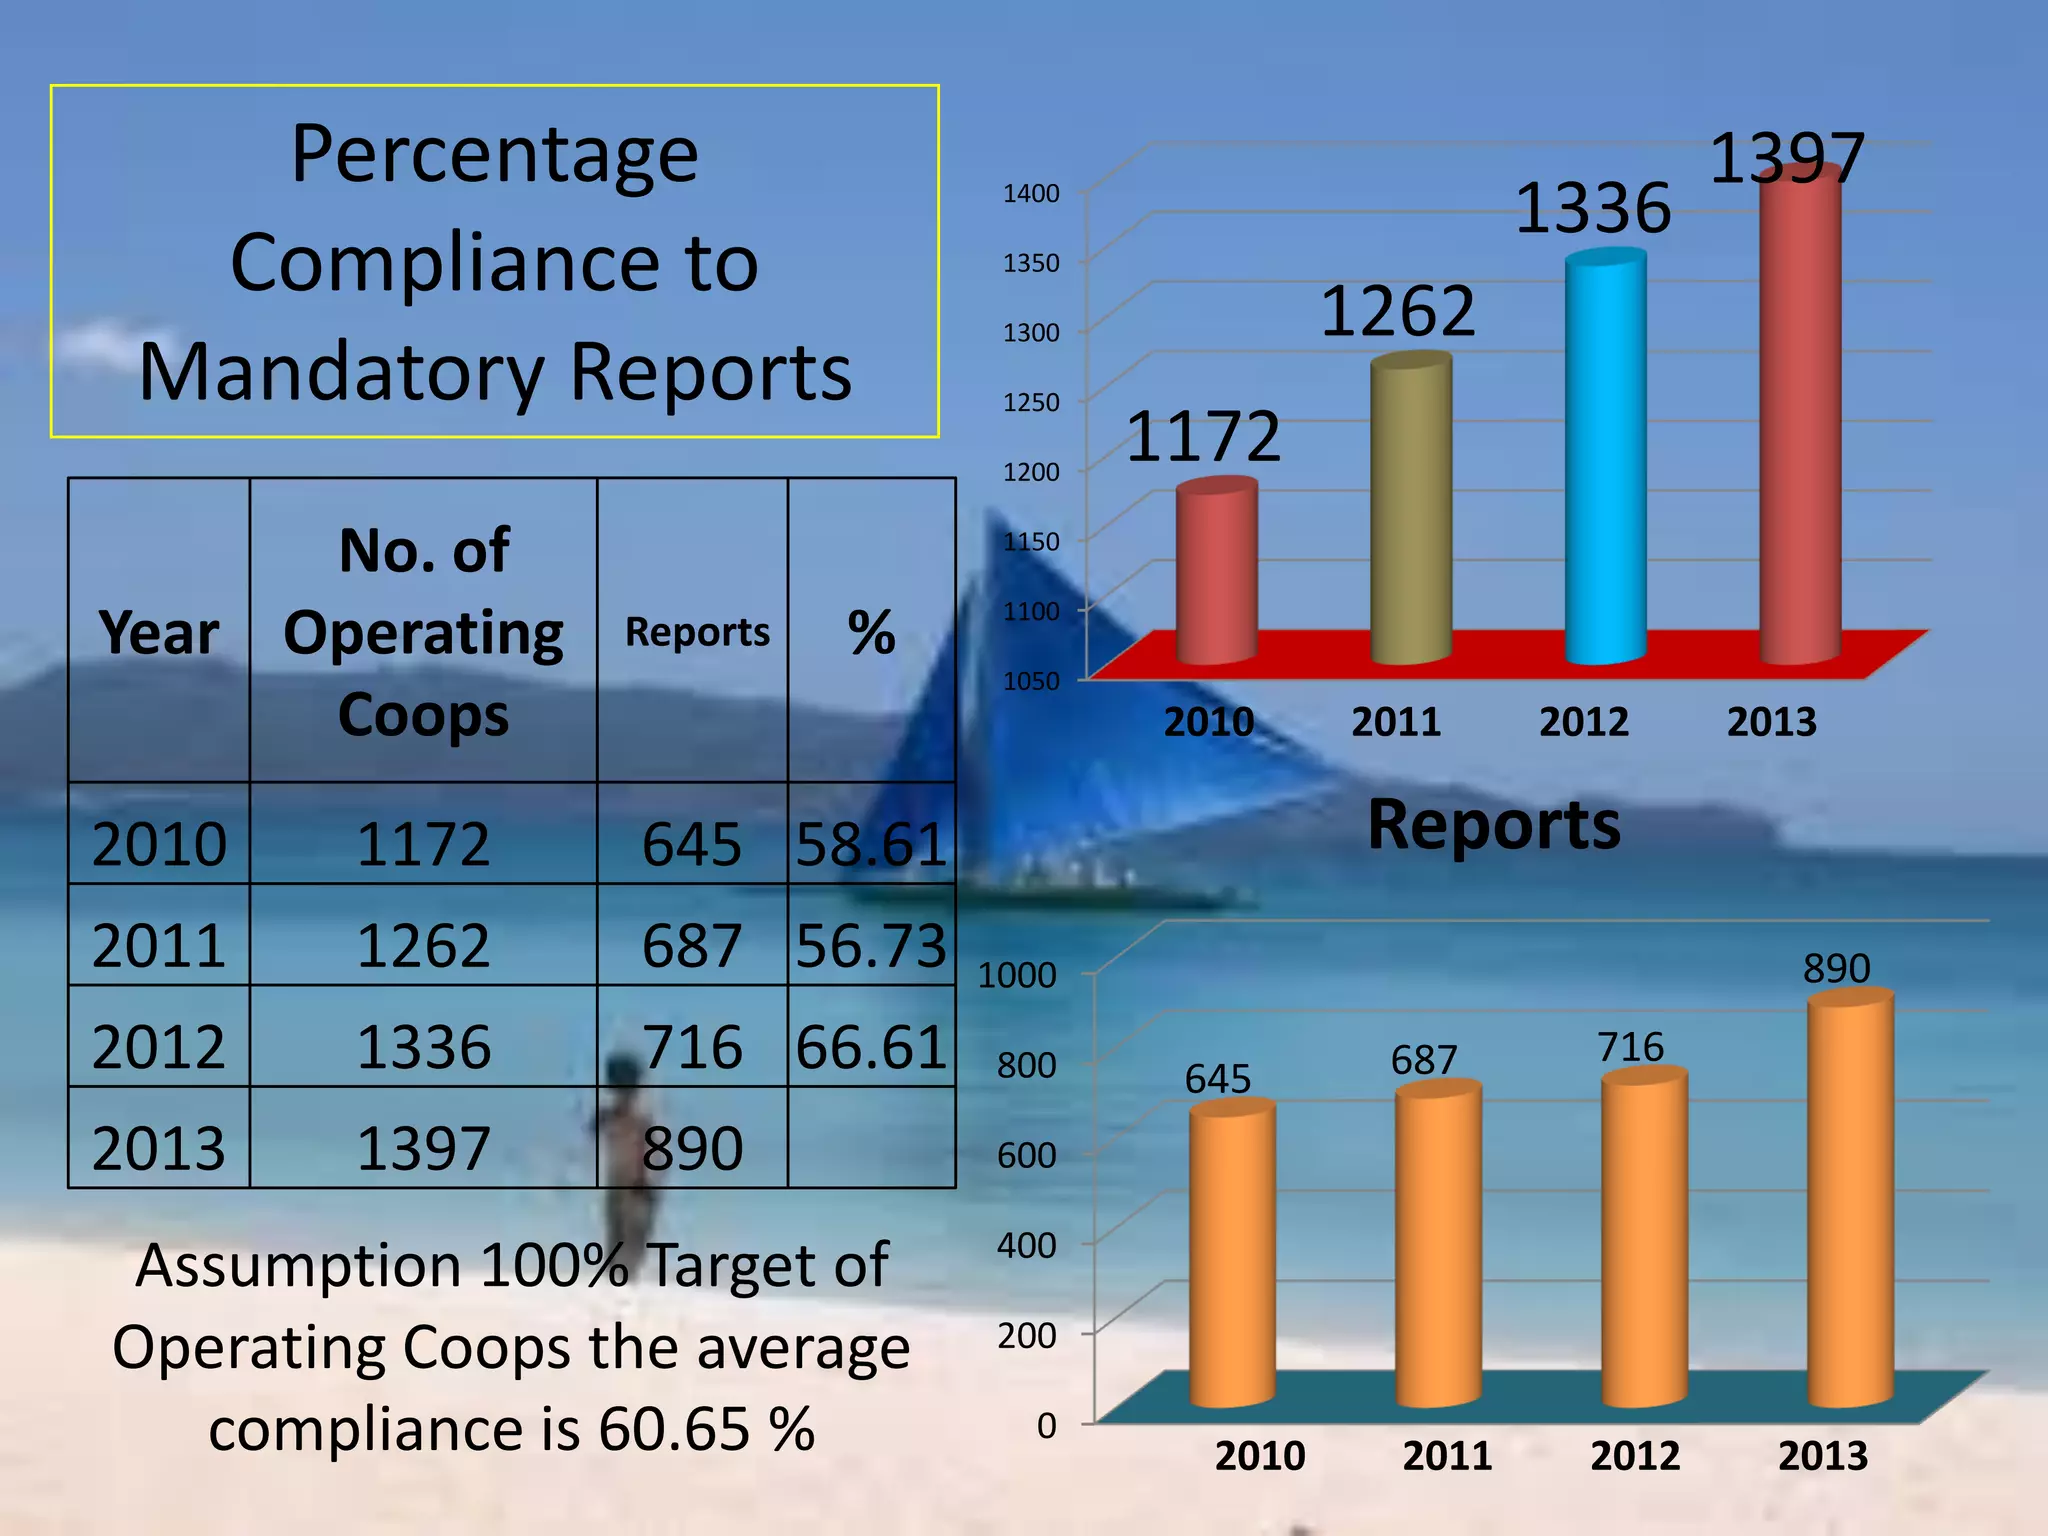
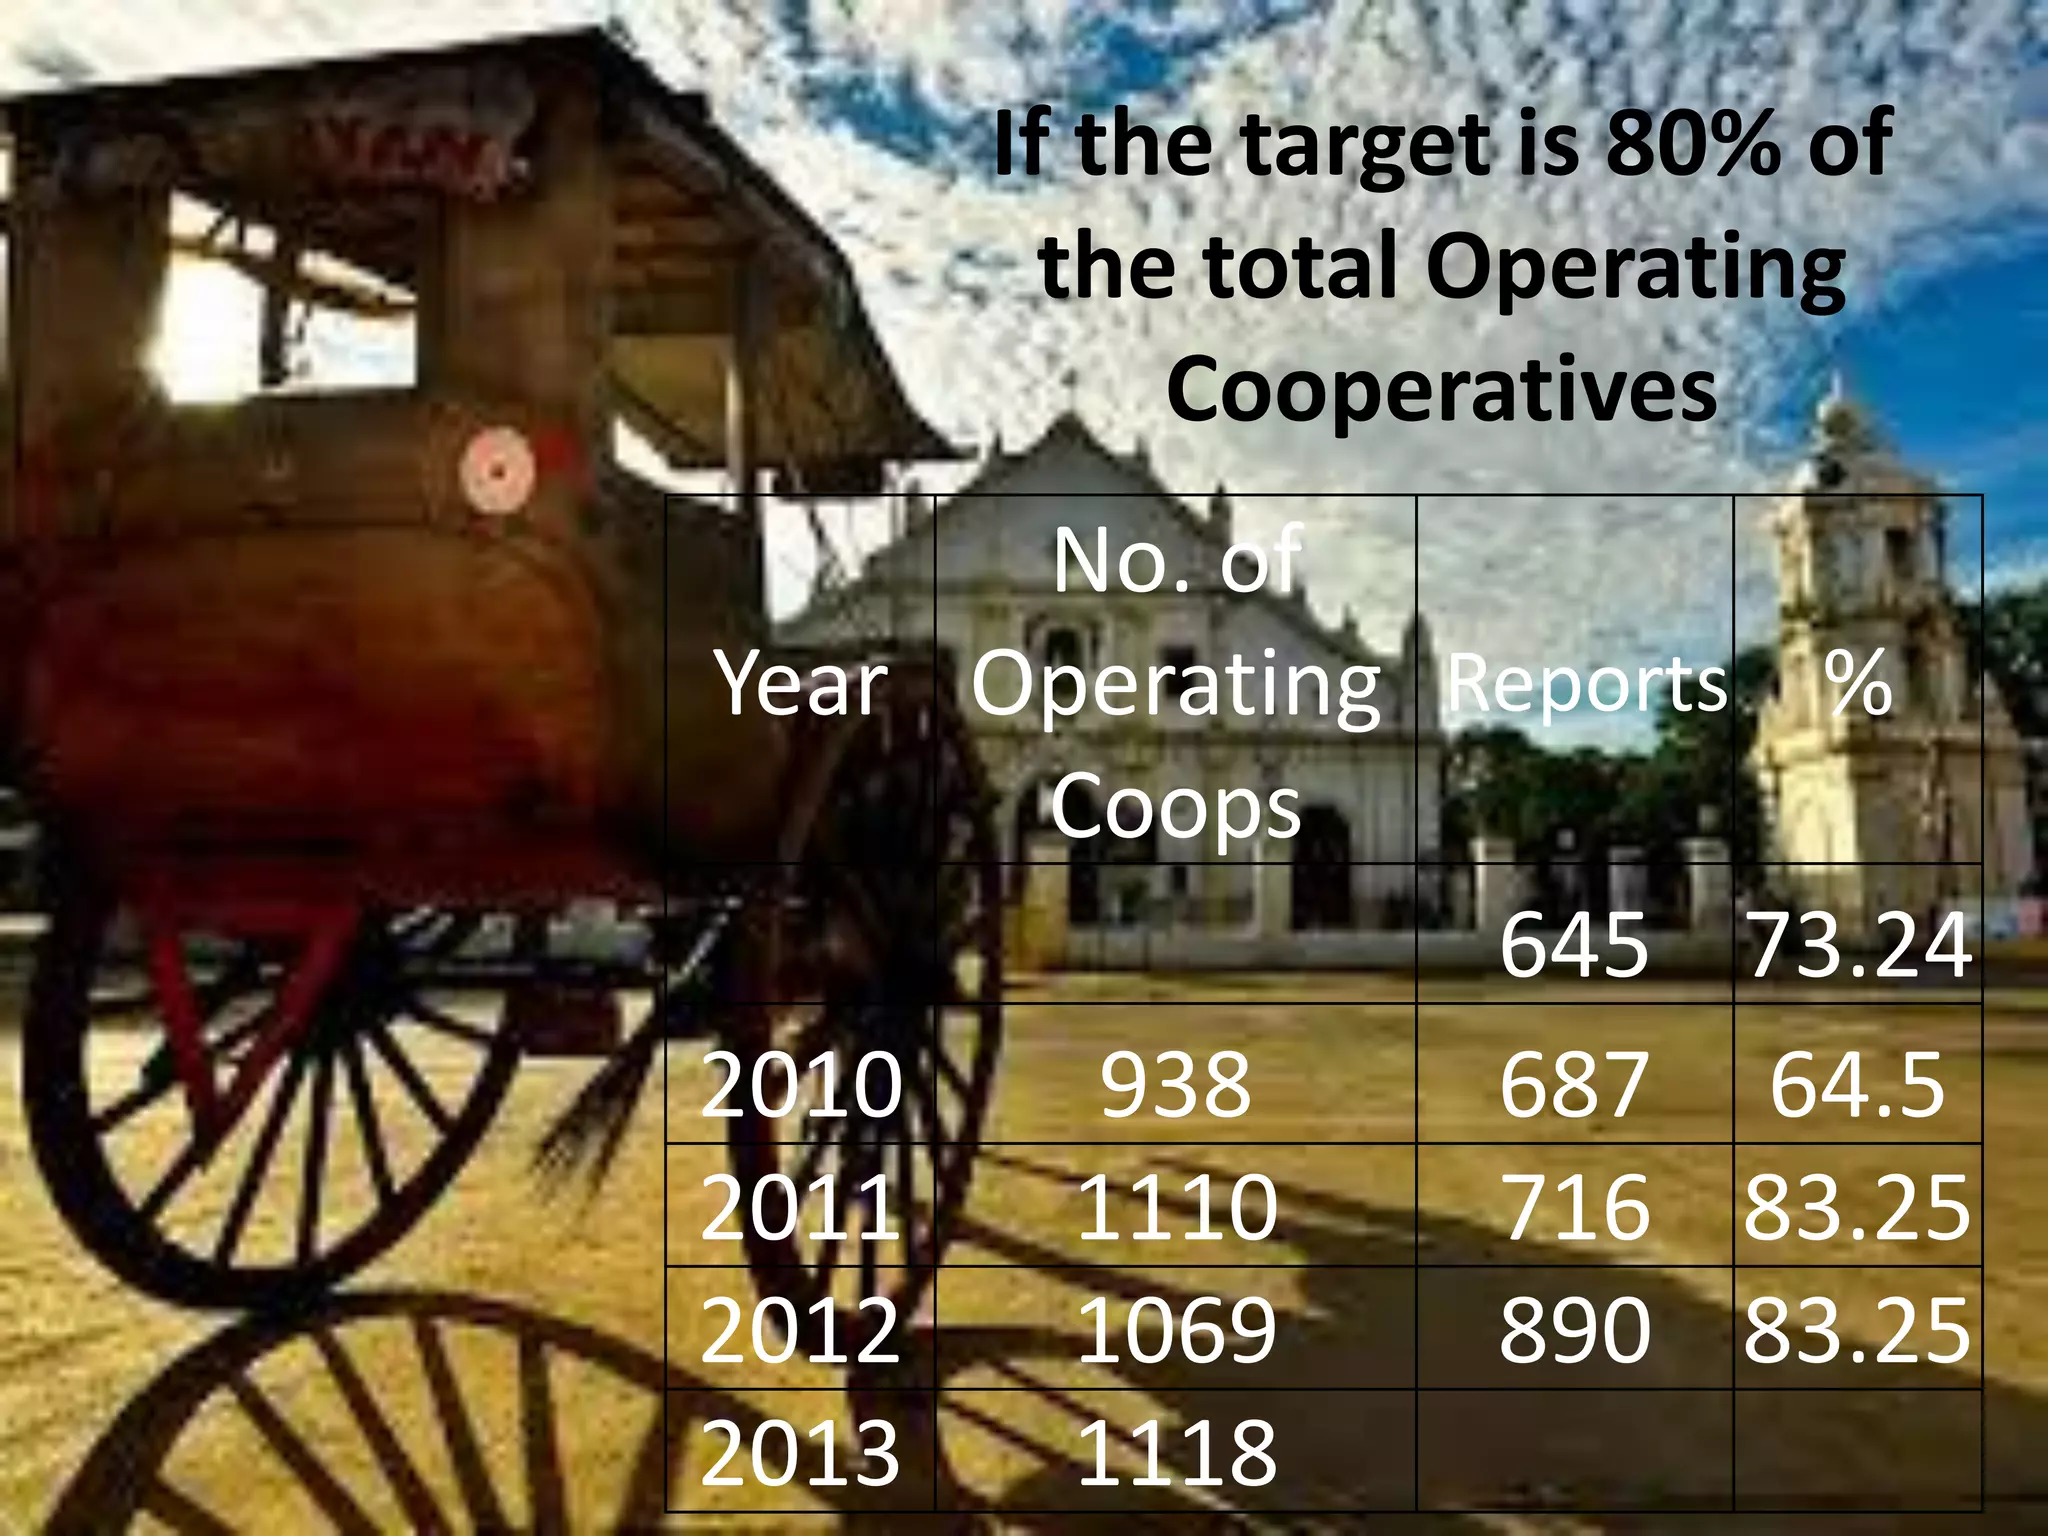


The document presented statistics on cooperatives in Region 1 (Dagupan Extension Office) from 2010-2013. Some key figures included: - A slight increase in registered cooperatives from 2010-2011, then a decrease from 2011-2013. - Increases in total assets, membership, and business volume over the years. - Graduation of cooperatives to larger size categories (micro to small, small to medium, etc.) varied year-to-year. - Compliance with mandatory reporting was around 60-80% of operating cooperatives on average. The document concluded with recommendations to further improve cooperative performance and compliance.