Download to read offline
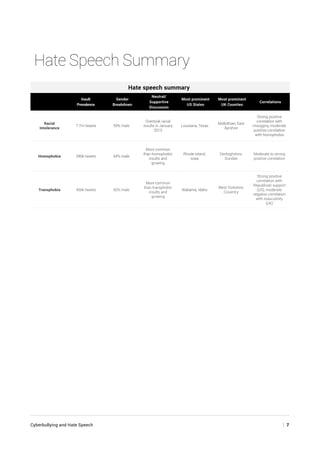

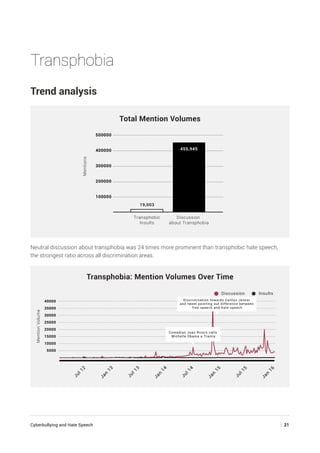
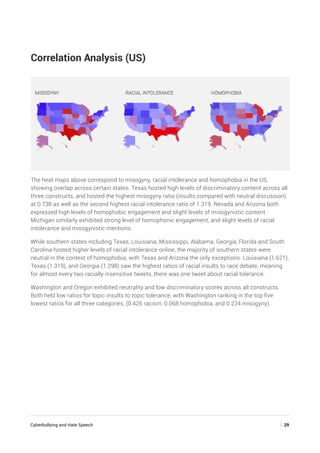

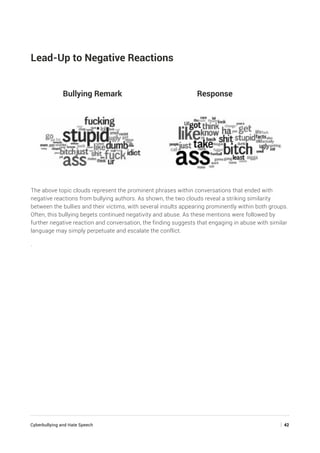
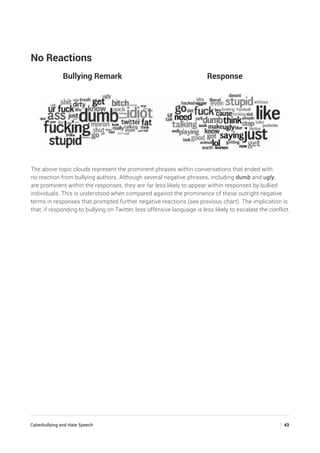

This study analyzes nearly 19 million tweets to assess the prevalence and correlation of hate speech and online bullying in the UK and US. Findings suggest that racial intolerance is the most common form of hate speech, particularly in southern US states, and that there are significant challenges and progress related to homophobia and transphobia. The project highlights the importance of educators in promoting diversity and cautions against generalizations that could stigmatize specific groups.


![Mexico Presentation[1]](https://cdn.slidesharecdn.com/ss_thumbnails/mexicopresentation1-1208220335196646-8-thumbnail.jpg?width=640&height=640&fit=bounds)


