The document discusses the utilization of machine learning and transfer learning techniques for the recognition of cucumber diseases in Bangladesh, highlighting the economic significance of cucumber farming. Two main approaches are compared: traditional machine learning methods, achieving an accuracy of 89.93% with random forest, and CNN-based transfer learning, with MobileNetV2 attaining the highest accuracy of 93.23%. The study emphasizes the importance of early disease detection to prevent crop losses and improve agricultural productivity.
![Bulletin of Electrical Engineering and Informatics
Vol. 10, No. 6, December 2021, pp. 3432~3433
ISSN: 2302-9285, DOI: 10.11591/eei.v10i6.3096 3432
Journal homepage: http://beei.org
Cucumber disease recognition using machine learning and
transfer learning
Md. Jueal Mia, Syeda Khadizatul Maria, Shahrun Siddique Taki, Al Amin Biswas
Department of Computer Science and Engineering, Daffodil International University, Dhaka, Bangladesh
Article Info ABSTRACT
Article history:
Received Jun 3, 2021
Revised Aug 19, 2021
Accepted Oct 12, 2021
Cucumber is grown, as a cash crop besides it is one of the main and popular
vegetables in Bangladesh. As Bangladesh's economy is largely dependent on
the agricultural sector, cucumber farming could make economic and
productivity growth more sustainable. But many diseases diminish the
situation of cucumber. Early detection of disease can help to stop disease from
spreading to other healthy plants and also accurate identifying the disease will
help to reduce crop losses through specific treatments. In this paper, we have
presented two approaches namely traditional machine learning (ML) and
CNN-based transfer learning. Then we have compared the performance of the
applied techniques to find out the most appropriate techniques for recognizing
cucumber diseases. In our ML approach, the system involves five steps. After
collecting the image, pre-processing is done by resizing, filtering, and
contrast-enhancing. Then we have compared various ML algorithms using k-
means based image segmentation after extracted 10 relevant features.
Random forest gives the best accuracy with 89.93% in the traditional ML
approach. We also studied and applied CNN-based transfer learning to
investigate the further improvement of recognition performance. Lastly, a
comparison among various transfer learning models such as InceptionV3,
MobileNetV2, and VGG16 has been performed. Between these two
approaches, MobileNetV2 achieves the highest accuracy with 93.23%.
Keywords:
Cucumber diseases
k-means clustering
Machine learning
MobileNetV2.
Recognition
Transfer learning
This is an open access article under the CC BY-SA license.
Corresponding Author:
Md. Jueal Mia
Department of Computer Science and Engineering
Daffodil International University
Dhaka, Bangladesh
Email: mjueal02@gmail.com
1. INTRODUCTION
The agricultural sector in Bangladesh dominant an important role in the process of driving economic
growth. It contributes 19.6% to the national GDP and provides 63% of employment for the population of
Bangladesh [1]. But one of the factors affecting agricultural production is the plant disease that restricts the
growth of plants and causes major economic losses. Therefore, it is important to recognize plant disease's visual
signs in the initial phase to avoid transmitting the disease to healthy plants and to correctly diagnose plant
disease.
Cucumber (Cucumis sativus), in the Cucurbitaceae gourd family, is a widely cultivated crop that is
one of Bangladesh's most popular vegetables. It is the fourth most extensively grown food crop in the world.
[2]. A fresh and healthy cucumber provides vitamins, iron, calcium, niacin, thiamine, fibers and phosphorus,
and minerals with a cool and refreshing taste [3]. But diseases in cucumber affect the growth of plants which
may reduce the quality and productivity. The major cause of these diseases are pathogenic viruses, fungus, and
bacteria. Most of the diseases are contagious and deadly which causes the spread of the disease to the healthy](https://image.slidesharecdn.com/553096-220202020702/85/Cucumber-disease-recognition-using-machine-learning-and-transfer-learning-1-320.jpg)
![Bulletin of Electr Eng & Inf ISSN: 2302-9285
Cucumber disease recognition using machine learning and transfer learning (Md. Jueal Mia)
3433
plant and damages the plant in quality and quantity. So early detection is essential to prevent the spread of
disease. Cucumber diseases recognition by traditional methods are slow, expensive, laborious, and time-
consuming in large farms. Besides, to consult with experts, farmers may need to travel long in some developing
countries as well as rural areas in Bangladesh. On the other hand, experts may not be able to go to the local
area at right time.
Research in agriculture along with the development of a computer vision approach as well as pattern
recognition has solved many natural limitations. The application of computer vision has proven to play an
signitficant role in agriculture field. Computer vision first began at the beginning of the 1970s which was meant
to mimic human sight and endowing a robot with intelligent behavior [4]. In agriculture, computer vision uses
a technique to monitor plant health including the detection of pests, diseases, and weeds through the computer
eye instead of naked-eye observation.
This paper explores the process of computer vision technology with traditional machine learning (ML)
and CNN based transfer learning and comparing these two techniques to automatically recognize with the best
accuracy of cucumber disease - downy mildew, powdery mildew, mosaic virus, belly rot, scab, and pythium
fruit rot (Cottony leak).
Several researchers have begun to work in the agricultural field on crop disease detection and
recognition with the help of advanced technologoy. Therefore, several approaches have been presented to solve
this problem such as support vector machine (SVM), artificial neural network (ANN), convolutional neural
network (CNN), transfer learning (TL), sparse representations classification (SRC), global-local Singular value
decomposition (GL-SVD), global pooling dilated CNN (GPDCNN), and Hyperspectral imaging (HSI). The
different types of research methodology have been developed to recognize cucumber diseases are described in
the various paper will be discussed here.
Zhou et al. [5] have introduced the image preprocessing technique and SVM for classification. The
accuracy of cucumber downy mildew in their system is 90.00%. Three types of cucumber disease recognition
were considered in [6]. The image processing technology was used in their experimental results like removing
noise, lesion segmentation, smoothing and graying. Then shape, color, and texture features were extracted and
later classified using minimum distance. The average recognition of correct rate got more than 96.00%. Using
hyperspectral imaging technology [7], studied cucumber downy mildew disease where enhancement,
binarization, corrosion, and expansion treatments are carried out for the fusion image to make the spot
characteristic clearer. Their algorithm demonstrated overall detection accuracy of 90.00%. Pawar et al. [8]
developed a system using image processing techniques including nine texture feature extraction using not only
GLCM but also first-order statistical moments methods. Then artificial neural network was used for
classification. They focused on three classes i.e. powdery mildew, and downy mildew, and healthy plant. Their
system achieved an accuracy rate of classification is 80.45%. Youwen et al. [9] using computer image
processing and SVM introduced a new method of cucumber leaf diseases. The experimental results showed
that for cucumber diseased leaf image recognition, SVM is better than neural networks, and also using the
shape and texture features, the recognition accuracy is better than just using the shape feature. Khan et al. [10]
have described an improved saliency method and deep features selection. Here, they utilized five types of
cucumber disease. They achieved an average recognition rate of 98.08% in 10.52 seconds. This improved
method consists of five steps where deep features are extracted using VGG19 taking 2000 features and finally
classification using SVM. Zhang et al. [11] demonstrated the recognition of seven types of diseases in
cucumber plant leaves. Here they used the K-means clustering algorithm for the segmentation of the region of
disease. Combined shape and color features are extracted from lesion information and then classified using
sparse representation (SR). Their method reached an overall accuracy of 85.7%. Zhang et al. [12] offered a
procedure for the identification and classification of cucumber disease on the basis of fusing superpixel
clustering, hybrid action of EM algorithm, and classification using SVMs and achieved accuracy above
90.00%. Ma et al. [13] constructed 1184 images data for four cucumber disease. They applied a deep
convolutional neural network (CNN). They proved that the performance of DCNN considerably better than
conventional classifiers (random forest (RF) and SVM) where the recognition accuracy of their proposed
method was 93.4%. Zhang and Wang [14] used global-local singular values to extract features and constituting
the key-point vector and finally applied SVM to classify cucumber disease. But the main drawback of their
new proposed method is that extracts the singular values of a few sub-blocks, needs more computational efforts.
Zhang et al. [15] also have proposed a solution for identifying six common cucumber plant diseases by using
global pooling dilated CNN. This approach has a disease recognition accuracy rate of over 94.00 percent.
Zhang et al. [16] used the current state-of-the-art method transfer learning with EfficientNet. They have
developed a classification model for the four types of cucumber disease and achieved model accuracy is
97.00%. They also proved that the most effective method for their study is EfficientNet-B4.](https://image.slidesharecdn.com/553096-220202020702/85/Cucumber-disease-recognition-using-machine-learning-and-transfer-learning-2-320.jpg)
![ ISSN: 2302-9285
Bulletin of Electr Eng & Inf, Vol. 10, No. 6, December 2021 : 3432 – 3443
3434
2. RESEARCH METHOD
This section has divided into four sub-sections named as data description and augmentation, system
overview, conventional ML approach, and CNN based transfer learning. The details of the section has listed
below.
2.1. Data description and augmentation
Some major diseases caused by viruses, bacteria, fungi, nematode, and some non-infectious diseases
has affected cucumber [17]. These diseases include downy mildew, powdery mildew, mosaic virus, belly rot,
scab, and pythium fruit rot (Cottony leak) are used in this work for identification and classification. Sample
images of cucumber disease affected has shown in Figure 1.
(a) (b) (c) (d) (e) (f)
Figure 1. Common cucumber disease in Bangladesh, (a) downy mildew, (b) powdery mildew, (c) mosaic
virus, (d) belly rot, (e) scab, (f) cottony leak
The main reason to use data augmentation in this study is to train the ML models or transfer learning
model on more data. Data augmentation techniques can expand the insufficient amount of training data by
adding slightly modified on already existing data. The commonly used data augmentation techniques are
flipping, rotation, cropping, shifting, scaling, translation, noise, and color jittering. In our work, we selected
different methods of data augmentation such as rotation, shifting, shearing, zooming, and flipping to our
original dataset. For rotation, a random angle generated from -40 and 40 degrees were set to the images. The
images were shifted via width and height range arguments along X-axis and Y-axis by 20%. The images were
also sheared by 20% and for zooming, they were zoom-in or zoom-out by 20%. For flipping, we set it
horizontally. From the field level, we have collected 525 images data of cucumber. After augmenting the data,
we have total 4200 images data. We have partitioned this dataset into train, validation, and test set. Total 20%
data has kept for the testing purpose. Among the rest of the 80% data, 20% data used for the validation of the
models and the remaining data is for training of the models.
2.2. System overview
The proposed system for recognizing cucumber diseases is shown in Figure 2. The system used the
proposed technique of disease recognition. The user needs to send the cucumber disease image to the expert
system. The system will process the input image and then will apply different image processing algorithms.
After analyzing the image with a qualified and training dataset, the system will provide the name of the disease
that will be sent to the user device.
Figure 2. Proposed expert system for cucumber disease recognition](https://image.slidesharecdn.com/553096-220202020702/85/Cucumber-disease-recognition-using-machine-learning-and-transfer-learning-3-320.jpg)
![Bulletin of Electr Eng & Inf ISSN: 2302-9285
Cucumber disease recognition using machine learning and transfer learning (Md. Jueal Mia)
3435
2.3. Conventional machine learning approach
We have used both the concept of conventional ML approach for cucumber disease recognition. In
the agricultural field, ML has developed many applications and tools to help farmers improve productivity by
feeding machine-learning systems with the acquired data collection. A review paper showed that ML has been
applied in multiple agricultural sectors such as crop management, yield prediction, livestock management,
disease detection, water management, and soil management [18]. So it is mostly used to increase crop
productivity and quality. In our work, our approach proposes a method for recognition of cucumber disease
using ML is presented in Figure 3.
Figure 3. Flow diagram for cucumber disease recognition by ML approach
Image acquisition is the first stage of any vision system which the process of retrieving an image from
a source. If the image has not been obtained satisfactorily, then the expected outcome may not be achieved.
After the image has been acquired, it can be processed through various methods of processing to perform a
specific vision-related task. In this work, we have collected about 6 disease images of cucumber. The collected
images also include healthy.
It can be difficult to obtain good results by relying solely on the raw images. Processing performed
on collected raw data to make it for another processing operation is referred to as data preprocessing [19]. So
in the second step, this image preprocessing is done to improve the image of intelligibility. In this research,
image preprocessing mainly includes image resizing, image filtering, contrast enhancement, and color space
conversion.
− Resizing images are needed for further operation of images.
− Image filtering (noise removal, smoothing of images) is done by using various filtering techniques.
− Contrast enhancement is a technique to improve image quality with clear visibility of image features.
The technique we use for contrast enhancement is histogram equalization.
Image segmentation is a method of dividng a visual image into data several segments and turning it
into something that easier to interpret by simplifying its representation. The K-means clustering technique has
used to segment the image in this study. K-means is very simple to implement and also gives better results
proven by Mia [20] and Habib [21]. The first step is to convert processed RGB images into L*a*b* color space
where L is luminosity layer 'L*' and a*b* is chromaticity-layer. Since RGB color space is highly device-
dependent, and L*a*b* space is a device independent space, this conversion is necessary. To start, we must
convert RGB image pixels to CIE XYZ tri-stimulus color values as described in [22]. The conversion of RGB
to XYZ is shown in (1).
(
𝑋
𝑌
𝑍
) = (
0.412453 0.357580 0.180423
0.212671 0.715160 0.072169
0.019334 0.119193 0.950227
) (
𝑅
𝐺
𝐵
) (1)
The conversion of XYZ to L*a*b* [20] is given as shown in (1)-(5).
L*={
116√
𝑌
𝑌𝑛
3
− 16 𝑖𝑓
𝑌
𝑌𝑛
> 0.008856
903.3
𝑌
𝑌𝑛
𝑜𝑡ℎ𝑒𝑟𝑤𝑖𝑠𝑒
(2)
a*=500 (𝑓 (
𝑋
𝑋𝑛
) − 𝑓 (
𝑌
𝑌𝑛
)) (3)
b*=200 (𝑓 (
𝑌
𝑌𝑛
) − 𝑓 (
𝑍
𝑍𝑛
)) (4)
where,](https://image.slidesharecdn.com/553096-220202020702/85/Cucumber-disease-recognition-using-machine-learning-and-transfer-learning-4-320.jpg)
![ ISSN: 2302-9285
Bulletin of Electr Eng & Inf, Vol. 10, No. 6, December 2021 : 3432 – 3443
3436
𝑓(𝑡) = {
√𝑡
3
𝑖𝑓 𝑡 > 0.008856
7.787𝑡 +
16
116
𝑜𝑡ℎ𝑒𝑟𝑤𝑖𝑠𝑒
(5)
The 'a*' and 'b*' layers contain all of the color information, and K-means clustering is used in
segmentation to label each pixel and segment the image by color in the 'a*b*' space. Euclidean distances are
used to calculate the difference between two colors. If d (a, b) is the euclidean distance where a, b is two-pixel
points then the euclidean distance is presented by (6) is given as (6).
d (a, b)=√(𝑎1 − 𝑏1)2 + (𝑎2 − 𝑏2)2 (6)
Extraction of features of an image is an important process after segmentation to extract the information
for the identification of a disease. The extraction of features is essential for identifying disease because it
provides key information about its visual representation. In our work, we only focus on texture analyses and
statistical features. Texture features such as contrast, energy, homogeneity, correlation, and entropy were
extracted using the GLCM. And for statistical features such as mean, skewness, standard deviation, variance,
and kurtosis are also extracted from the images. These features are defined by (7)-(16).
Contrast: ∑ |𝑖 − 𝑗|2
𝑖,𝑗 𝑝(𝑖, 𝑗) (7)
Correlation: ∑ (𝑖− 𝜇𝑖)(𝑗−𝜇𝑗)𝑝(𝑖,𝑗)
𝜎𝑖𝜎𝑗
𝑖,𝑗 (8)
Energy: ∑ 𝑝(𝑖, 𝑗)2
𝑖,𝑗 (9)
Homogeneity: ∑ 𝑝(𝑖,𝑗)
1+|𝑖−𝑗|
𝑖,𝑗 (10)
Mean: 𝑚 = ∑ 𝑥𝑖𝑝(𝑥𝑖)
𝐿−1
𝑖=0 (11)
Standard deviation: 𝑠 = √{∑ [(𝑥𝑖 − 𝑚)2𝑝(𝑥𝑖)]
𝐿−1
𝑖=0 } (12)
Entropy: ∑ (𝑝(𝑥𝑖) 𝑙𝑜𝑔2 𝑝(𝑥𝑖))
𝐿−1
𝑖=0 (13)
Variance: ∑ [(𝑥𝑖 − 𝑚)2
𝑝(𝑥𝑖)]
𝐿−1
𝑖=0 (14)
Kurtosis:
1
𝑆𝑘
∑ (𝑥𝑖 − 𝑚)𝑘
𝑝(𝑥𝑖)
𝐿−1
𝑖=0 (15)
Skewness:
1
𝑆3
∑ (𝑥𝑖 − 𝑚)3
𝑝(𝑥𝑖)
𝐿−1
𝑖=0 (16)
Image classification is a technique for categorizing images into predefined classes based on various
image features. In this study after extracting 10 features, the classification is performed and compared various
classifiers. In our proposed system, there are 7 predefined classes: Belly Rot, Cottony Leak, Mosaic, Scab,
Powdery Mildew, Downy Mildew, and Healthy one.
RF is a predictive model for classification tasks that is simple, most flexible, and well suited to
multiclass problems similar to our datasets. The RF takes each of the nodes of the tree's prediction and predicts
the final output based on the majority votes. In our study, RF performs better than the other ML approaches.
From RF, we have achieved higher accuracy of 89.93 %.
2.4. CNN based transfer learning
We have also used transfer learning for cucumber disease recognition. Flow diagram of CNN based
transfer learning to recognize the cucumber diseases is shown in Figure 4. The main objective of this paper is
to improve the accuracy of disease identification. Although we have achieved good accuracy through a ML
approach but to understand the performance of the traditional ML approaches compared to other existing
approaches, we also studied transfer learning of plant disease identification and considered choosing the
concept of transfer learning. Transfer learning is a method that usually consists of models that have gained
knowledge through working on a problem from one domain in different but similar domains when there is
limited training data [23]. In recent years, transfer learning has shown its effectiveness in classification
problems and it has arisen as a novel learning method for plant disease identifications. There is a variety of
models in transfer learning but we have used and compared three pre-trained models - InceptionV3,
MobileNetV2, and VGG16 for our work.](https://image.slidesharecdn.com/553096-220202020702/85/Cucumber-disease-recognition-using-machine-learning-and-transfer-learning-5-320.jpg)
![Bulletin of Electr Eng & Inf ISSN: 2302-9285
Cucumber disease recognition using machine learning and transfer learning (Md. Jueal Mia)
3437
Figure 4. Flow diagram of CNN based transfer learning to recognize the cucumber diseases
The dataset has been divided into two sets: training sets and testing set with an 80:20 ratio. We have
again partitioned the training set into training and validation set. Total 20% of the data from the training set
has kept for the validation for the model. In this study, we have seven classes consisted of six diseases of
cucumber and one healthy class. So we used the cross-entropy loss function as it is used in multi-class
classification tasks. To train, Adam optimization was used with a default learning rate of 0.001. The softmax
function is applied as the activation function. Some hyperparameter like: batch size 32, epoch 30, and pre-
trained ImageNet weights are also set to train. MobileNetV2 gives the highest accuracy of 93.23%.
To implement, we used the pre-trained weight of the architectures on the imagenet dataset of 1000
classes. The details of MobileNet architecture for the ImageNet dataset has been explained by Rahman [24].
As we worked on seven classes, so for the training purpose, we discarded 1000 neurons from the output layer
and added 7 neurons in the output layer. We made all the layers trainable when we performed transfer learning
with MobileNet architecture. To reduce the overfitting, we used a dropout layer with rate of 0.5.
3. RESULTS AND DISCUSSION
In this experimental study, six diseases of cucumber and one healthy class are considered. They are
downy mildew, powdery mildew, mosaic virus, belly rot, scab, pythium fruit rot (Cottony leak), and healthy
plant. Here, we have used two different approaches for cucumber disease recognition. The first is a traditional
ML approach, and the second is a CNN-based transfer learning approach, which yielded the best results in
terms of cucumber disease recognition.
The very first step we followed is to image acquisition. In the ML approach, image preprocessing is
performed through image resizing, filtering, and contrast-enhancing after collecting the images. The RGB
image is converted into L*a*b* color space using color space conversion. To extract the feature, the disease-
affected segment is chosen from the three clustered images using K-means clustering with k=3. Using two
feature sets- 5 texture and 5 statistical features are retrieved from segmented images. Then various classifiers
like RF, IBk, and KStar are used and also compared for classification to understand the individual model's
performance. The stepwise effect of changes from image acquisition to image segmentation is depicted in detail
in Figure 5. The value of extracted features is illustrated from a pair of two diseased cucumber presented in
Figure 6.
However, we got good results in the ML approach but for the better performance, we also studied
transfer learning. When it comes to transfer learning, first, we augmented data then we divided the data into
three different sets named train, validation and test set into a specific ratio, e.g., 60% for training, 20% for
validation and 20% for testing purpose. After data augmentation, three of the pre-trained models are applied.
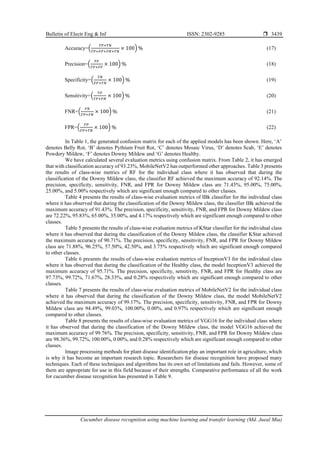
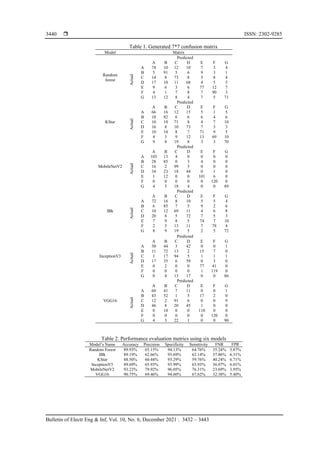
We have analyzed the performance of the traditional ML approach and CNN-based transfer learning
approach through the performance metrics of a classification model [25]. We plotted the confusion matrix
generated by each of the model. The multiclass confusion matrix, M is an n * n square matrix that has n rows
and n columns, totaling n2
entries [26]. Each model produces a 7*7 confusion matrix as we have worked on
seven classes. Performance evaluation matrices for multiclass confusion matrix is shown in [27]. The following
formula is used to calculate the performance evaluation metrics in percentage: accuracy, precision, specificity,
sensitivity, FNR, and FPR.](https://image.slidesharecdn.com/553096-220202020702/85/Cucumber-disease-recognition-using-machine-learning-and-transfer-learning-6-320.jpg)
![ ISSN: 2302-9285
Bulletin of Electr Eng & Inf, Vol. 10, No. 6, December 2021 : 3432 – 3443
3442
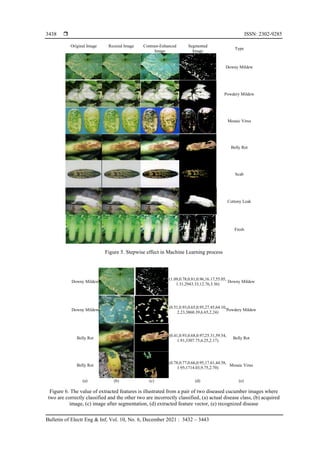
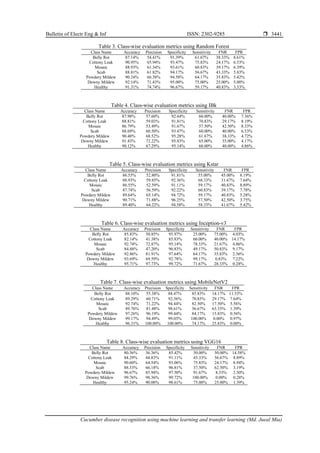
Table 9. Comparative analysis of our work and existing work for cucumber disease recognition
Research work
Number
of class
Original
Dataset
Technique
Used
Segmentation
Algorithm
Feature
Set
Best Classifier Accuracy
This paper 7 525 ML K-means Clustering 10 MobileNetV2 93.23%
TL
Zhou et al. [5] 2 320 ML Gray level histogram 11 SVM 90.00%
Pixia et al. [6] 3 75 ML Lesion segmentation 13 Minimum Distance 96.00%
Tian et al. [7] 2 20 HSI NM NM NM 90.00%
Pawar et al. [8] 3 NM ANN NM 9 ANN 80.45%
Youwen et al. [9] 2 40 ML Statistic pattern recognition NM SVM 100.00%
Khan et al. [10] 5 940 ML Sharif saliency-based segmentation NM SVM 98.08%
Zhang et al. [11] 7 420 ML K-means Clustering NM Sparse Representation
(SR)
85.70%
Zhang et al. [12] 5 300 ML Super pixels and EM NM SVM 90.00%
Ma et al. [13] 4 1184 Deep CNN Comprehensive color feature with
region growing
NM DCNN 93.40%
Zhang et al. [14] 3 300 ML Watershed algorithm NM SVM 92.00%
Zhang et al. [15] 7 700 Global pooling
dilated CNN
K-means Clustering NM GPDCNN 94.65%
Zhang et al. [16] 4 2816 TL NM NM EfficientNet-B4-
Ranger
97.00%
*NM: Not Mentioned
However, the performance of any method depends on the amount of data, hardware dependency, and
computationally expensive. Though most of the techniques achieved good accuracy, in some paper [6], [7], [9]
the amount of data is insufficient which could affect the model's training and the capacity to correctly recognize
the diseases. Some studies [5]-[9], [14], [16] worked on very few diseases of cucumber. While some
approaches, such as deep CNN, hyperspectral-imaging technology, CNN have good accuracy, they also have
a high computational expense, hardware dependency, high cost. In comparison to other works, we can say that
our method yields a better result. However, there is still some need for improvement. Therefore, the future
works could be to increase datasets and work on a much broader variety of cucumber disease.
4. CONCLUSION
Modern techniques such as automatic recognition of disease should be available to farmers so that
they can give healthy and profitable cucumber crops. Our proposed solution will help farmers to grow more
crops by detecting and identifying diseases easily that will ensure sustainable economic growth through
increased quality and quantity of crops. Here, we compared traditional ML and transfer learning approaches.
After capturing the images of cucumber, preprocessed was done by resizing, filtering, and contrast-enhancing.
To segment the images, we choose k-means clustering. After segmented images, 10 features are extracted. In
traditional ML, RF achieved high accuracy of 89.93%. To understand the performance compared to other
approaches, we also investigated transfer learning. We found that the MobileNetV2 model of transfer learning
achieves the highest accuracy with 93.23% among these two approaches.
REFERENCES
[1] “Nations Encyclopedia,” [Online]. Available: https://www.nationsencyclopedia.com/economies/Asia-and-the-
Pacific/Bangladesh-AGRICULTURE.html [Last accessed on Oct 18, 2021]
[2] A. Lutfa, F. A. Happy and F. Yeasmin, "Production process and marketing system of cucumber: A socioeconomic
study in Mymensingh district of Bangladesh," SAARC Journal of Agriculture, vol. 17, no. 1, pp. 135-147, 2019.
[3] Z. Khan, A. H. Shah, R. Gul, A. Majid, U. Khan and H. Ahmad, "Morpho-agronomic characterization of cucumber
germplasm for yield and yield associated traits," International Journal of Agronomy and Agricultural Research, vol.
6, no. 1, pp. 1-6, 2015.
[4] R. Szeliski, “Computer vision: algorithms and applications,” Springer Science & Business Media, 2010.
[5] B. Zhou, J. Xu, J. Zhao, A. Li and Q. Xia, "Research on cucumber downy mildew detection system based on SVM
classification algorithm," In 3rd international conference on material, mechanical and manufacturing engineering
(IC3ME 2015), 2015, doi: 10.2991/ic3me-15.2015.324.
[6] D. Pixia and W. Xiangdong. "Recognition of greenhouse cucumber disease based on image processing technology,"
Open Journal of Applied Sciences, vol. 3, no. 01, pp. 27-31, 2013, doi: 10.4236/ojapps.2013.31B006.
[7] Y. Tian and L. Zhang, "Study on the methods of detecting cucumber downy mildew using hyperspectral imaging
technology," Physics Procedia, vol. 33, pp 743-750, doi: 10.1016/j.phpro.2012.05.130.
[8] P. Pawar, V. Turkar and P. Patil, "Cucumber disease detection using artificial neural network," 2016 International
Conference on Inventive Computation Technologies (ICICT), 2016, pp. 1-5, doi:
10.1109/INVENTIVE.2016.7830151.](https://image.slidesharecdn.com/553096-220202020702/85/Cucumber-disease-recognition-using-machine-learning-and-transfer-learning-11-320.jpg)
![Bulletin of Electr Eng & Inf ISSN: 2302-9285
Cucumber disease recognition using machine learning and transfer learning (Md. Jueal Mia)
3443
[9] T. Youwen, L. Tianlai and N. Yan, "The Recognition of Cucumber Disease Based on Image Processing and Support
Vector Machine," 2008 Congress on Image and Signal Processing, 2008, pp. 262-267, doi: 10.1109/CISP.2008.29.
[10] M. A. Khan, T. Akram, M. Sharif, K. Javed, M. Raza and T. Saba, "An automated system for cucumber leaf diseased
spot detection and classification using improved saliency method and deep features selection," Multimedia Tools and
Applications, vol 79, no. 25, pp. 18627-18656, 2020, doi: 10.1007/s11042-020-08726-8.
[11] S. Zhang, X. Wu, Z. You and L. Zhang, "Leaf image based cucumber disease recognition using sparse representation
classification," Computers and electronics in agriculture, vol. 134, pp. 135-141,2017, doi:
10.1016/j.compag.2017.01.014.
[12] S. Zhang, Y. Zhu, Z. You and X. Wu, "Fusion of superpixel, expectation maximization and PHOG for recognizing
cucumber diseases," Computers and Electronics in Agriculture, vol. 140, pp. 338-347, 2017, doi:
10.1016/j.compag.2017.06.016.
[13] J. Ma, K. Du, F. Zheng, L. Zhang, Z. Gong and Z. Sun, "A recognition method for cucumber diseases using leaf
symptom images based on deep convolutional neural network," Computers and electronics in agriculture, vol. 154,
pp. 18-24, 2018, doi: 10.1016/j.compag.2018.08.048.
[14] S. Zhang and Z. Wang, "Cucumber disease recognition based on Global-Local Singular value decomposition,"
Neurocomputing, vol. 205, pp. 341-348, doi: 10.1016/j.neucom.2016.04.034.
[15] S. Zhang, S. Zhang, C. Zhang, X. Wang and Y. Shi, "Cucumber leaf disease identification with global pooling dilated
convolutional neural network," Computers and Electronics in Agriculture, vol. 162, pp. 422-430.
[16] P. Zhang, L. Yang and D. Li, "EfficientNet-B4-Ranger: A novel method for greenhouse cucumber disease recognition
under natural complex environment," Computers and Electronics in Agriculture, vol. 176, p. 105652, 2020, doi:
10.1016/j.compag.2020.105652.
[17] R. Shankar, S. Harsha and R. Bhandary, "A practical guide to identification and control of cucumber diseases,"
Tropica seeds pvt. Ltd, vol. 54, 2014.
[18] K. G. Liakos, P. Busato, D. Moshou, S. Pearson and D. Bochtis, "Machine learning in agriculture: A review," Sensors,
vol. 18, no. 8, p. 2674, 2018, doi: 10.3390/s18082674.
[19] Y. Alginahi, “Preprocessing Techniques in Character Recognition,” Character Recognition, Minoru Mori (Ed.),
2010.
[20] M. R. Mia, M. J. Mia, A. Majumder, S. Supriya and M. T. Habib, “Computer vision based local fruit recognition,”
International Journal of Engineering and Advanced Technology (IJEAT), vol. 9, no. 1, pp. 2810-2820, 2019, doi:
10.35940/ijeat.A9789.109119.
[21] M. T. Habib, M. J. Mia, M. S. Uddin and F. Ahmed, "An in-depth exploration of automated jackfruit disease
recognition," Journal of King Saud University-Computer and Information Sciences, 2020, doi:
10.1016/j.jksuci.2020.04.018.
[22] “Color Conversion Algorithms,” [Online]. Available:
http://cs.haifa.ac.il/hagit/courses/ist/Lectures/Demos/ColorApplet2/t_convert.html#RGB%20to%20XYZ%20&%2
0XYZ%20to%20RGB [Last accessed on October 18, 2020]
[23] A. Majumder, A. Rajbongshi, M. M. Rahman, A. A. Biswas, "Local Freshwater Fish Recognition Using Different
CNN Architectures with Transfer Learning," International Journal on Advanced Science, Engineering and
Information Technology, vol. 11, no. 3, pp. 1078-1083, 2021, doi: 10.18517/ijaseit.11.3.14134.
[24] M. M. Rahman, A. A. Biswas, A. Rajbongshi and A. Majumder, "Recognition of local birds of Bangladesh using
MobileNet and Inception-v3," International Journal of Advanced Computer Science and Applications, vol. 11, no.
8, pp. 309-316, 2020, doi: 10.14569/IJACSA.2020.0110840.
[25] A. A. Biswas, M. M. Rahman, A. Rajbongshi and A. Majumder, "Recognition of Local Birds using Different CNN
Architectures with Transfer Learning," 2021 International Conference on Computer Communication and Informatics
(ICCCI), 2021, pp. 1-6, doi: 10.1109/ICCCI50826.2021.9402686.
[26] S. K. Maria, S. S. Taki., M. J. Mia, A. A. Biswas., A. Majumder, F. Hasan, “Cauliflower Disease Recognition Using
Machine Learning and Transfer Learning,” Innovations in Computing. Smart Innovation, Systems and Technologies,
vol 235, pp. 359-375, 2021, doi: 10.1007/978-981-16-2877-1_33.
[27] M. T. Habib, M. R. Mia, M. J. Mia, M. S. Uddin and F. Ahmed, "A Computer Vision Approach for Jackfruit Disease
Recognition," in Proceedings of International Joint Conference on Computational Intelligence, Springer, Singapore,
2020, pp. 343-353, doi: 10.1007/978-981-15-3607-6_28.](https://image.slidesharecdn.com/553096-220202020702/85/Cucumber-disease-recognition-using-machine-learning-and-transfer-learning-12-320.jpg)