
Download to read offline

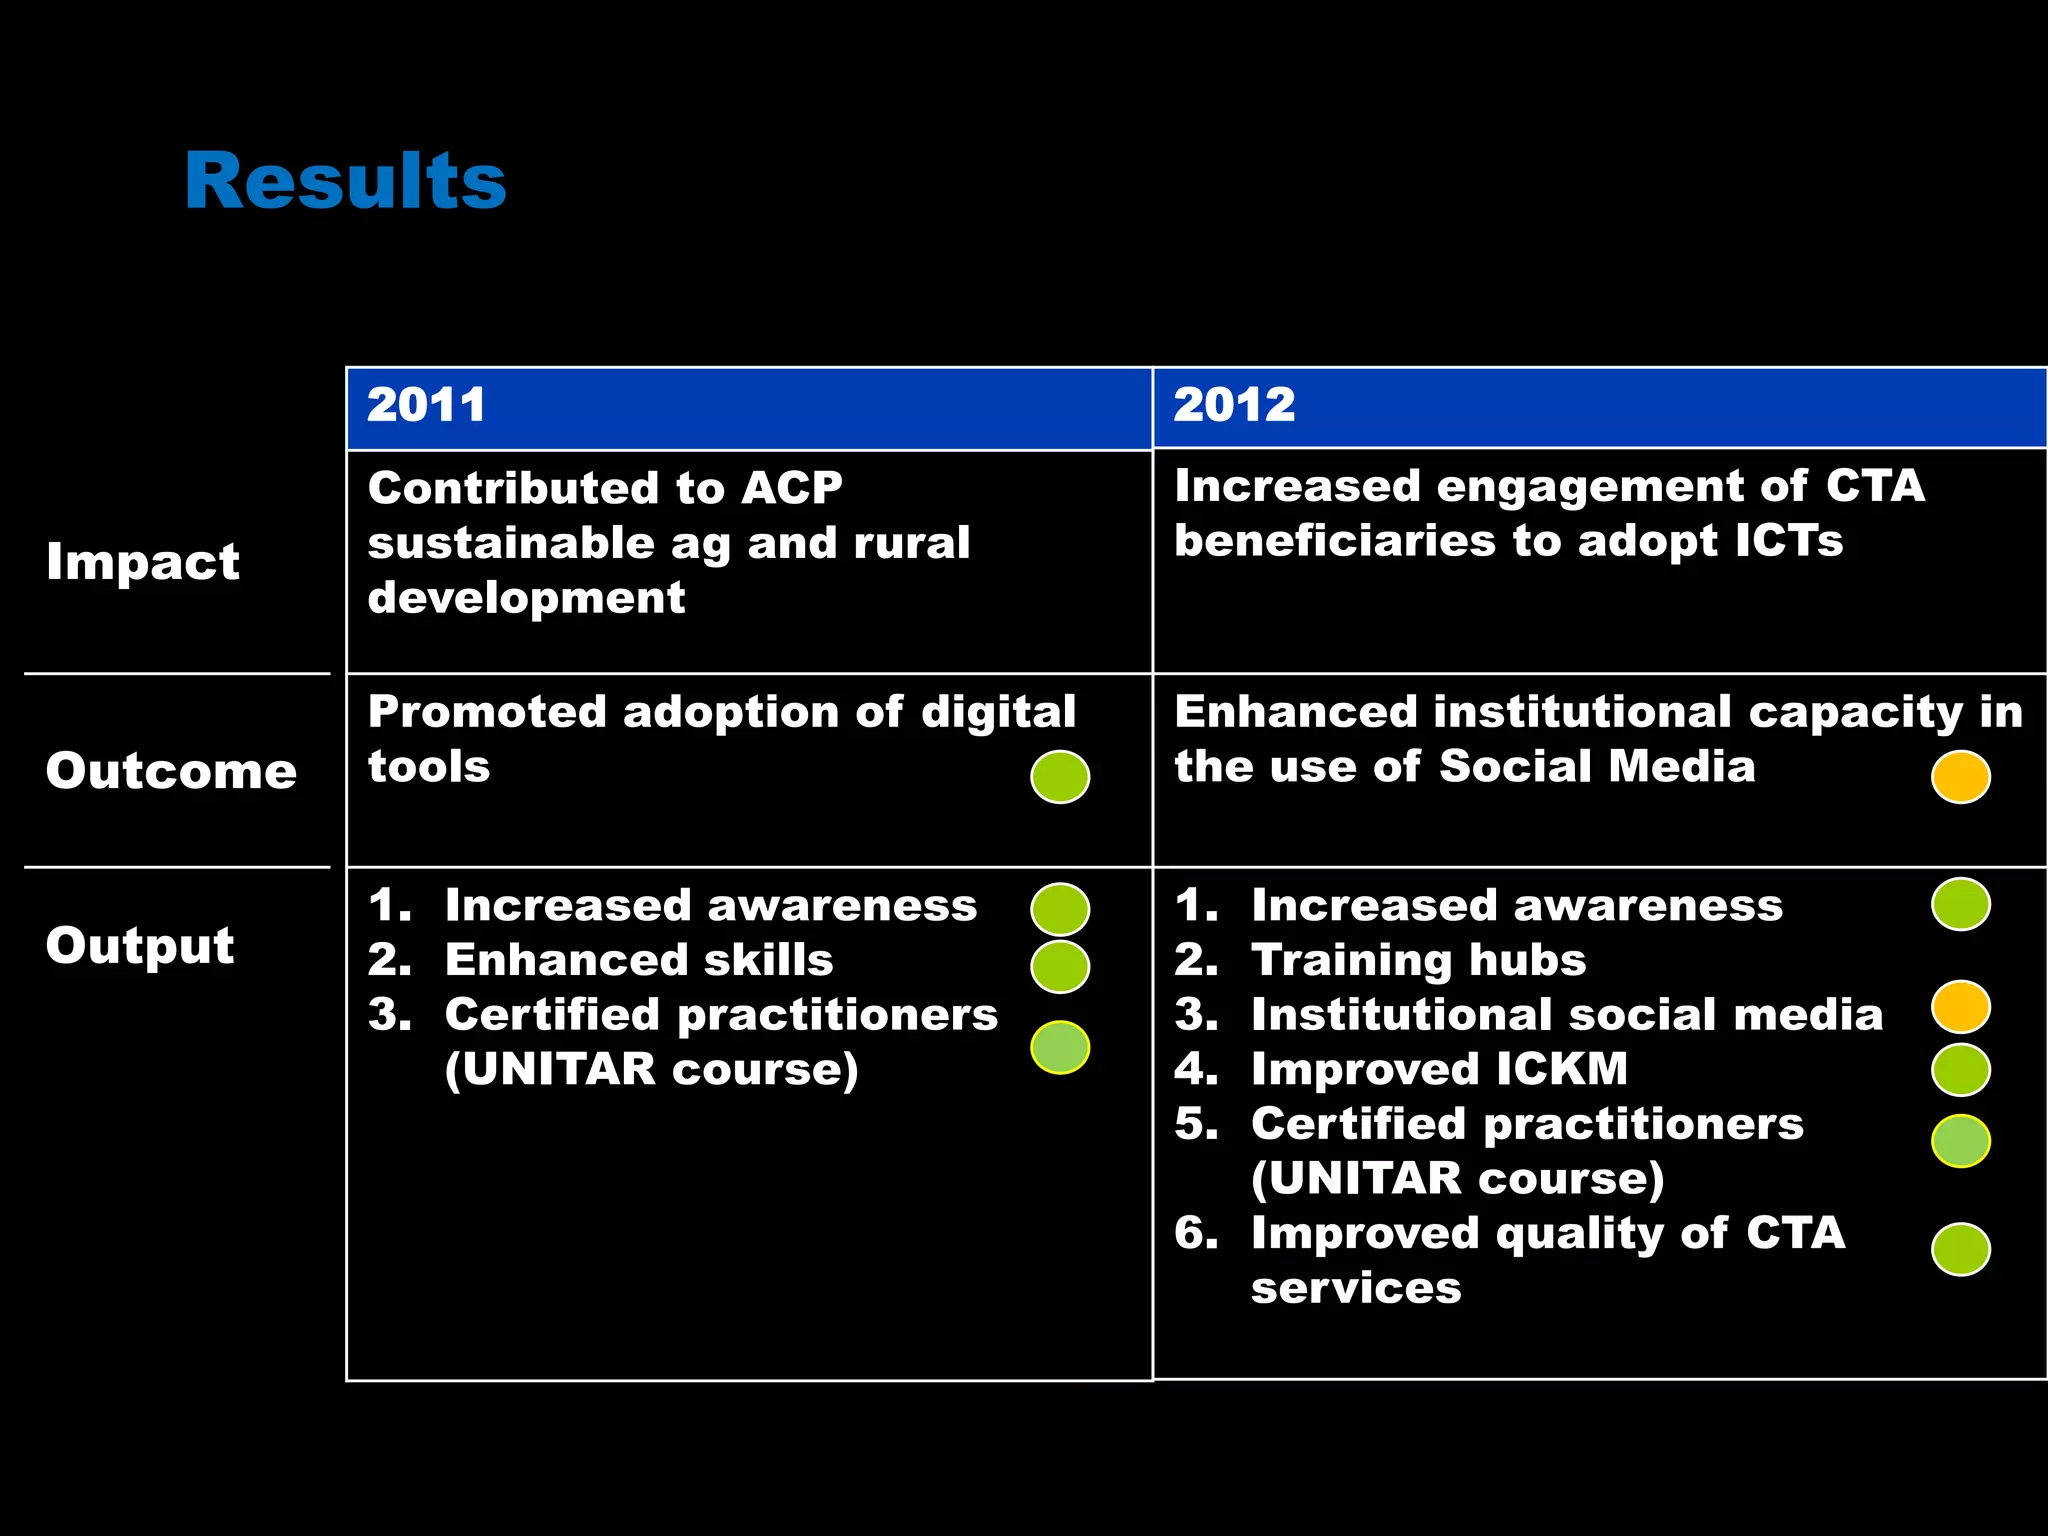
![The training works
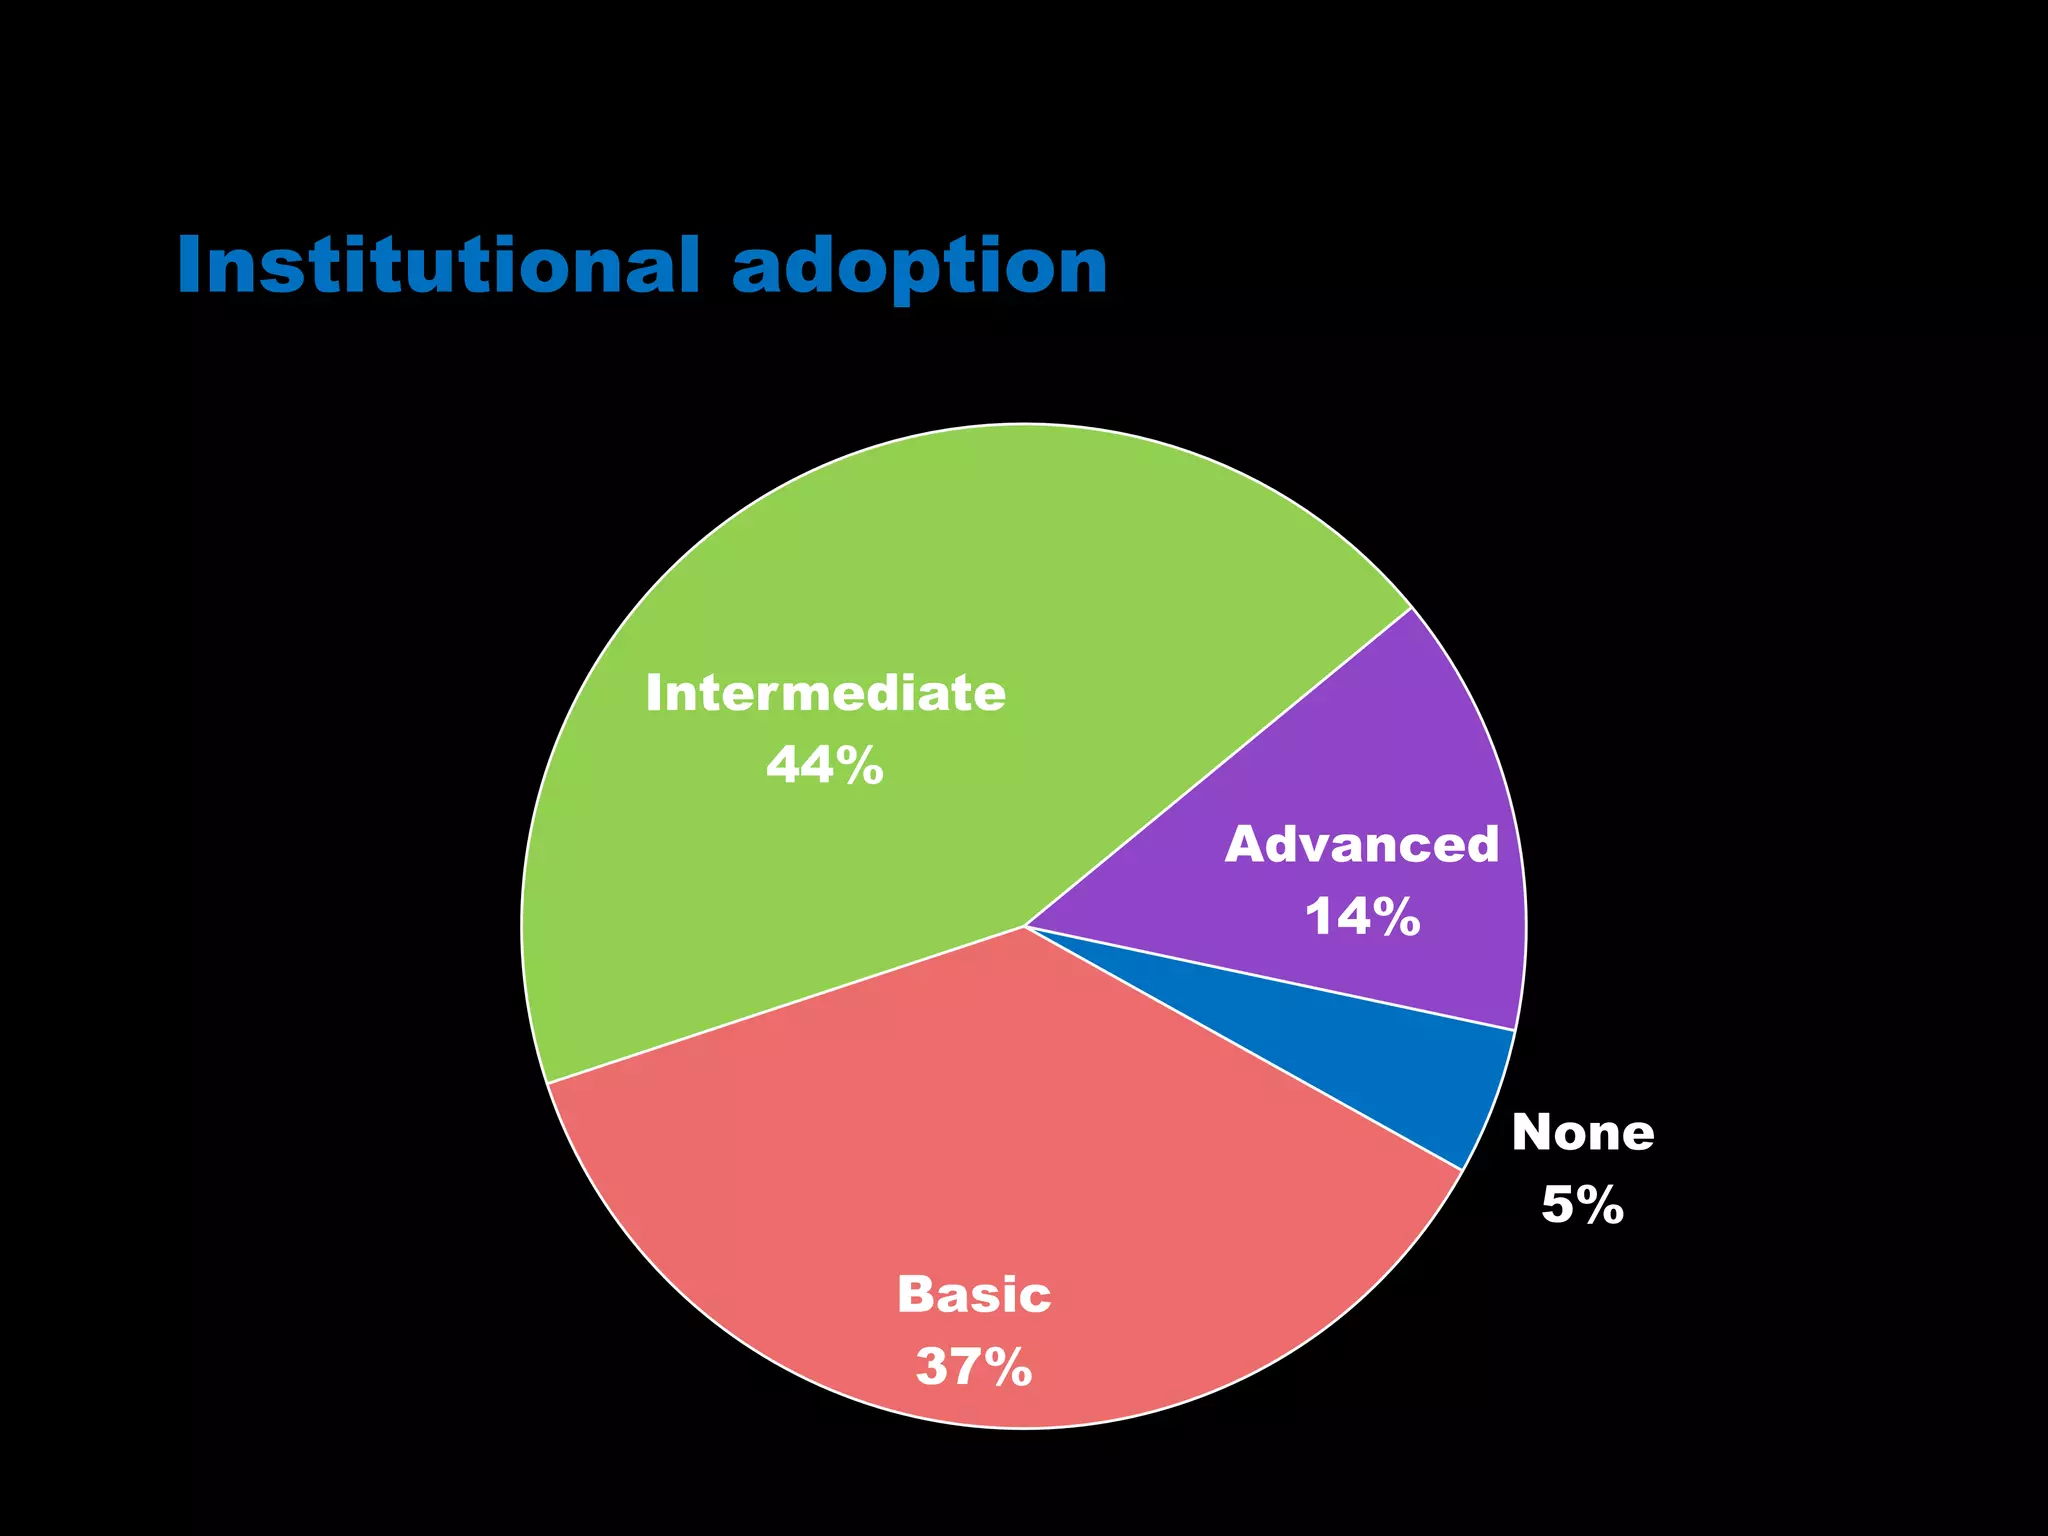
27.3%
42.0%
23.5%
7.2%
0.4%
6.8%
43.6%
49.2%
<- [1] Basic [2] [3] [4] Advanced ->
BEFORE the training AFTER the training
Source: Impact survey](https://image.slidesharecdn.com/ctaweb2socialmedia2011-2012impactstudy-140331104657-phpapp01/75/Web-2-0-and-social-media-capacity-building-initiative-What-have-we-learnt-over-the-period-2011-2012-Results-of-an-impact-study-10-2048.jpg)
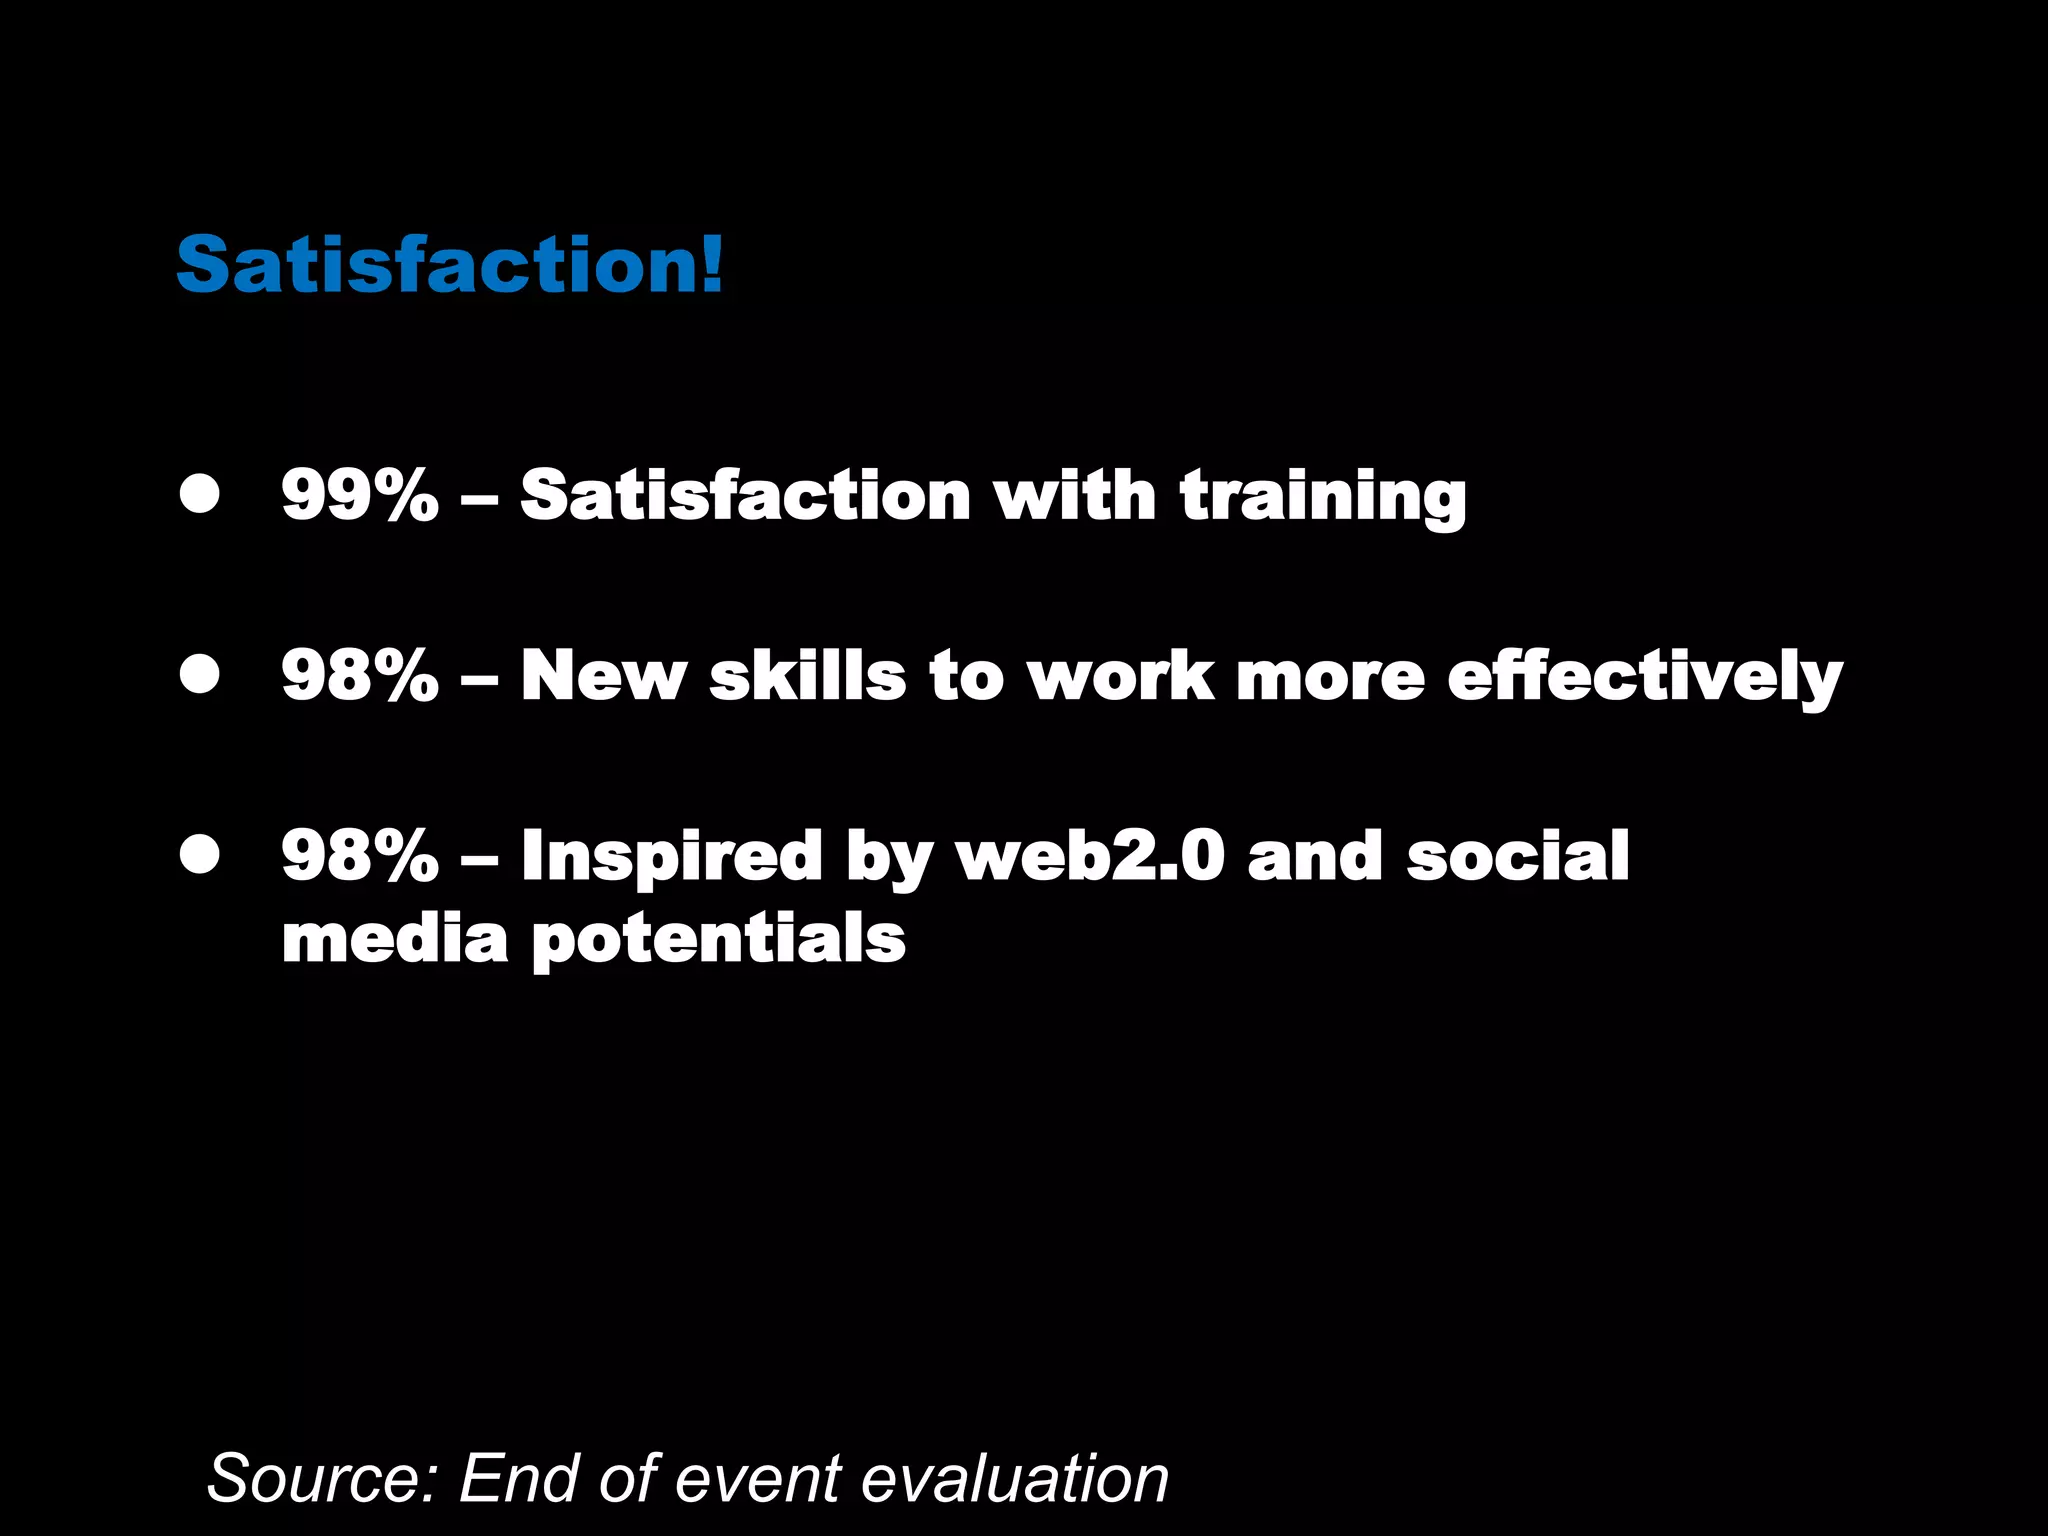
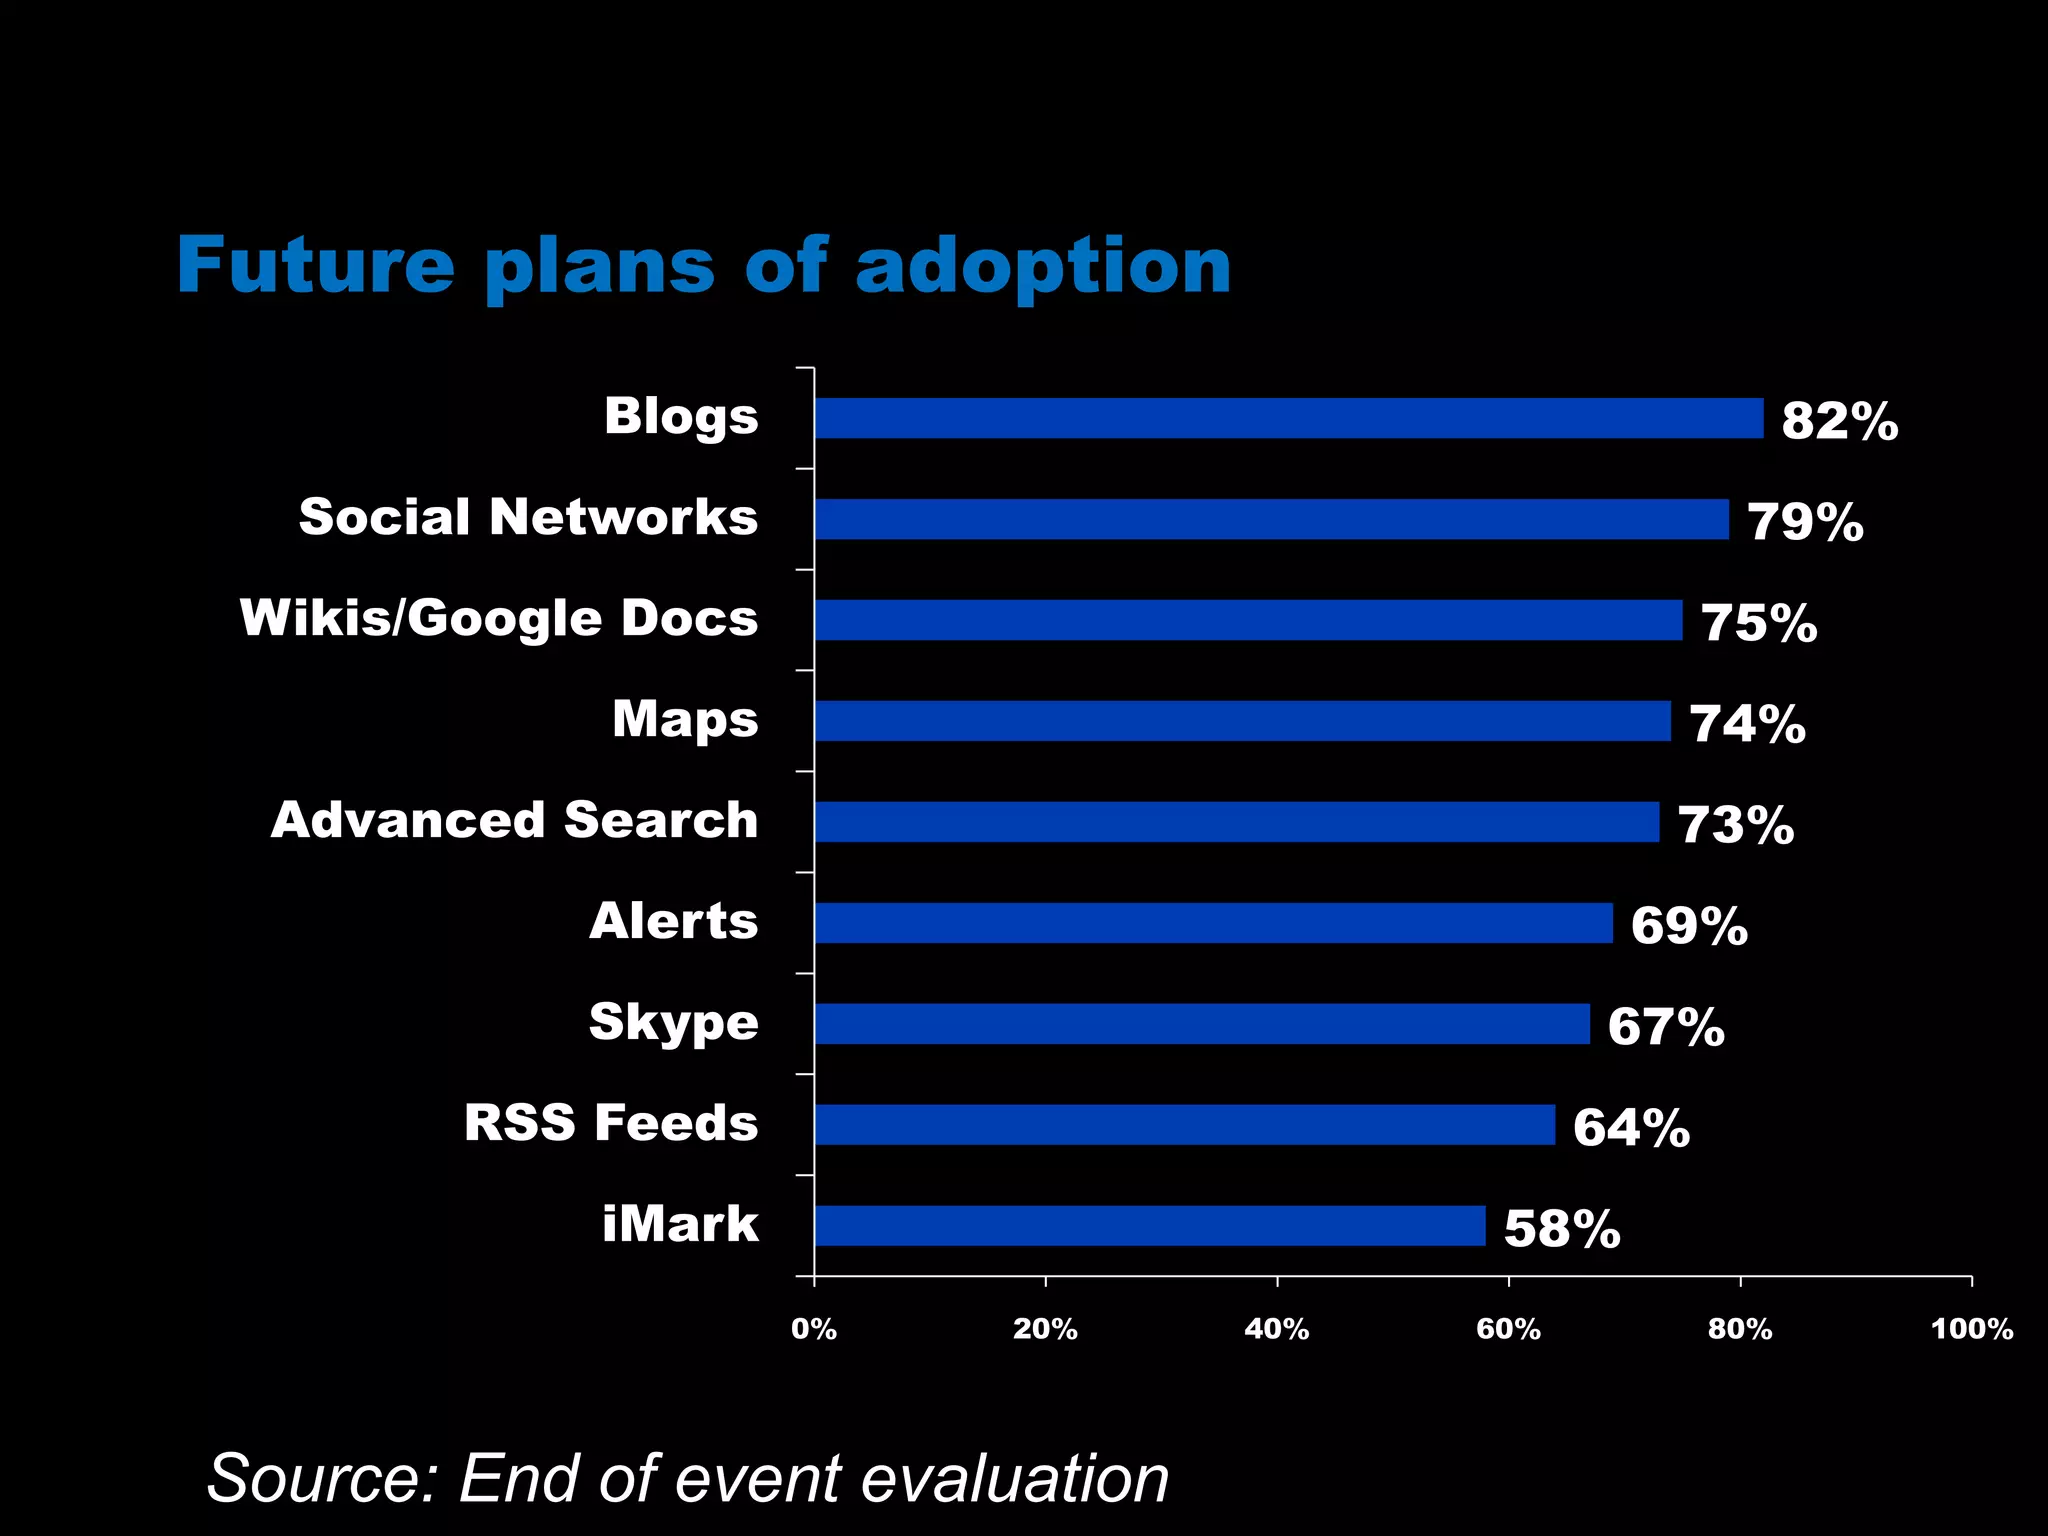
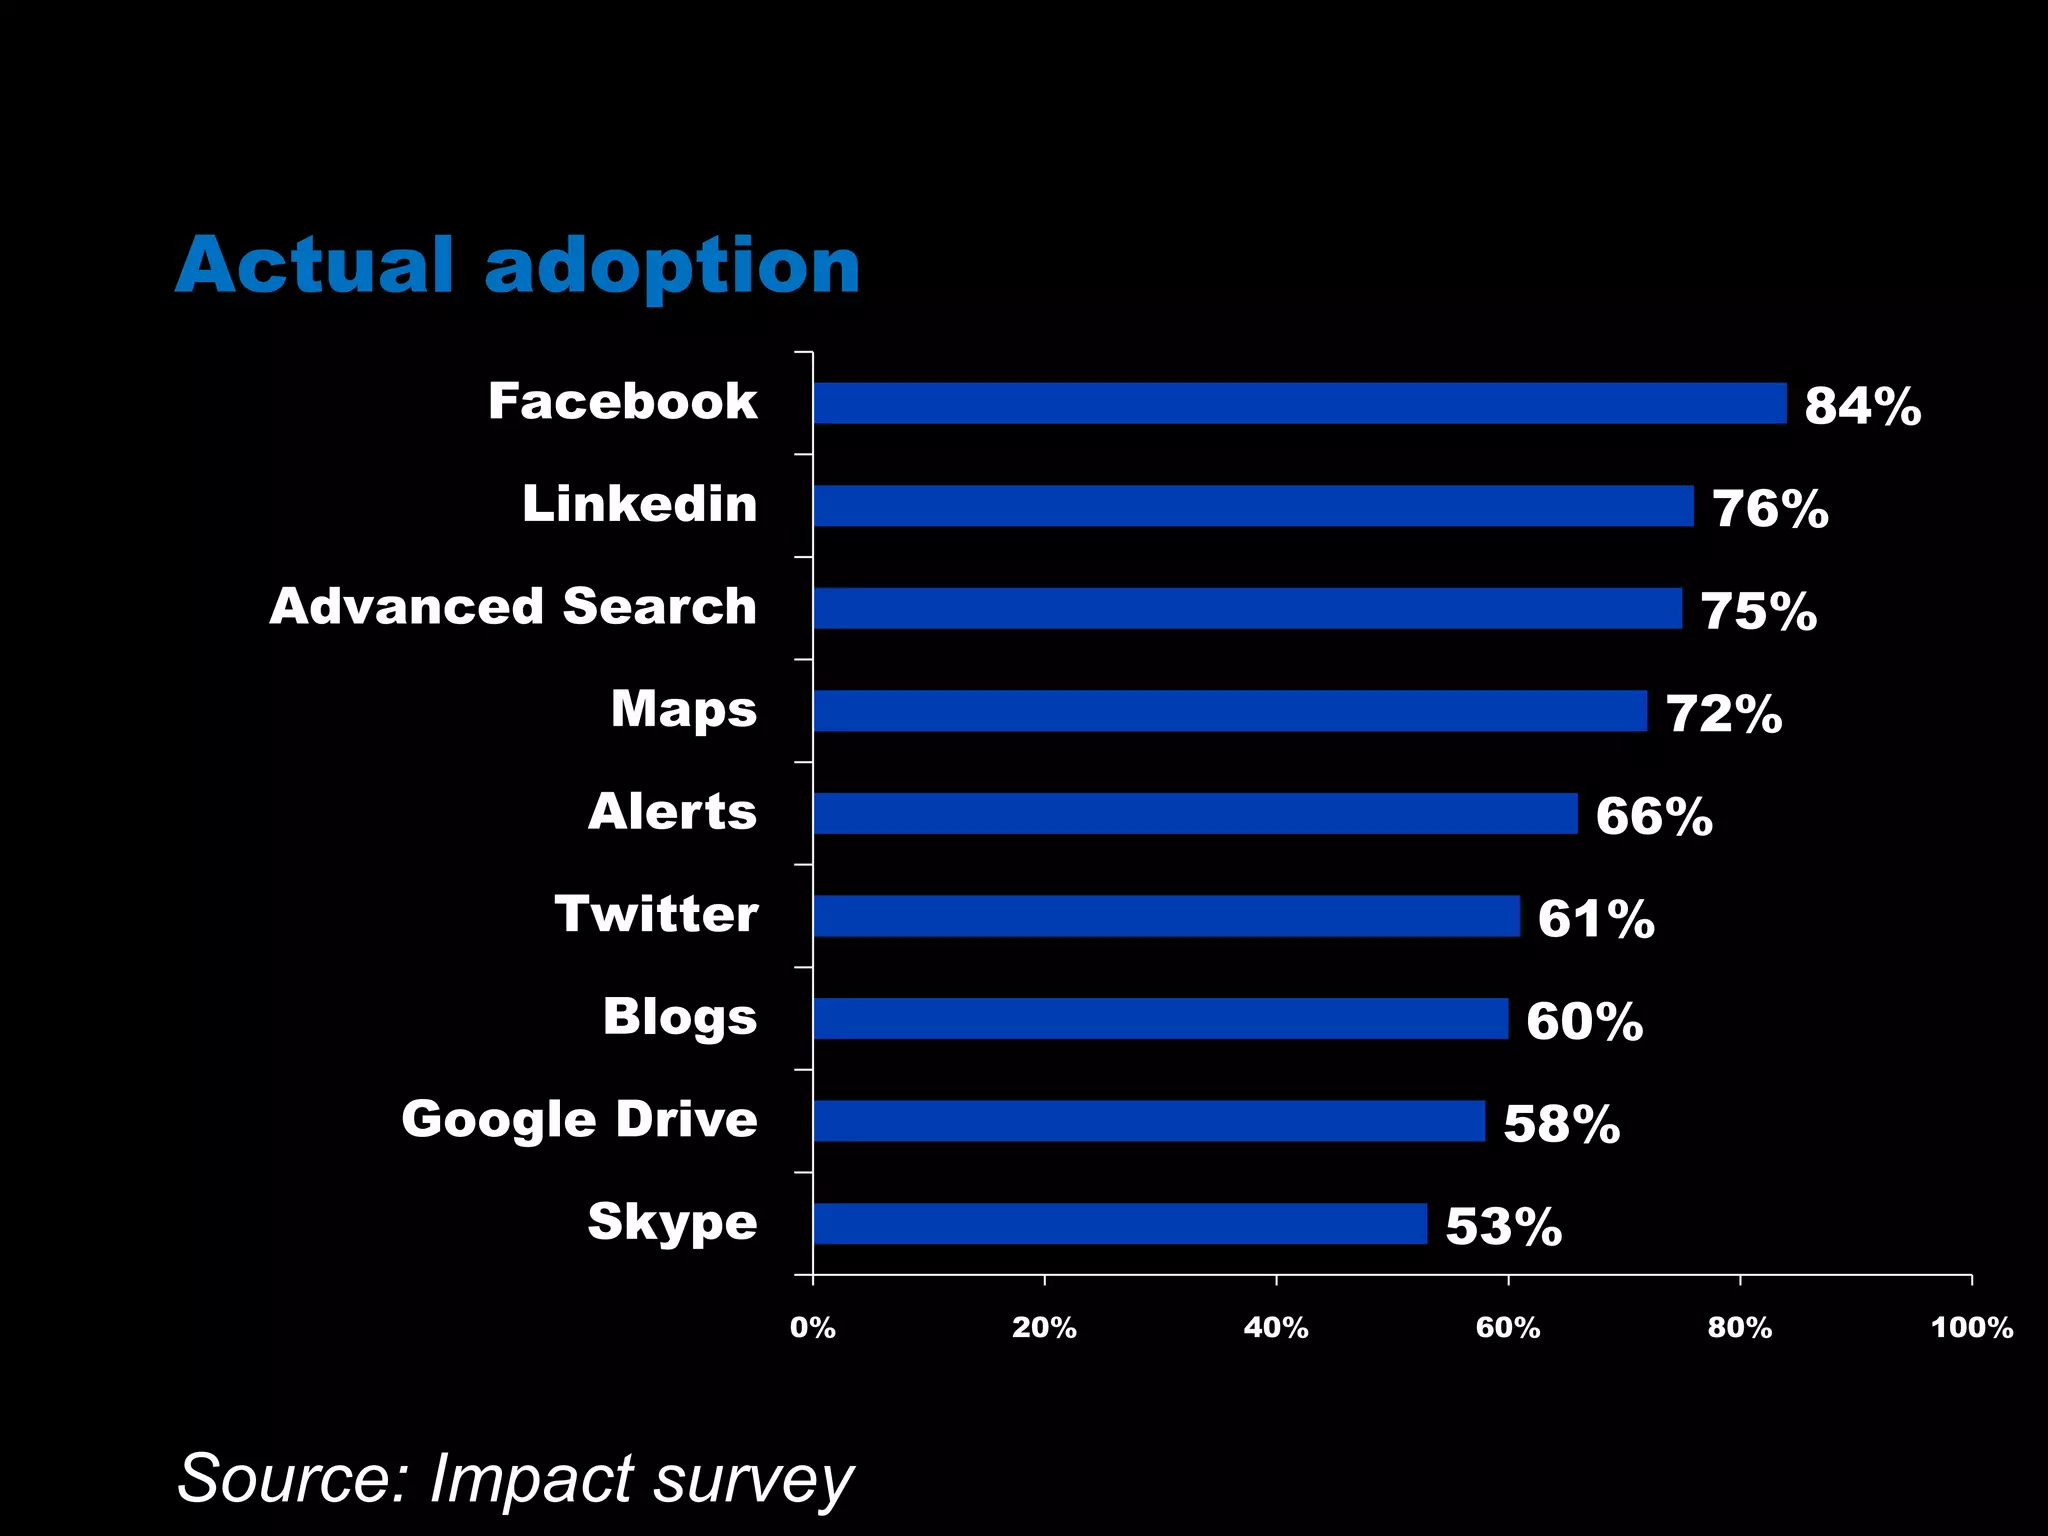
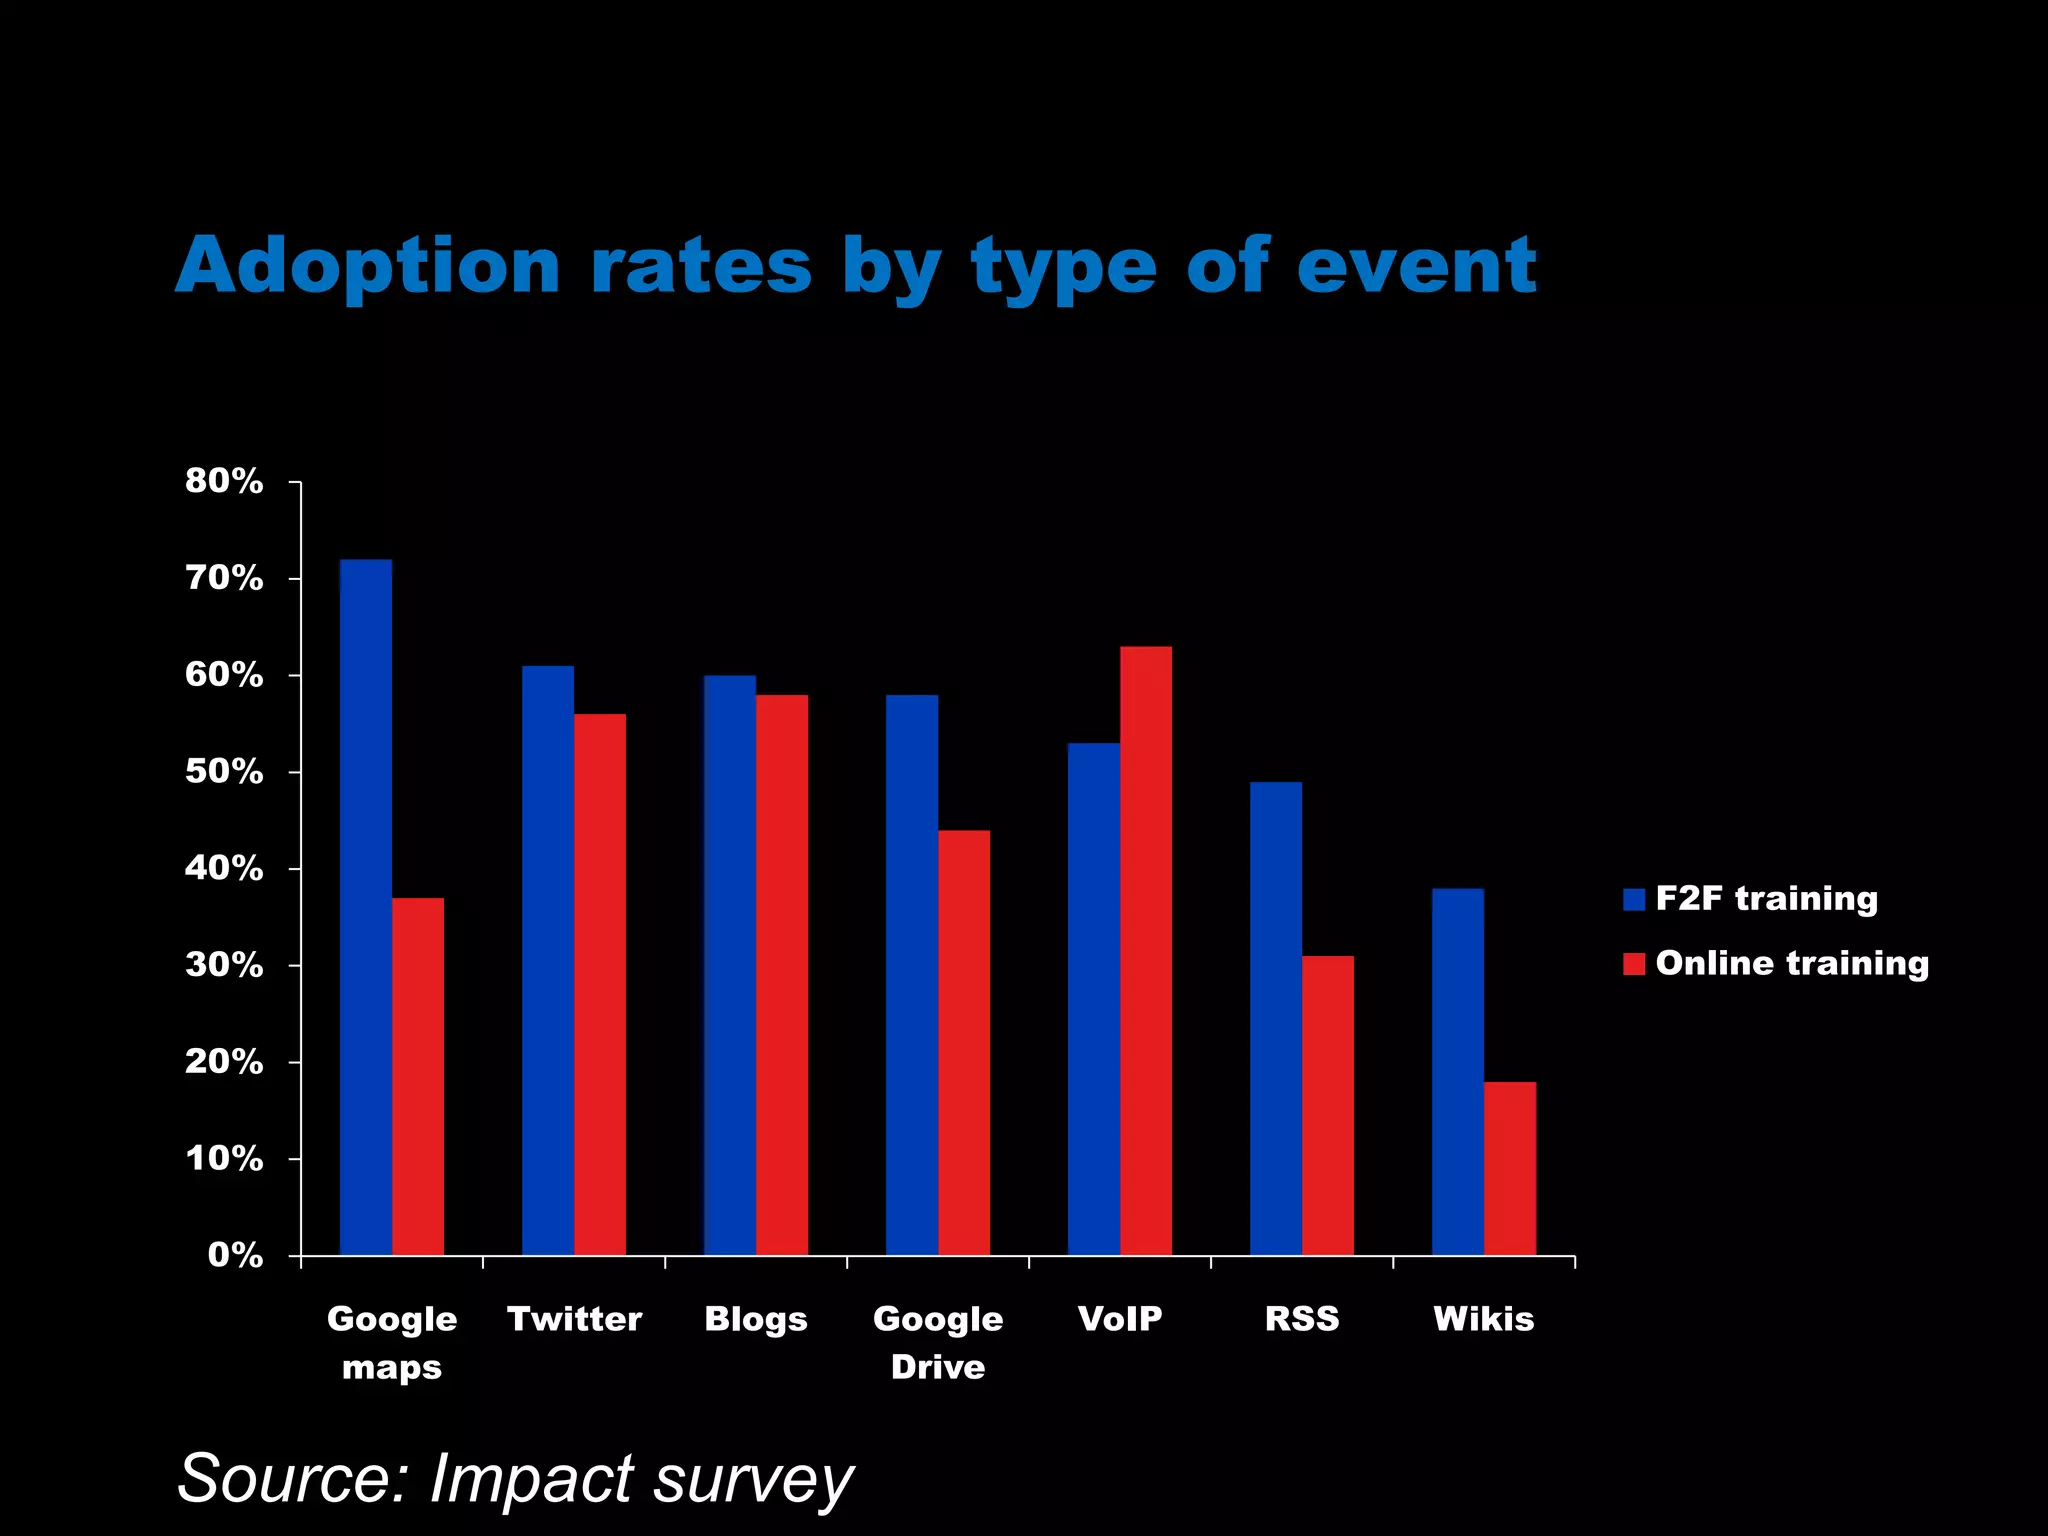

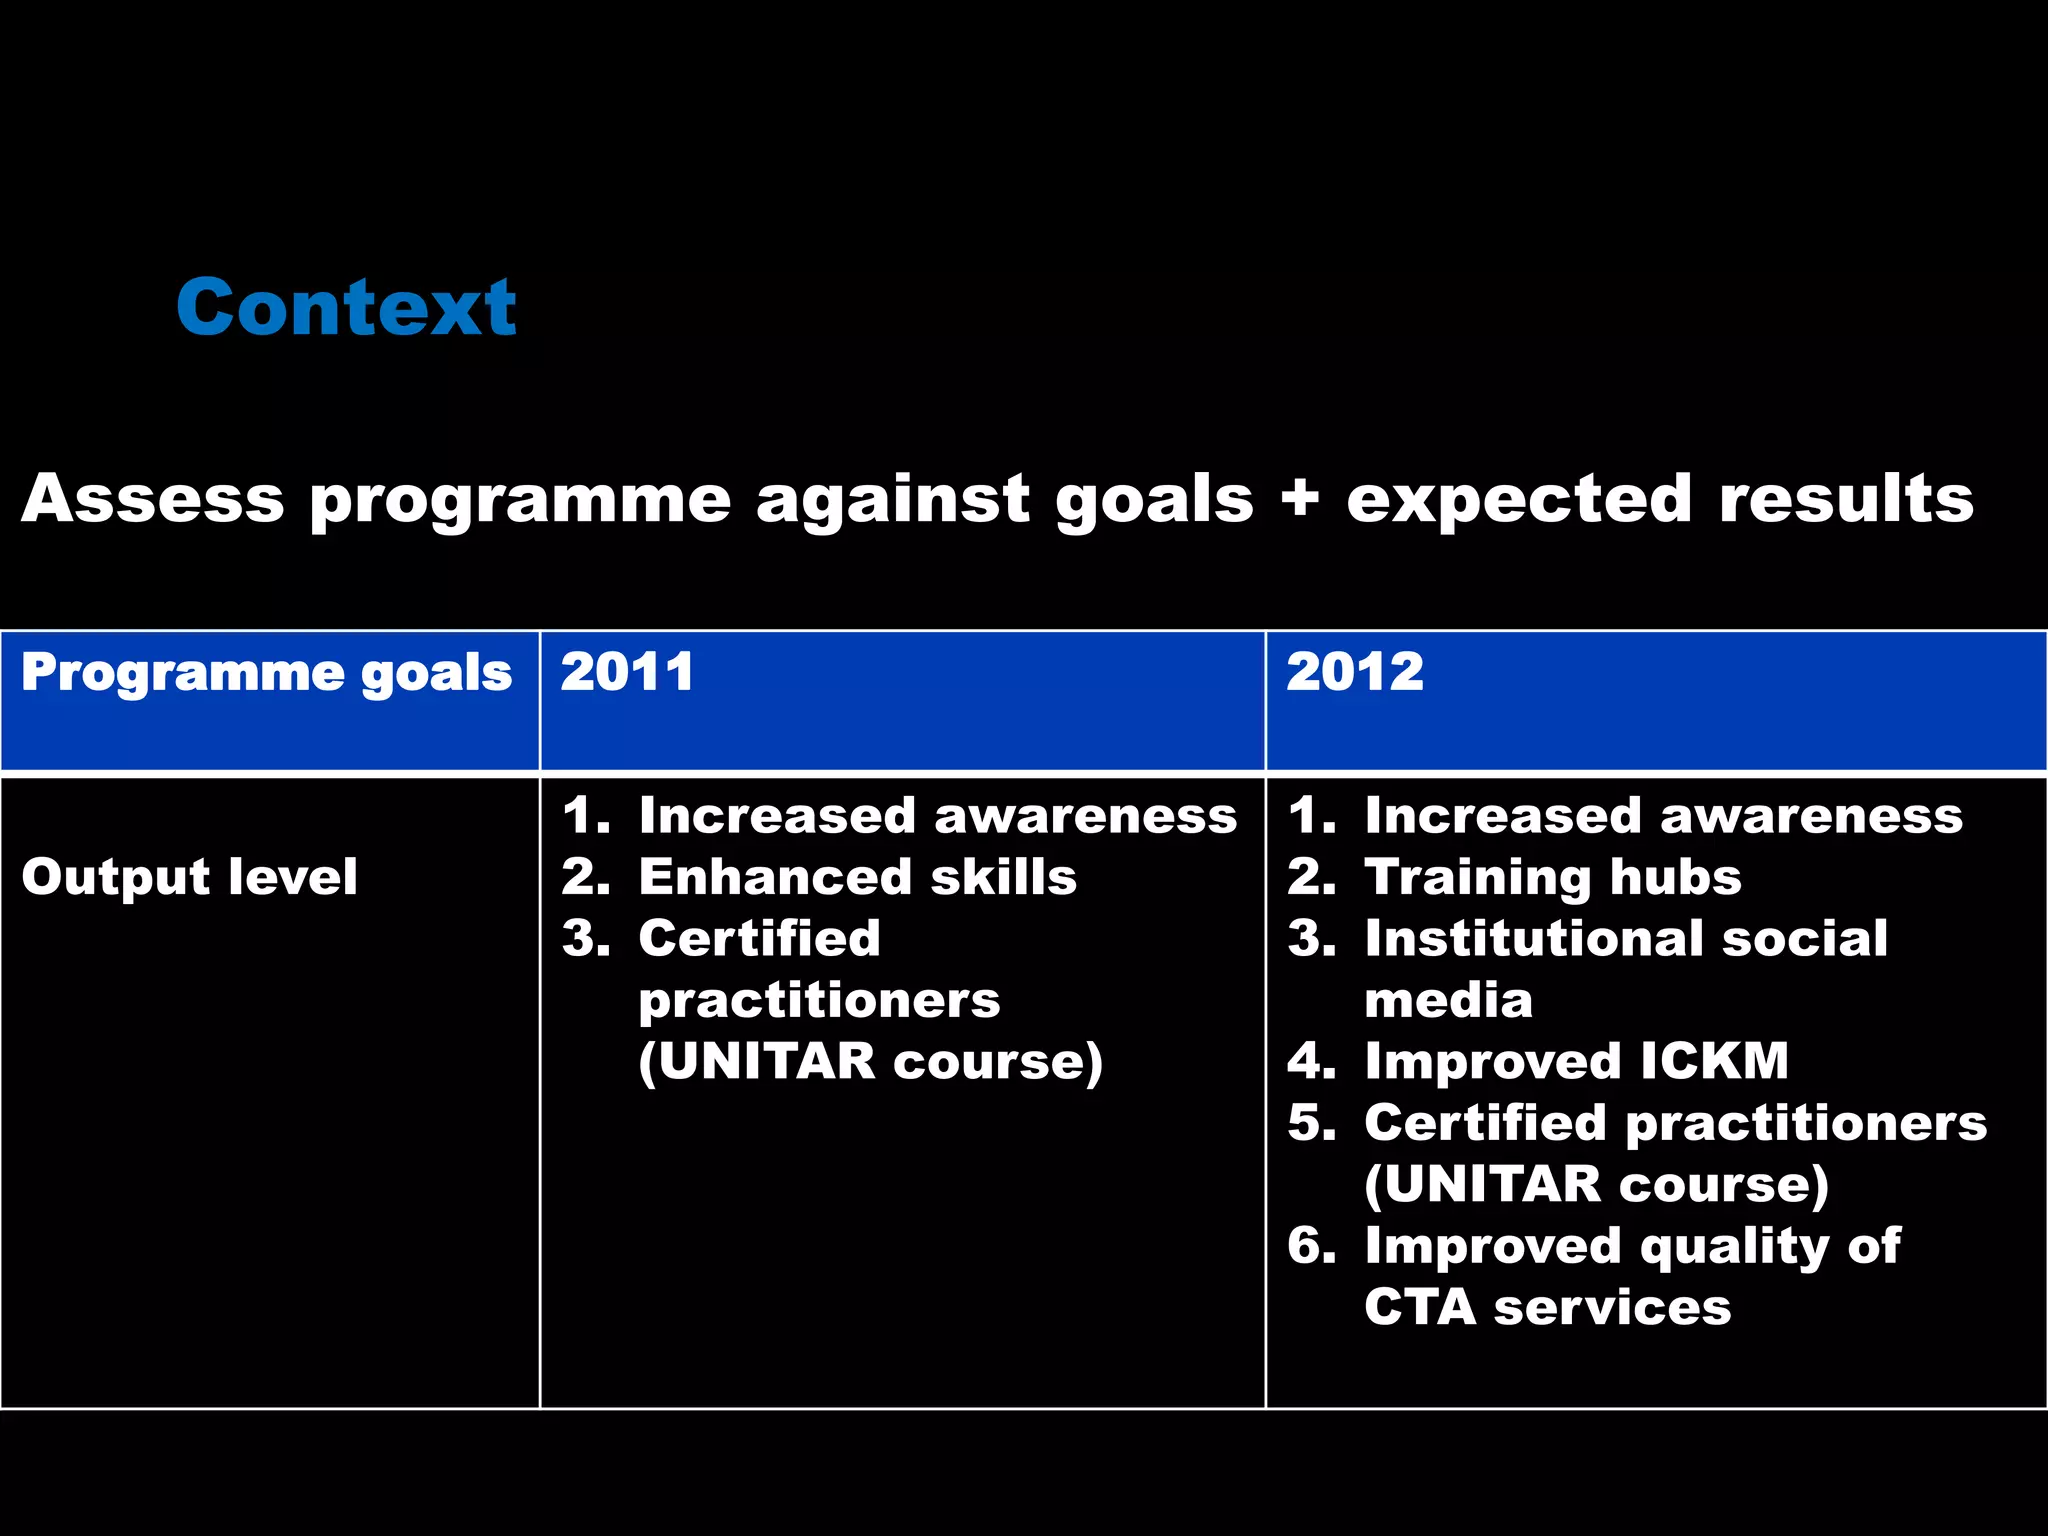
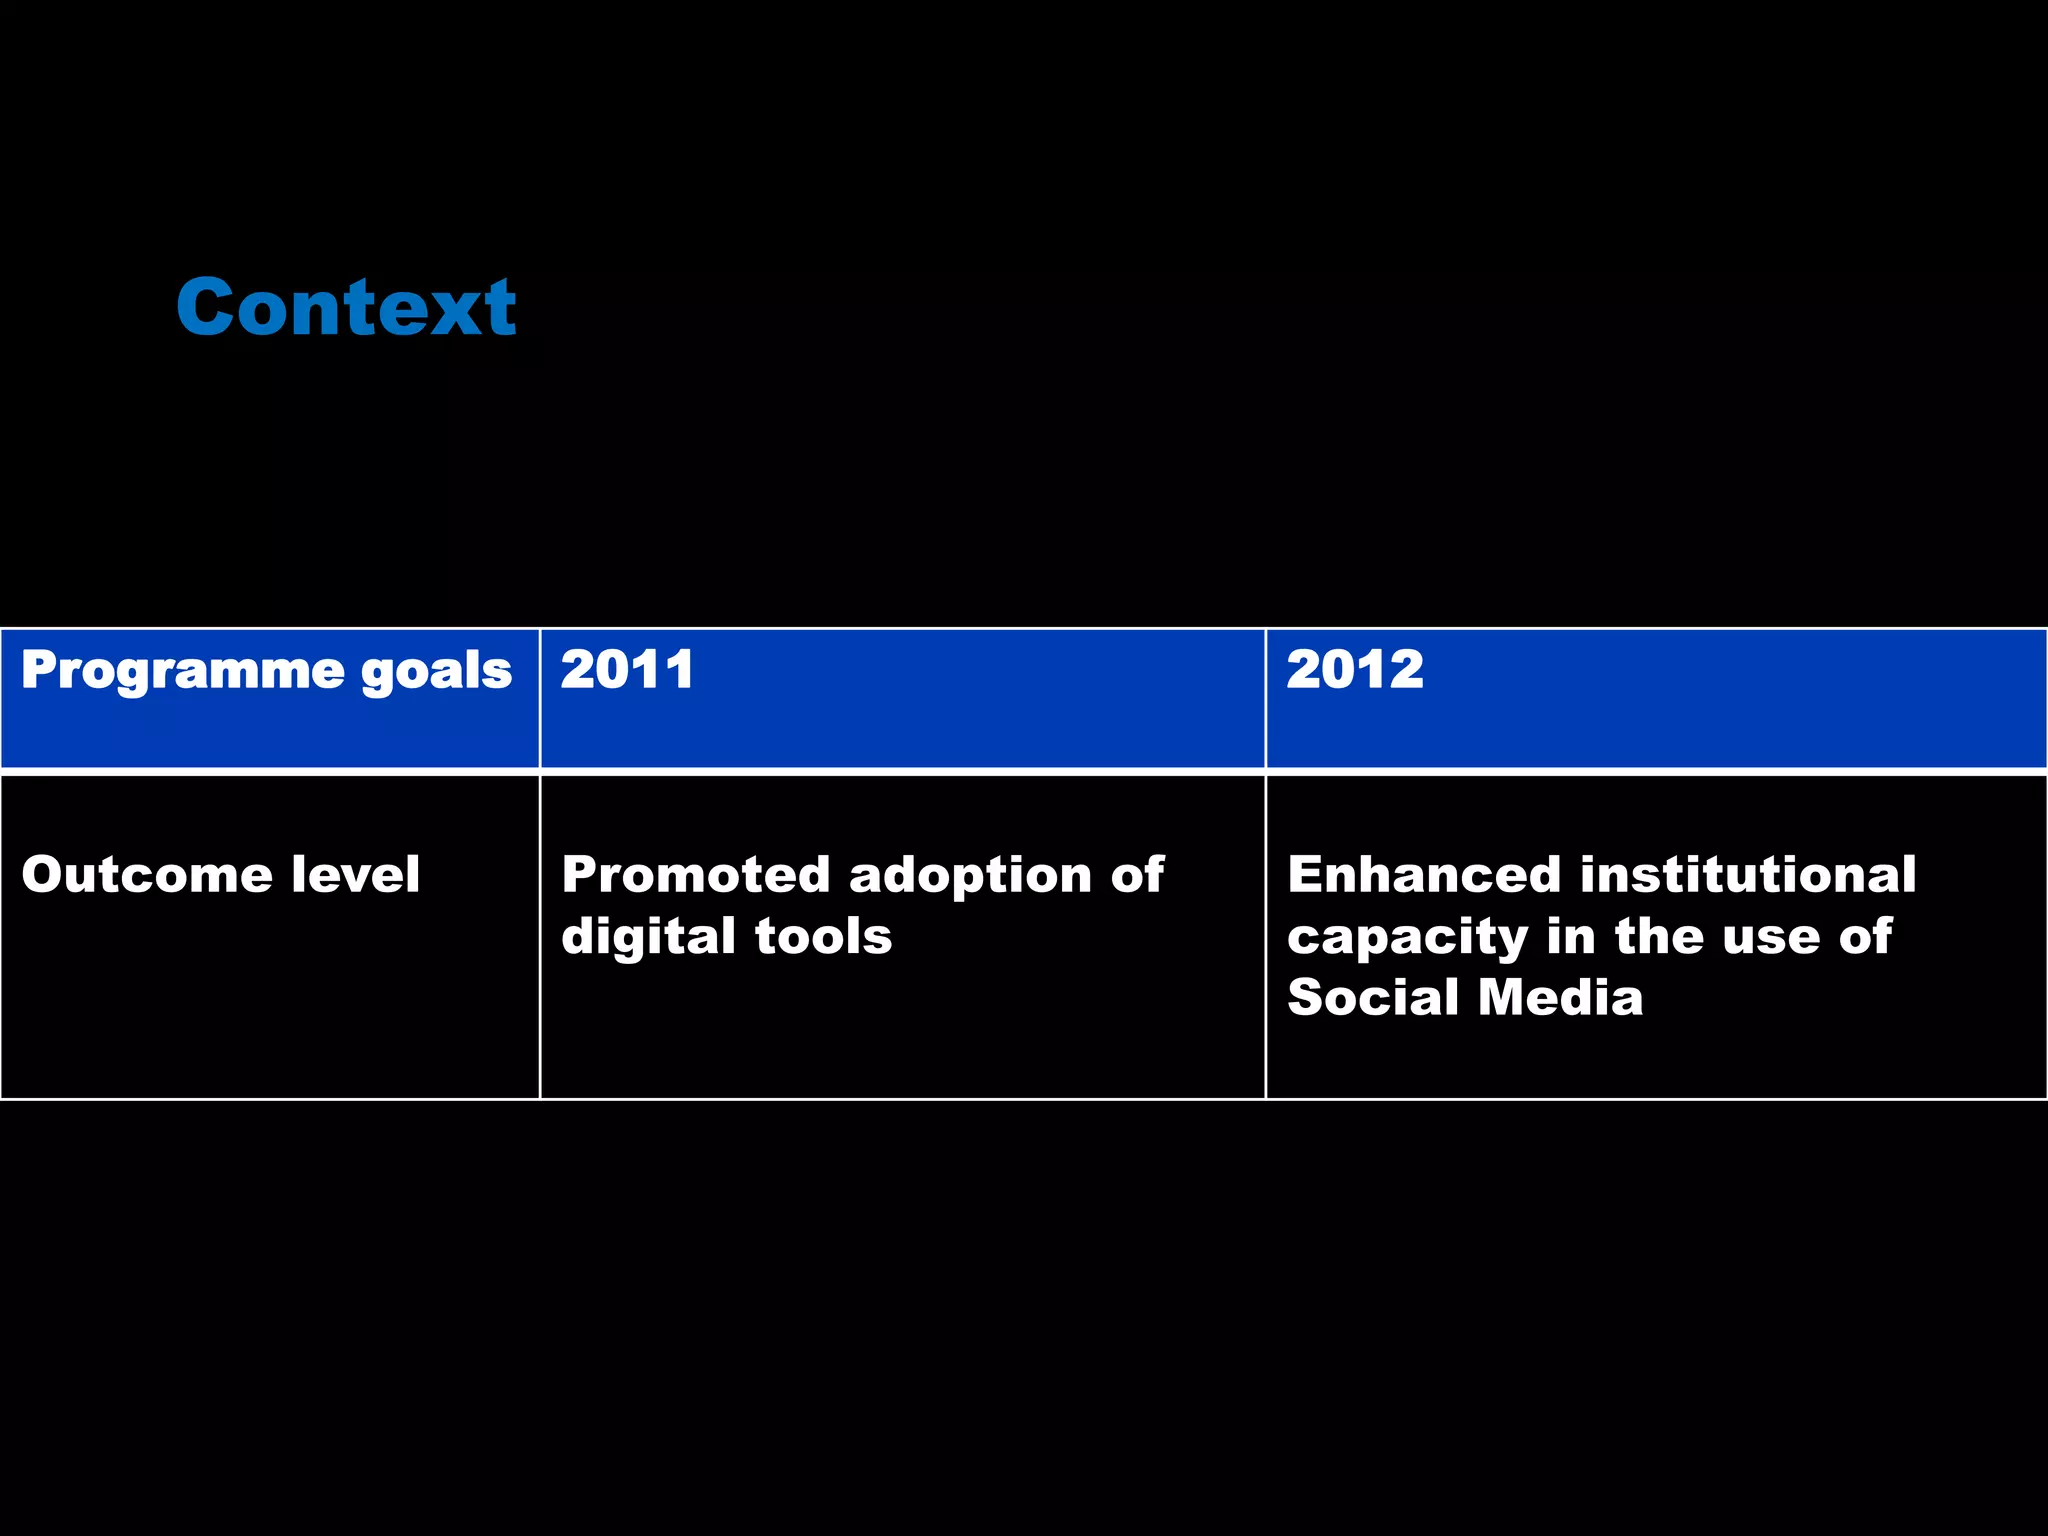
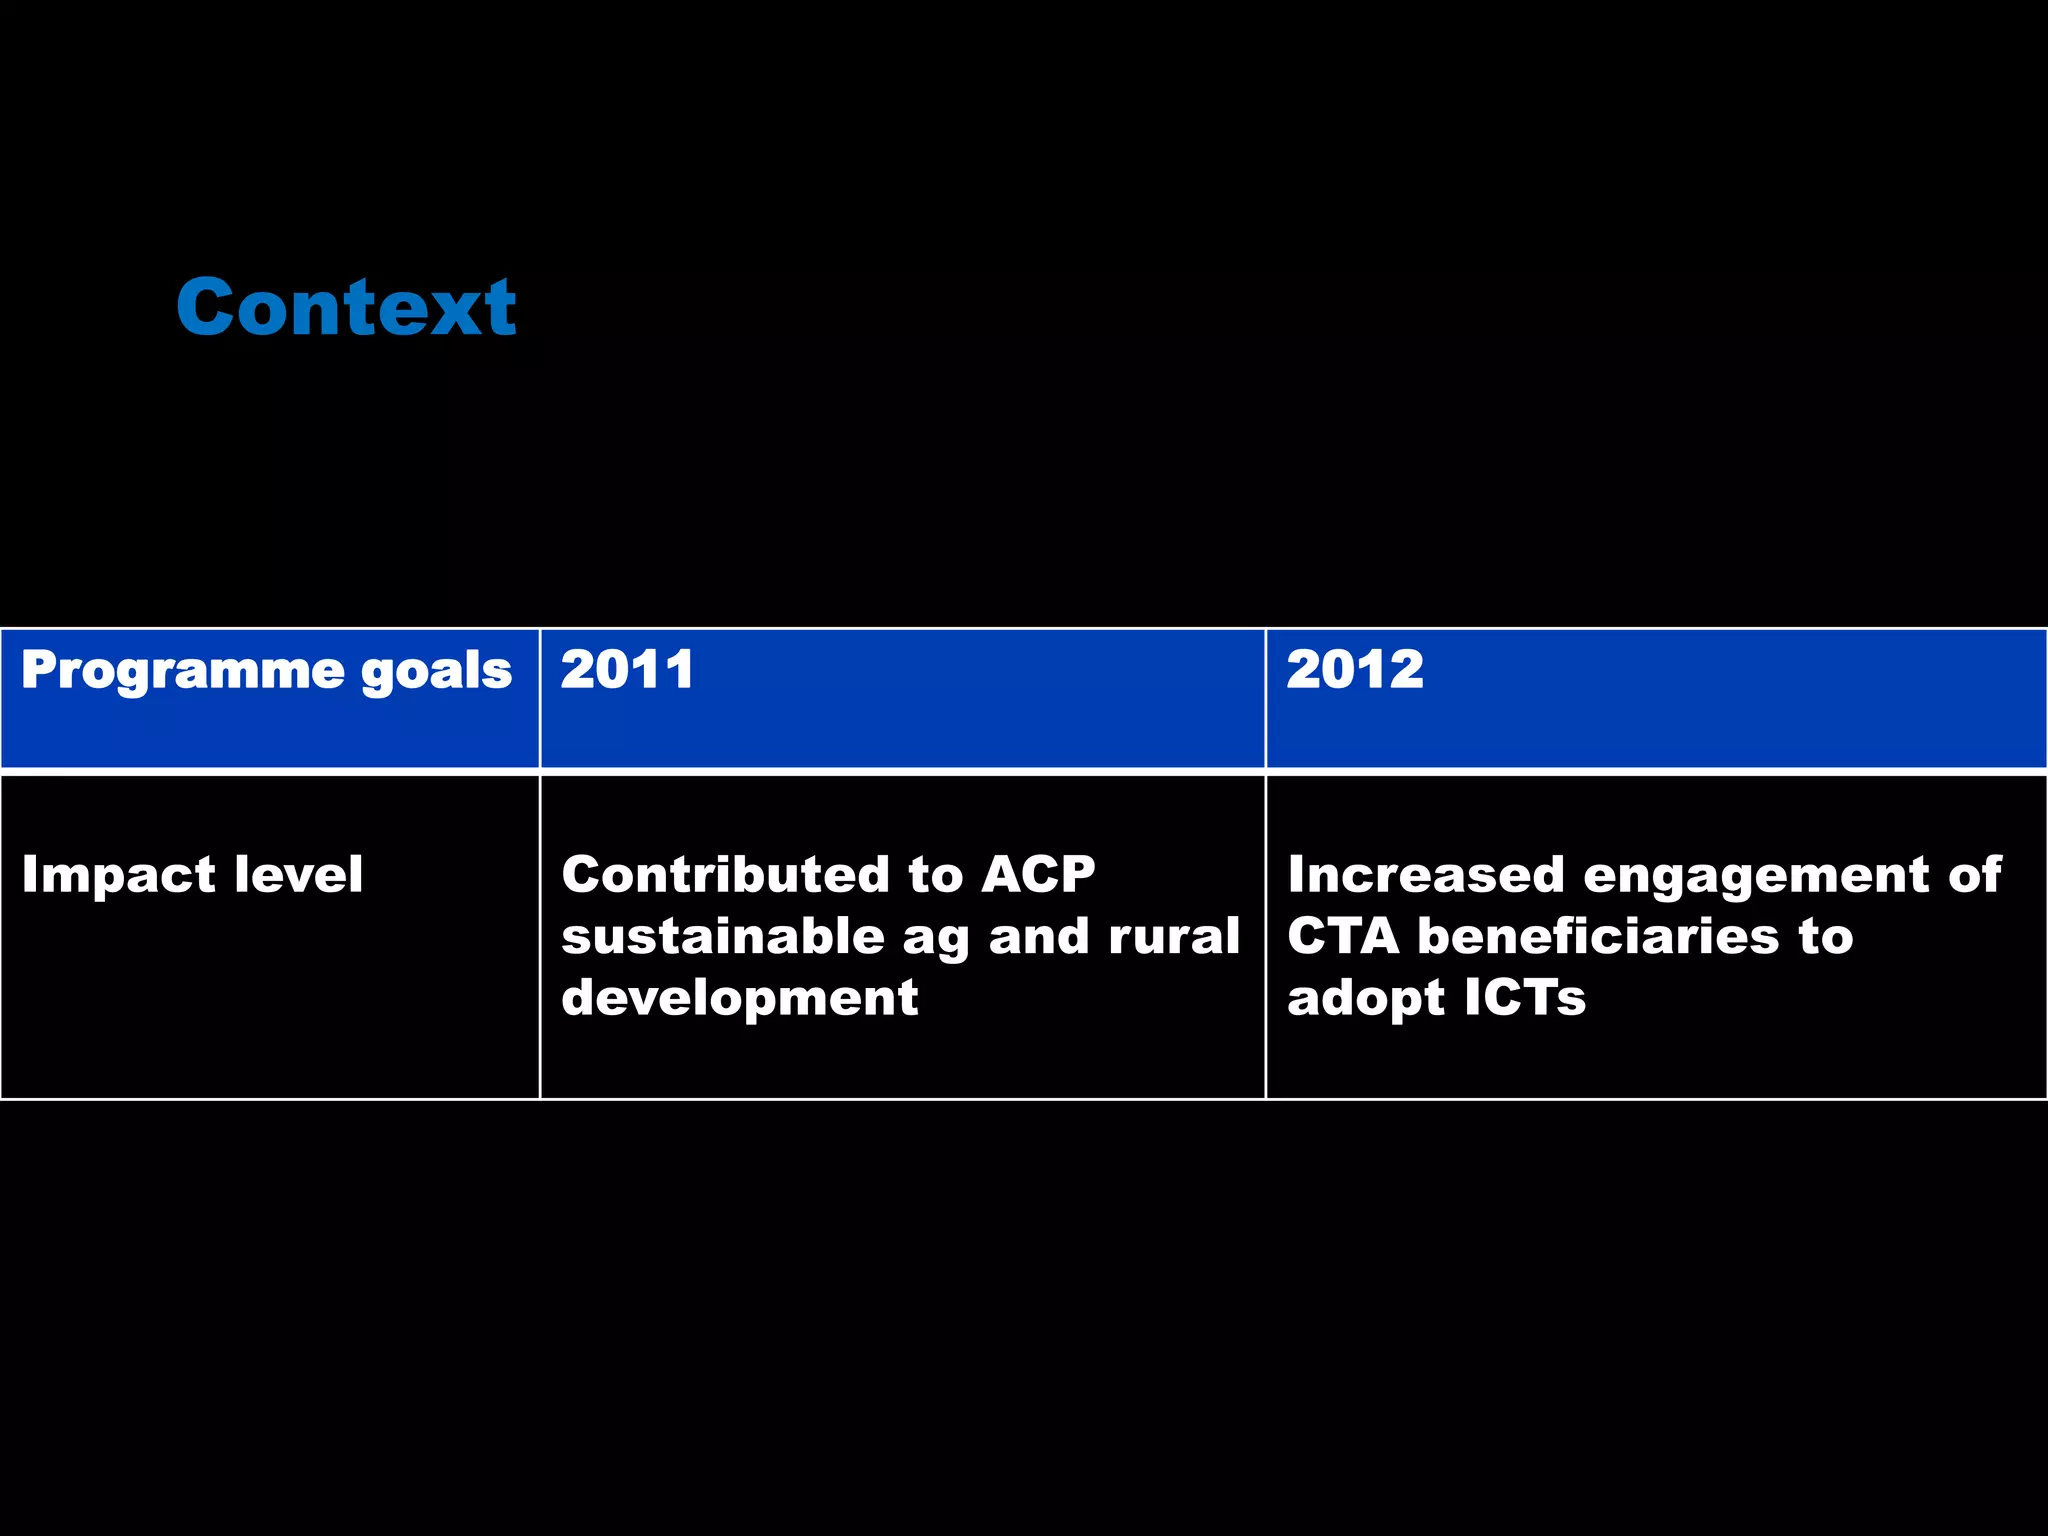
The document evaluates the outcomes of the CTA's 2011-2012 capacity building program focused on Web 2.0 and social media, highlighting their success in increasing awareness and enhancing skills among participants, particularly among youth and women. It reports high satisfaction rates (99%) and significant engagement with digital tools for sustainable agriculture and rural development. Key recommendations for future training include targeting demographics, improving curricula, and fostering organizational change.


![EdTech Europe 2015 [Track 1]: [2U], ([Rob Cohen], [President])](https://cdn.slidesharecdn.com/ss_thumbnails/6-keynote-robcohenppt-150708094119-lva1-app6891-thumbnail.jpg?width=640&height=640&fit=bounds)


![Computer Networks 01[1 using all terms].pptx](https://cdn.slidesharecdn.com/ss_thumbnails/computernetworks011-251214040533-327dd9f8-thumbnail.jpg?width=640&height=640&fit=bounds)


