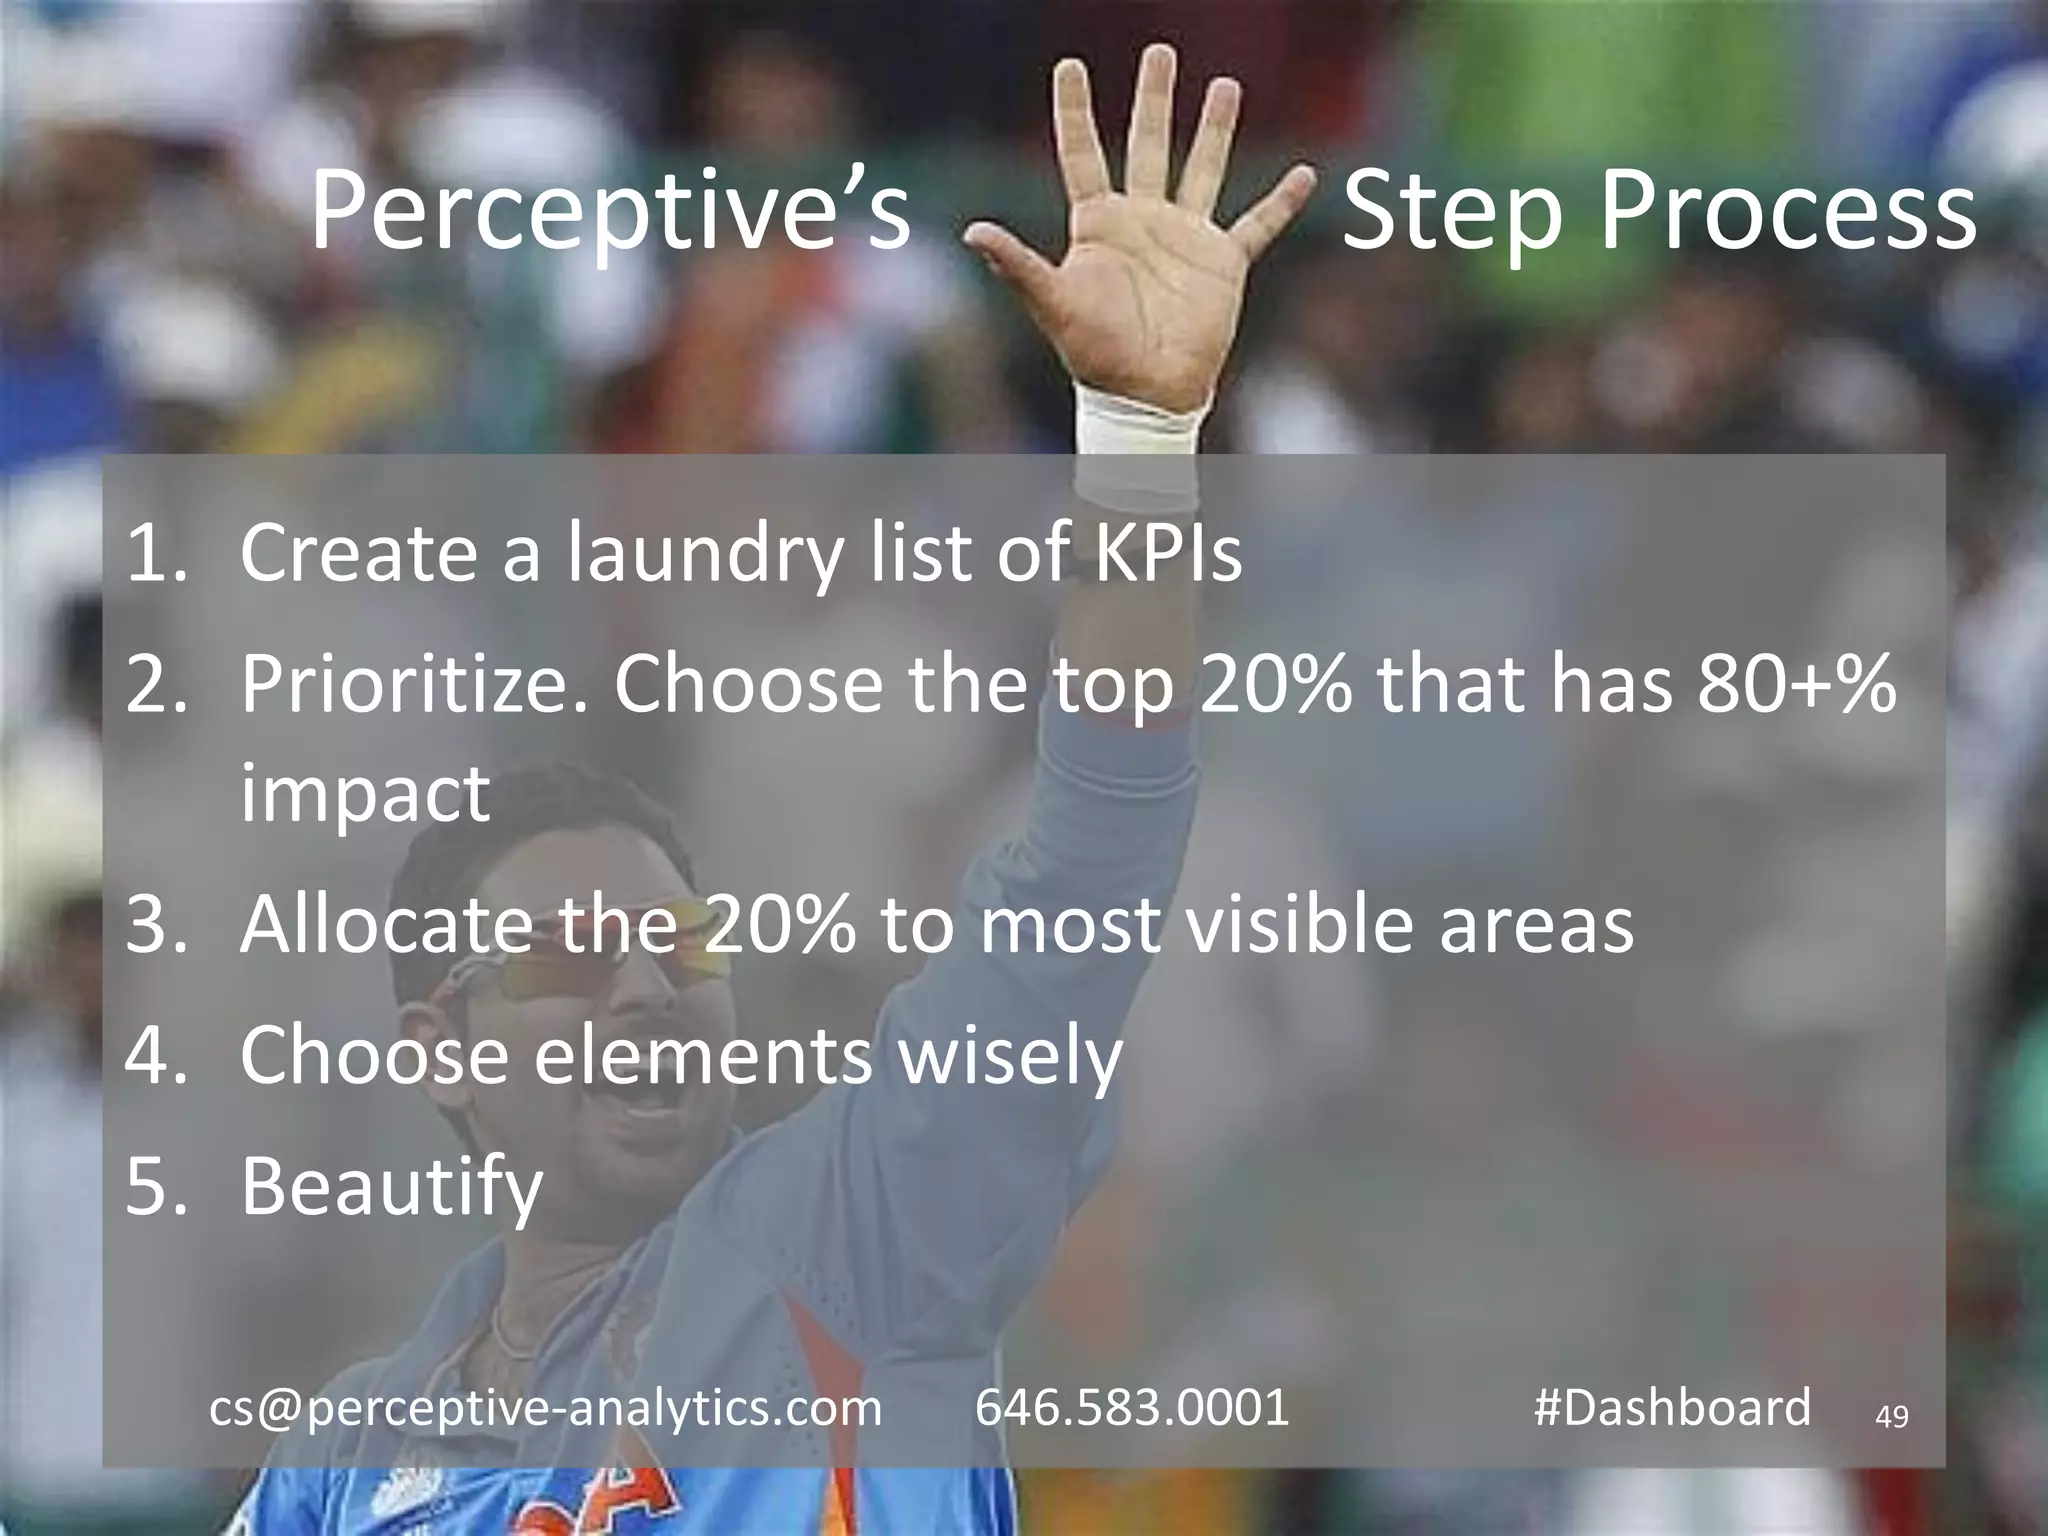
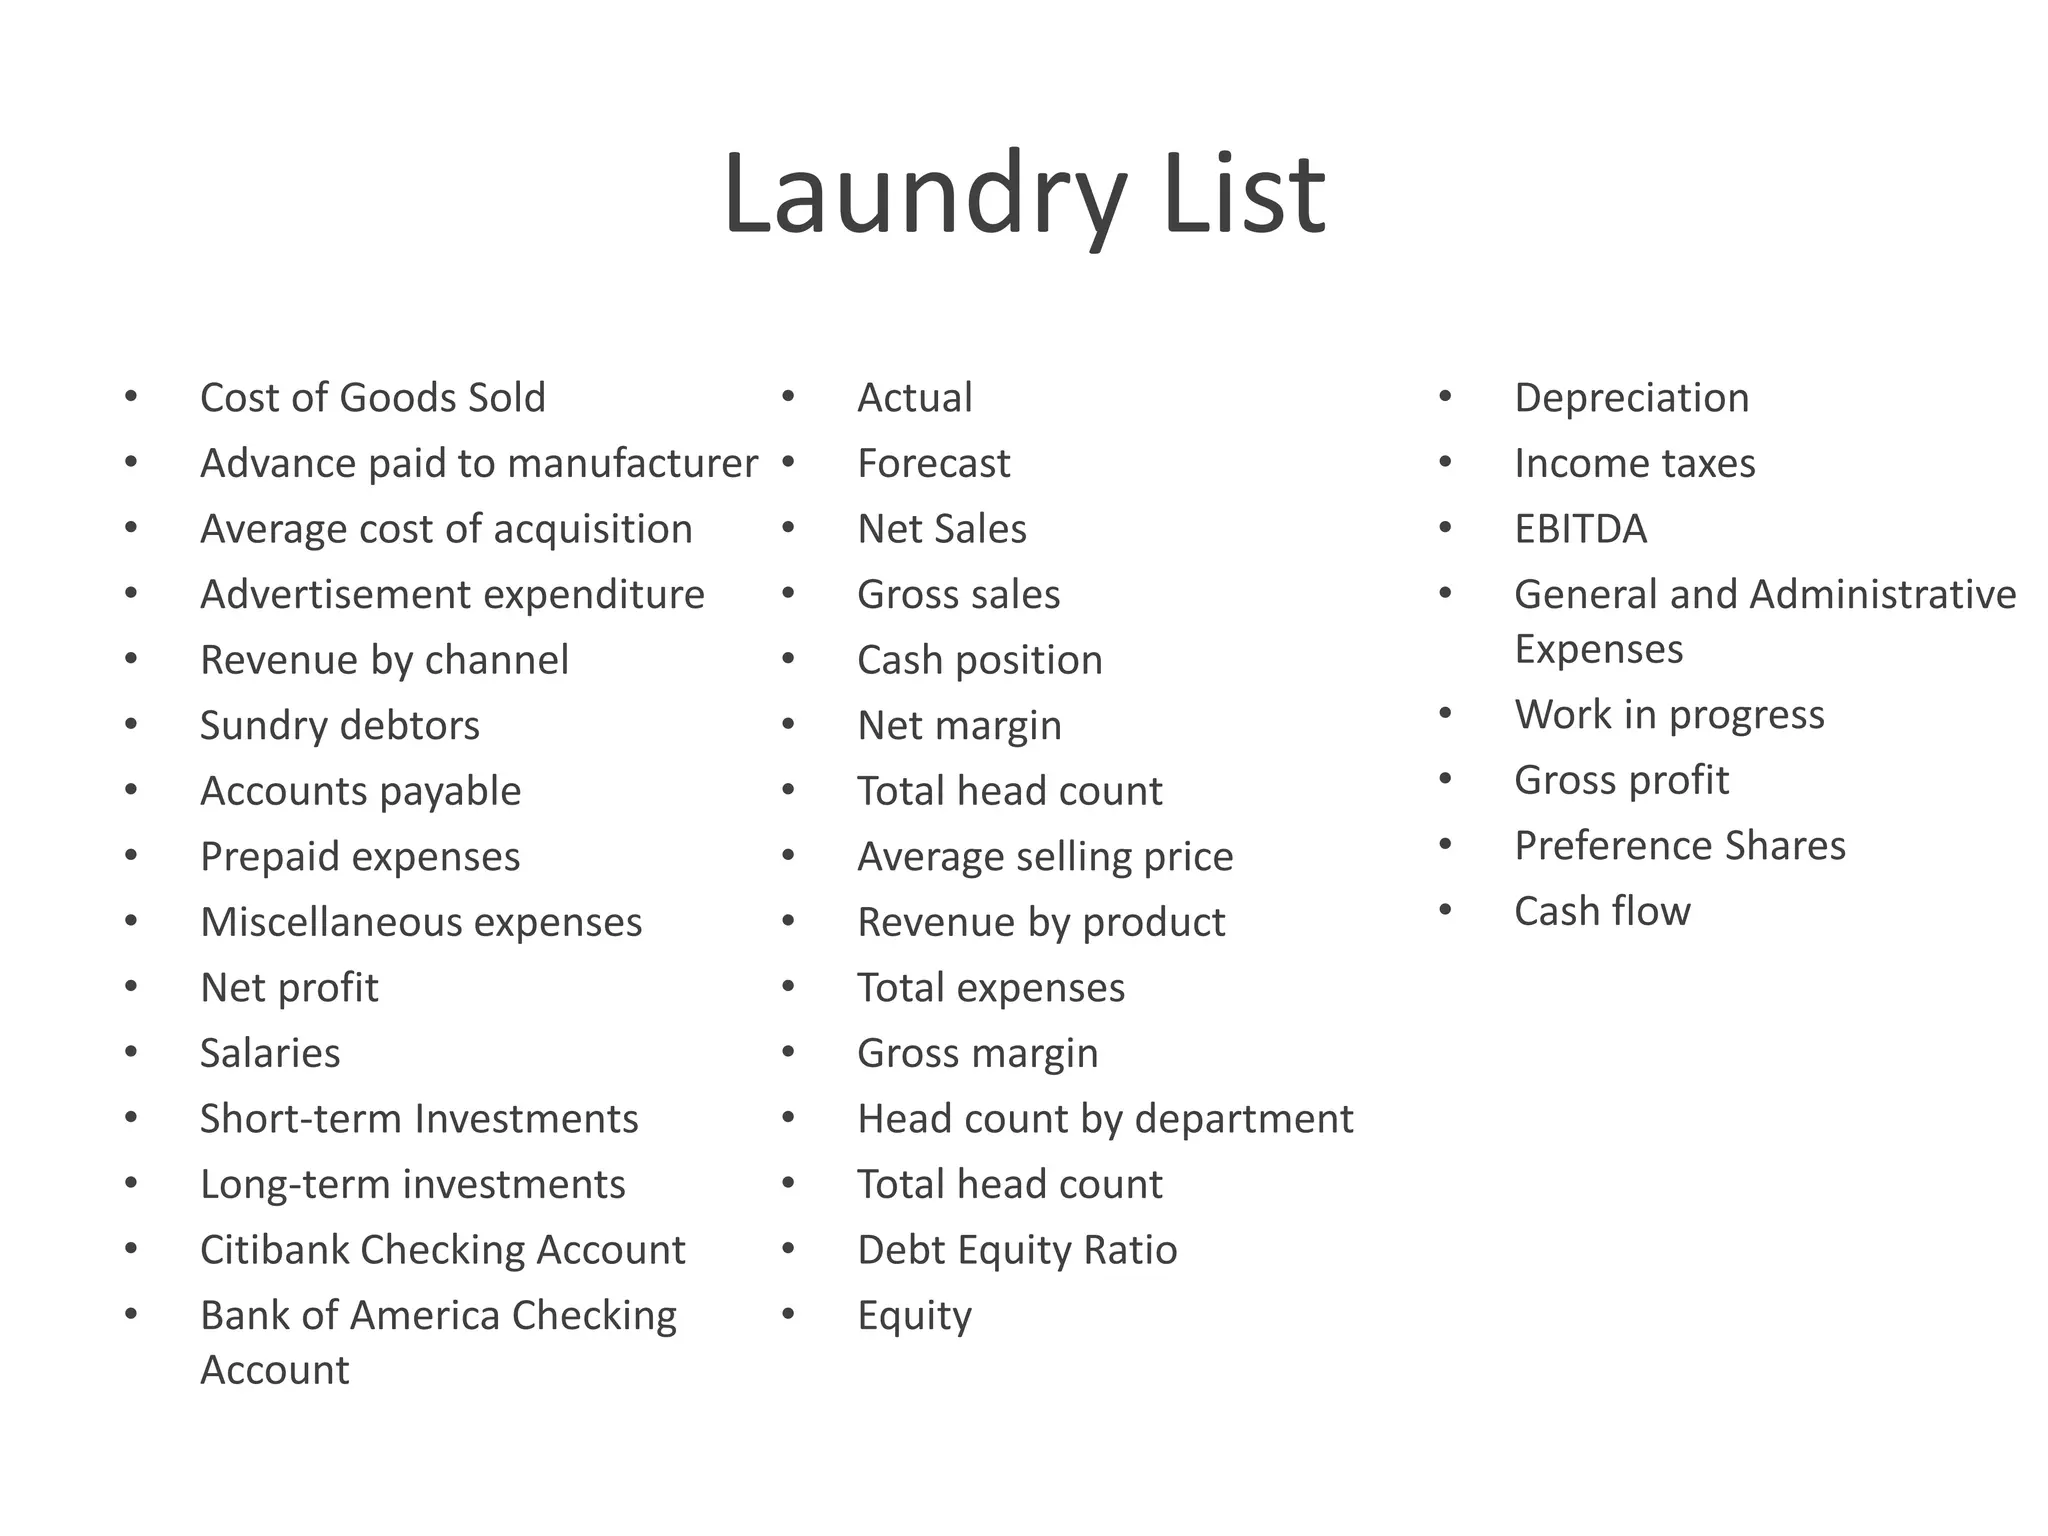
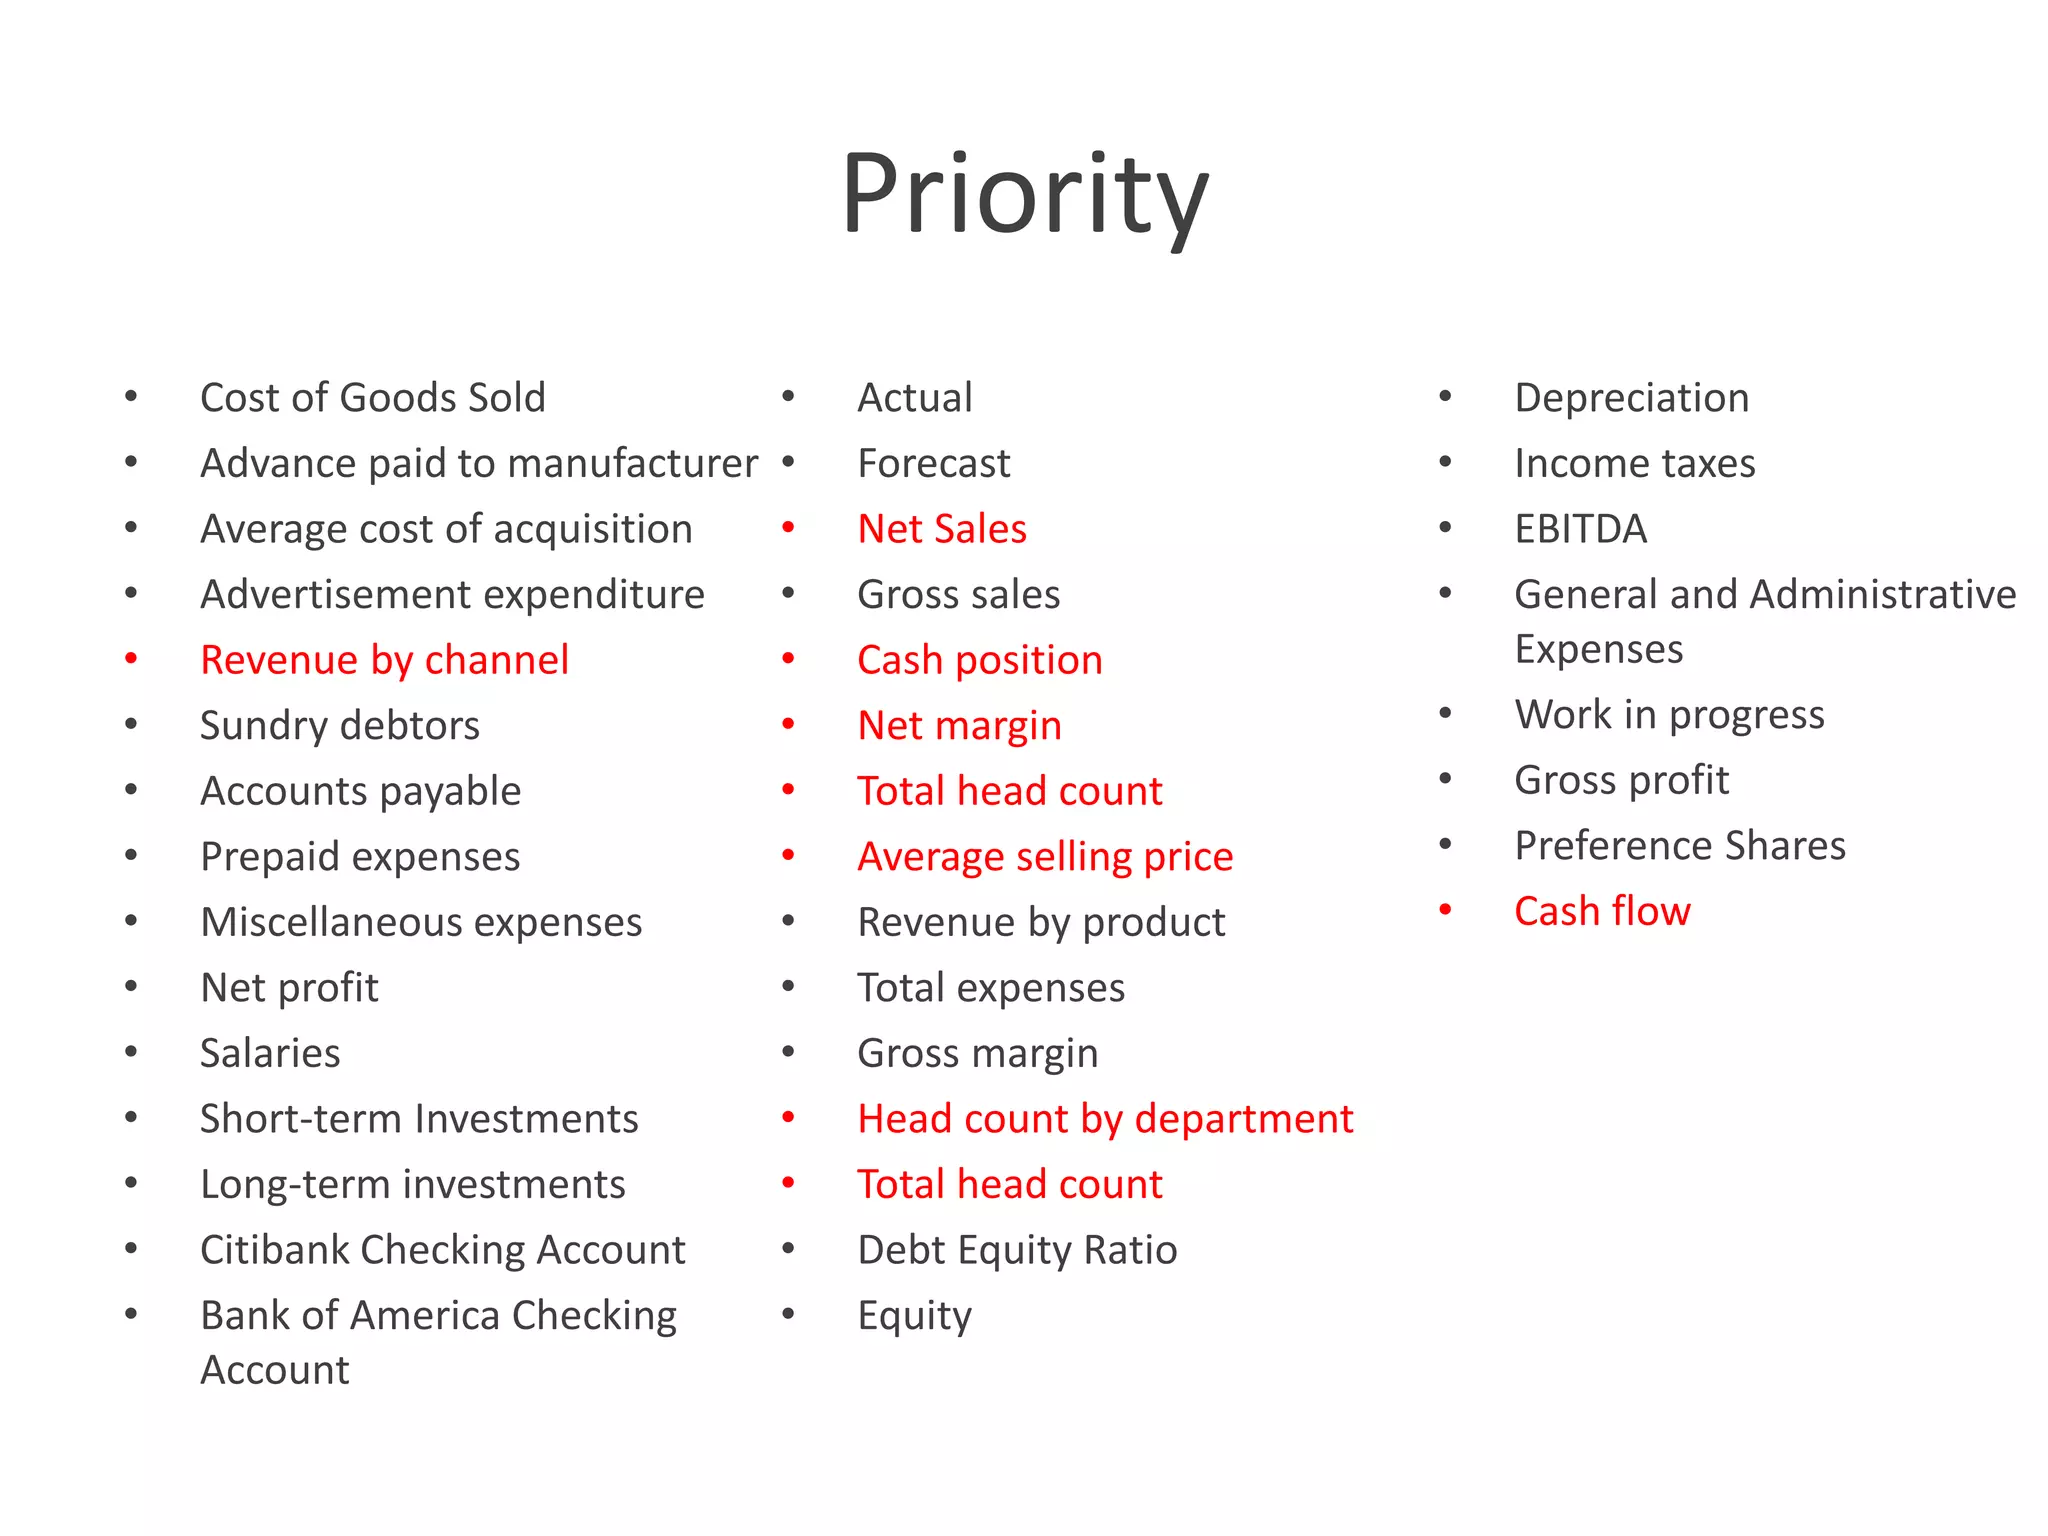
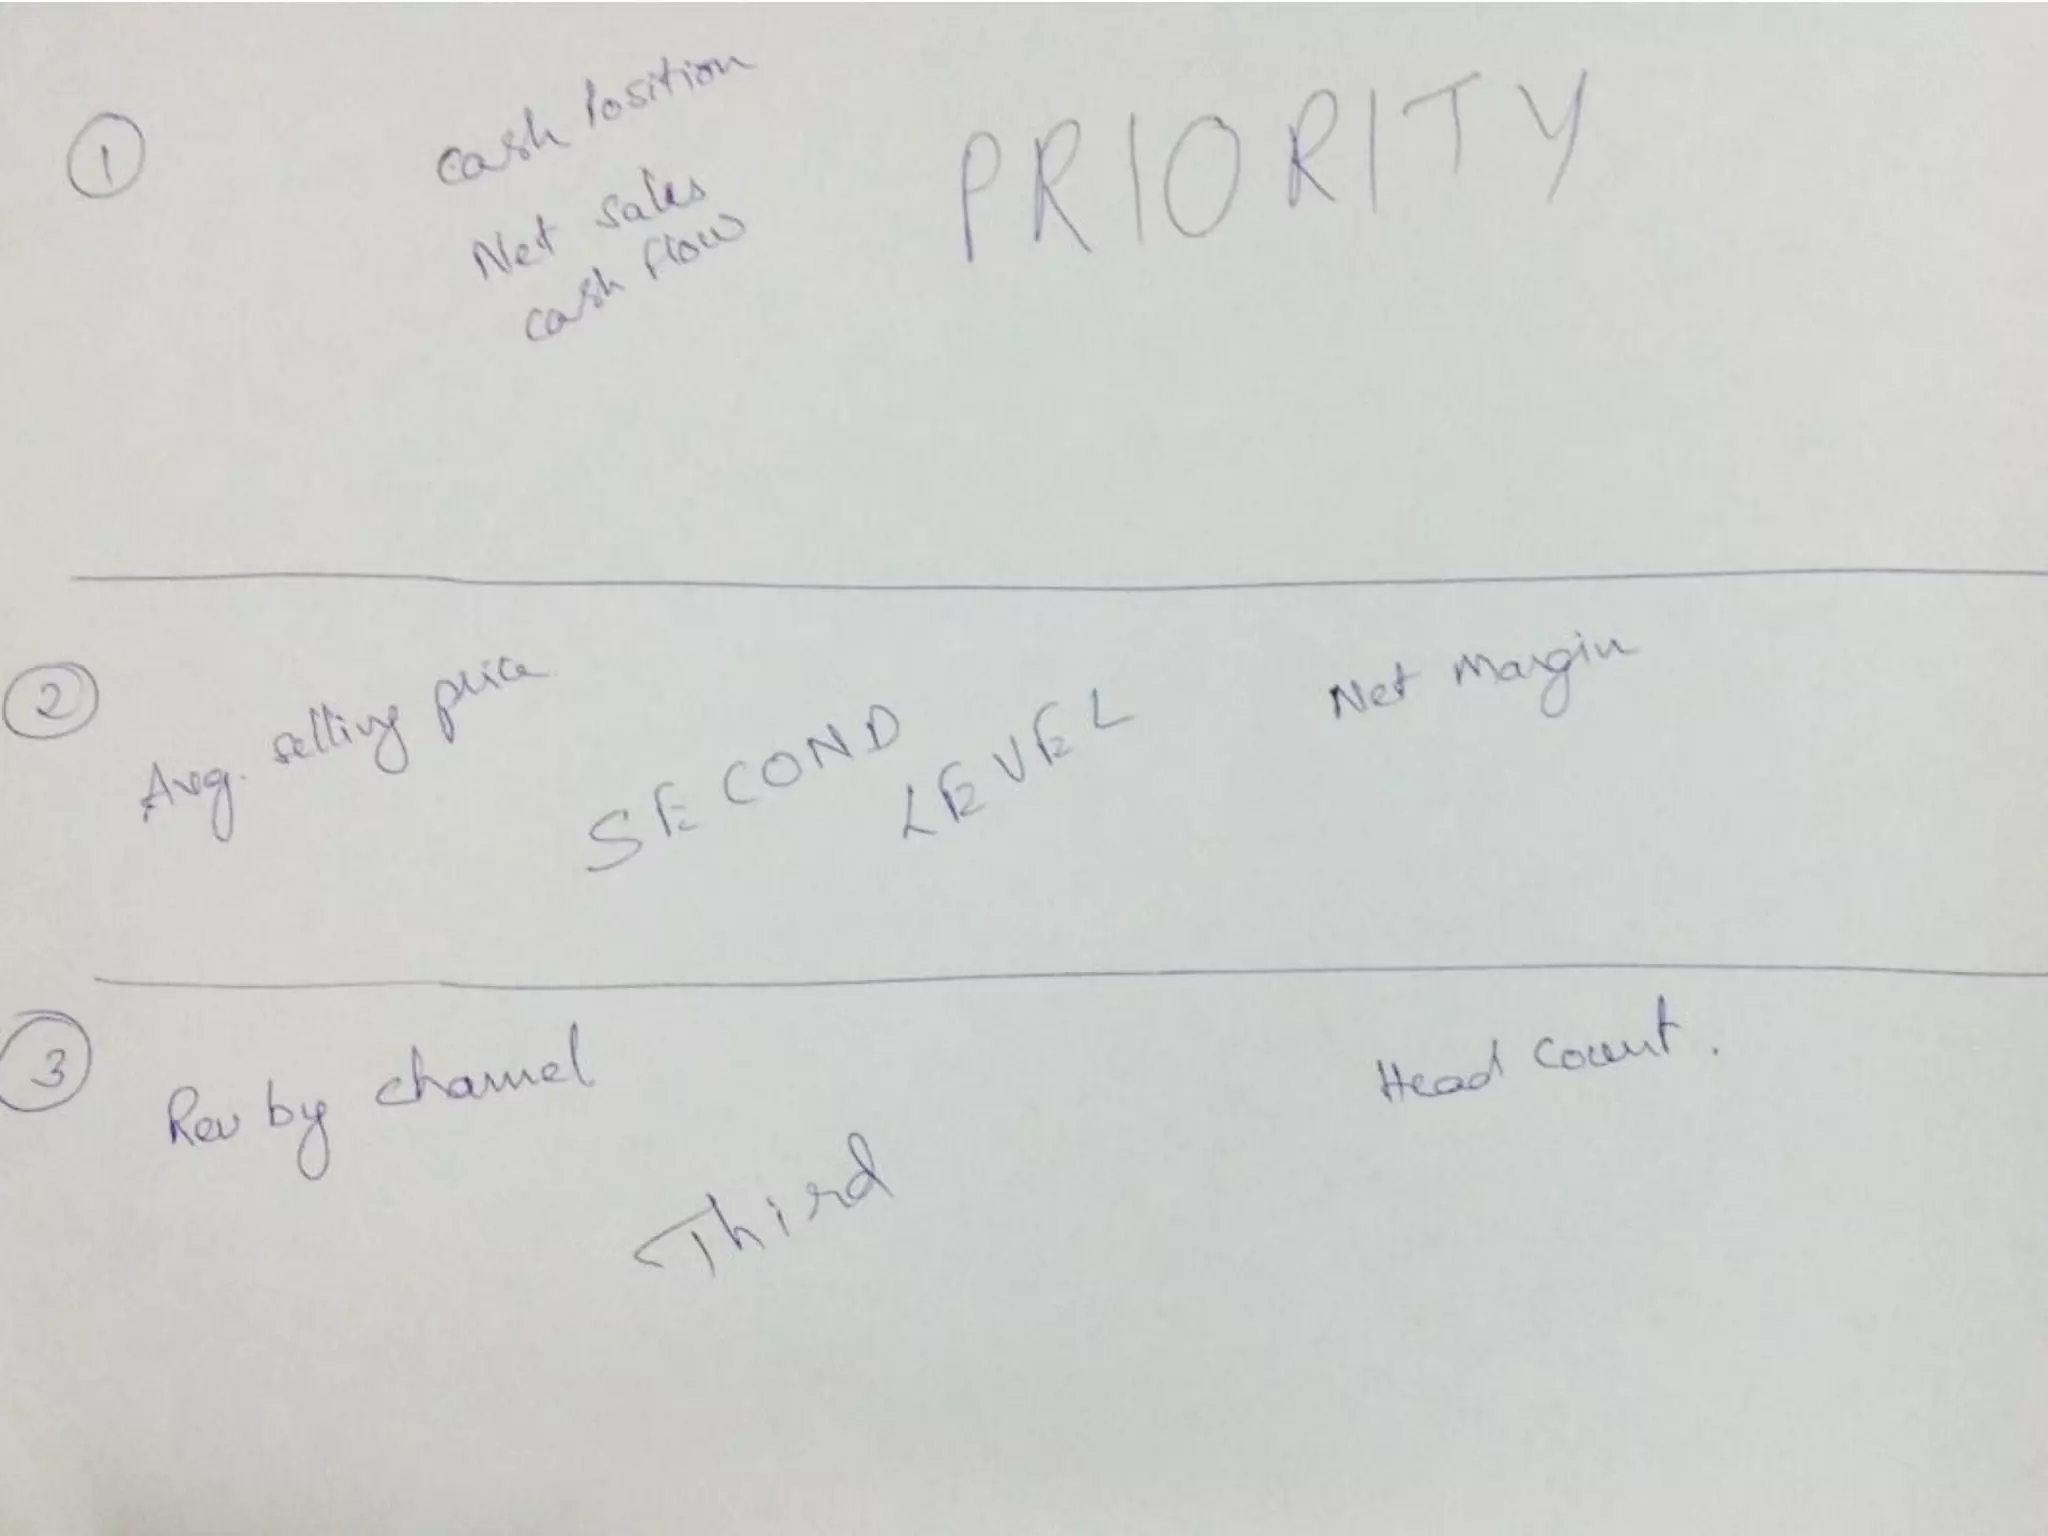
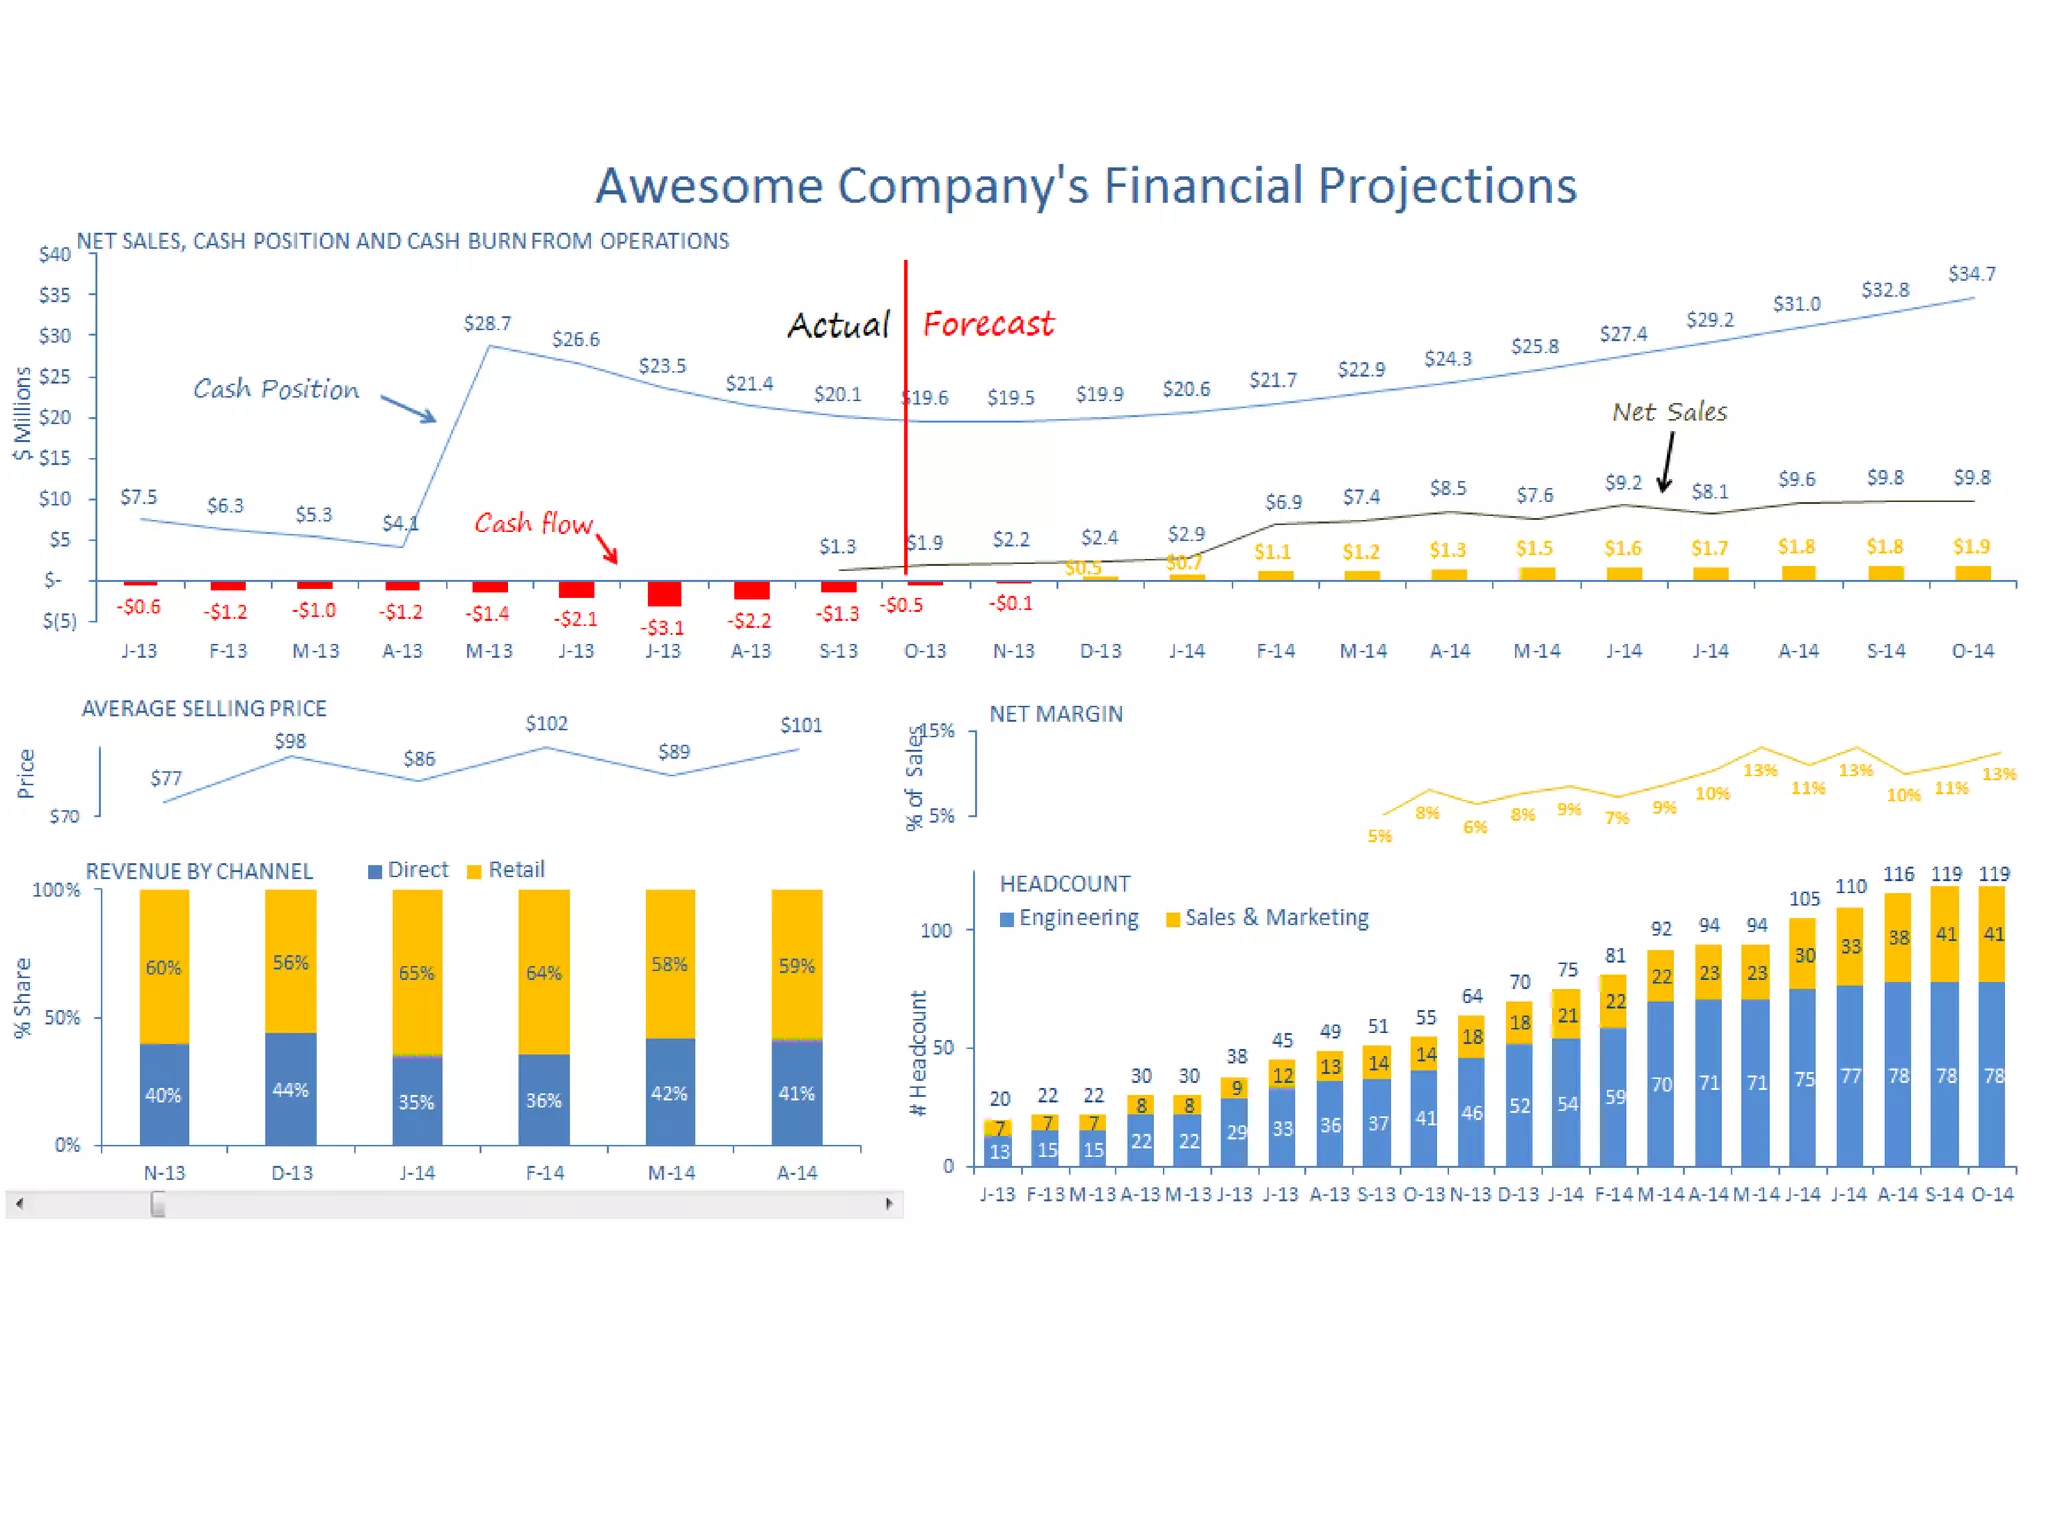
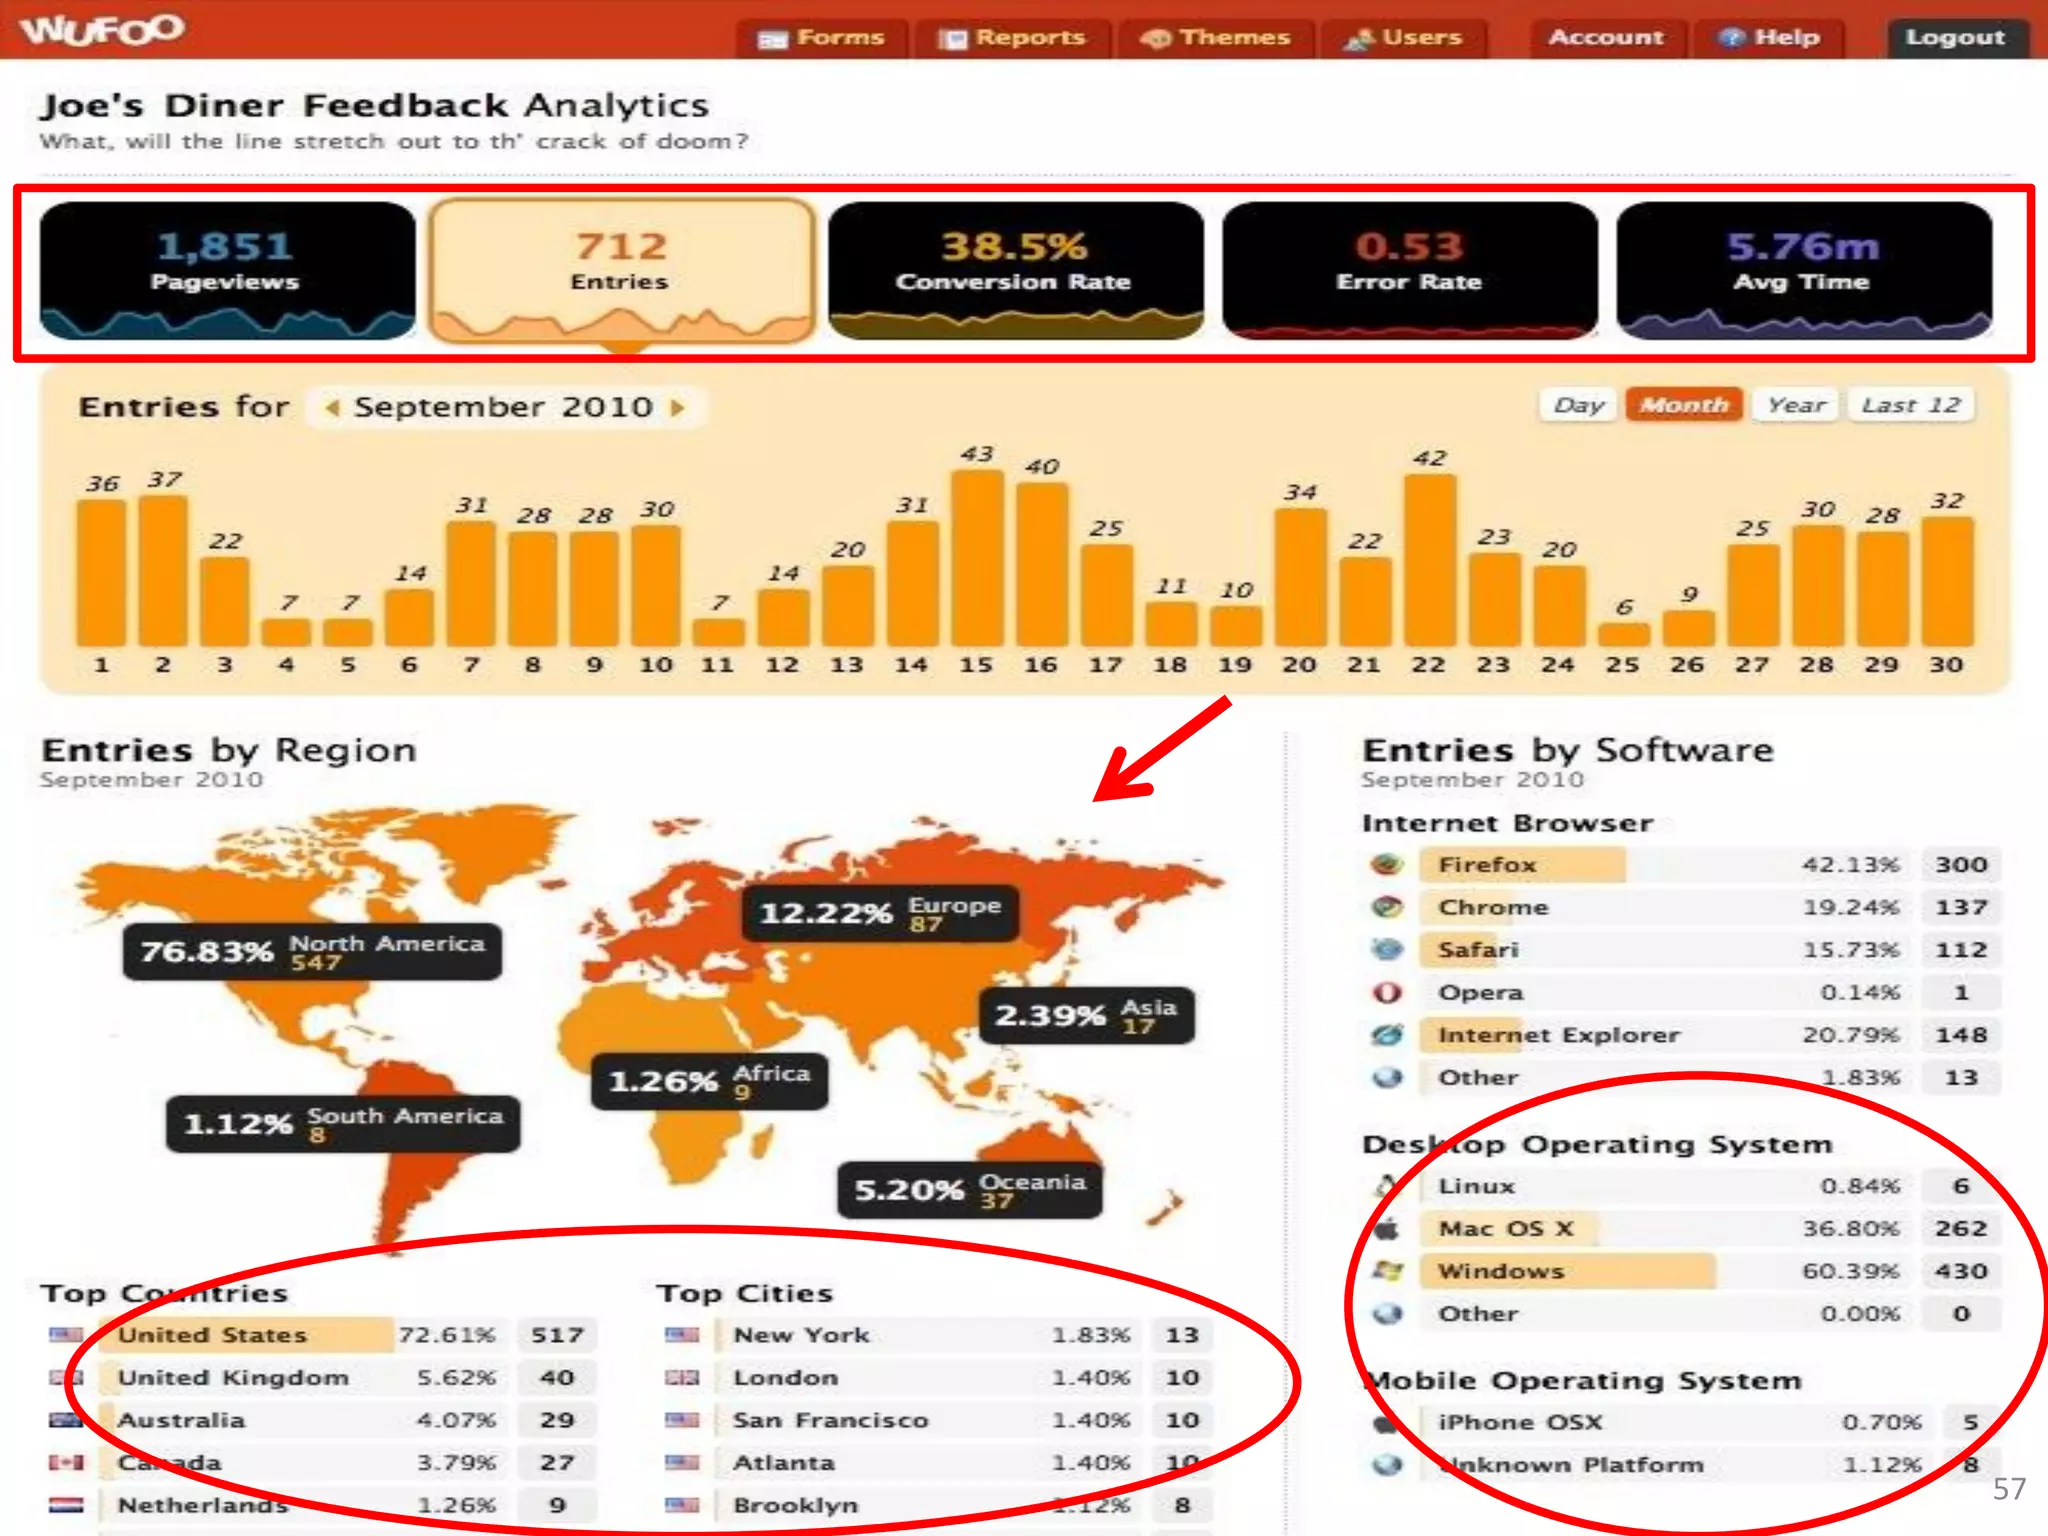
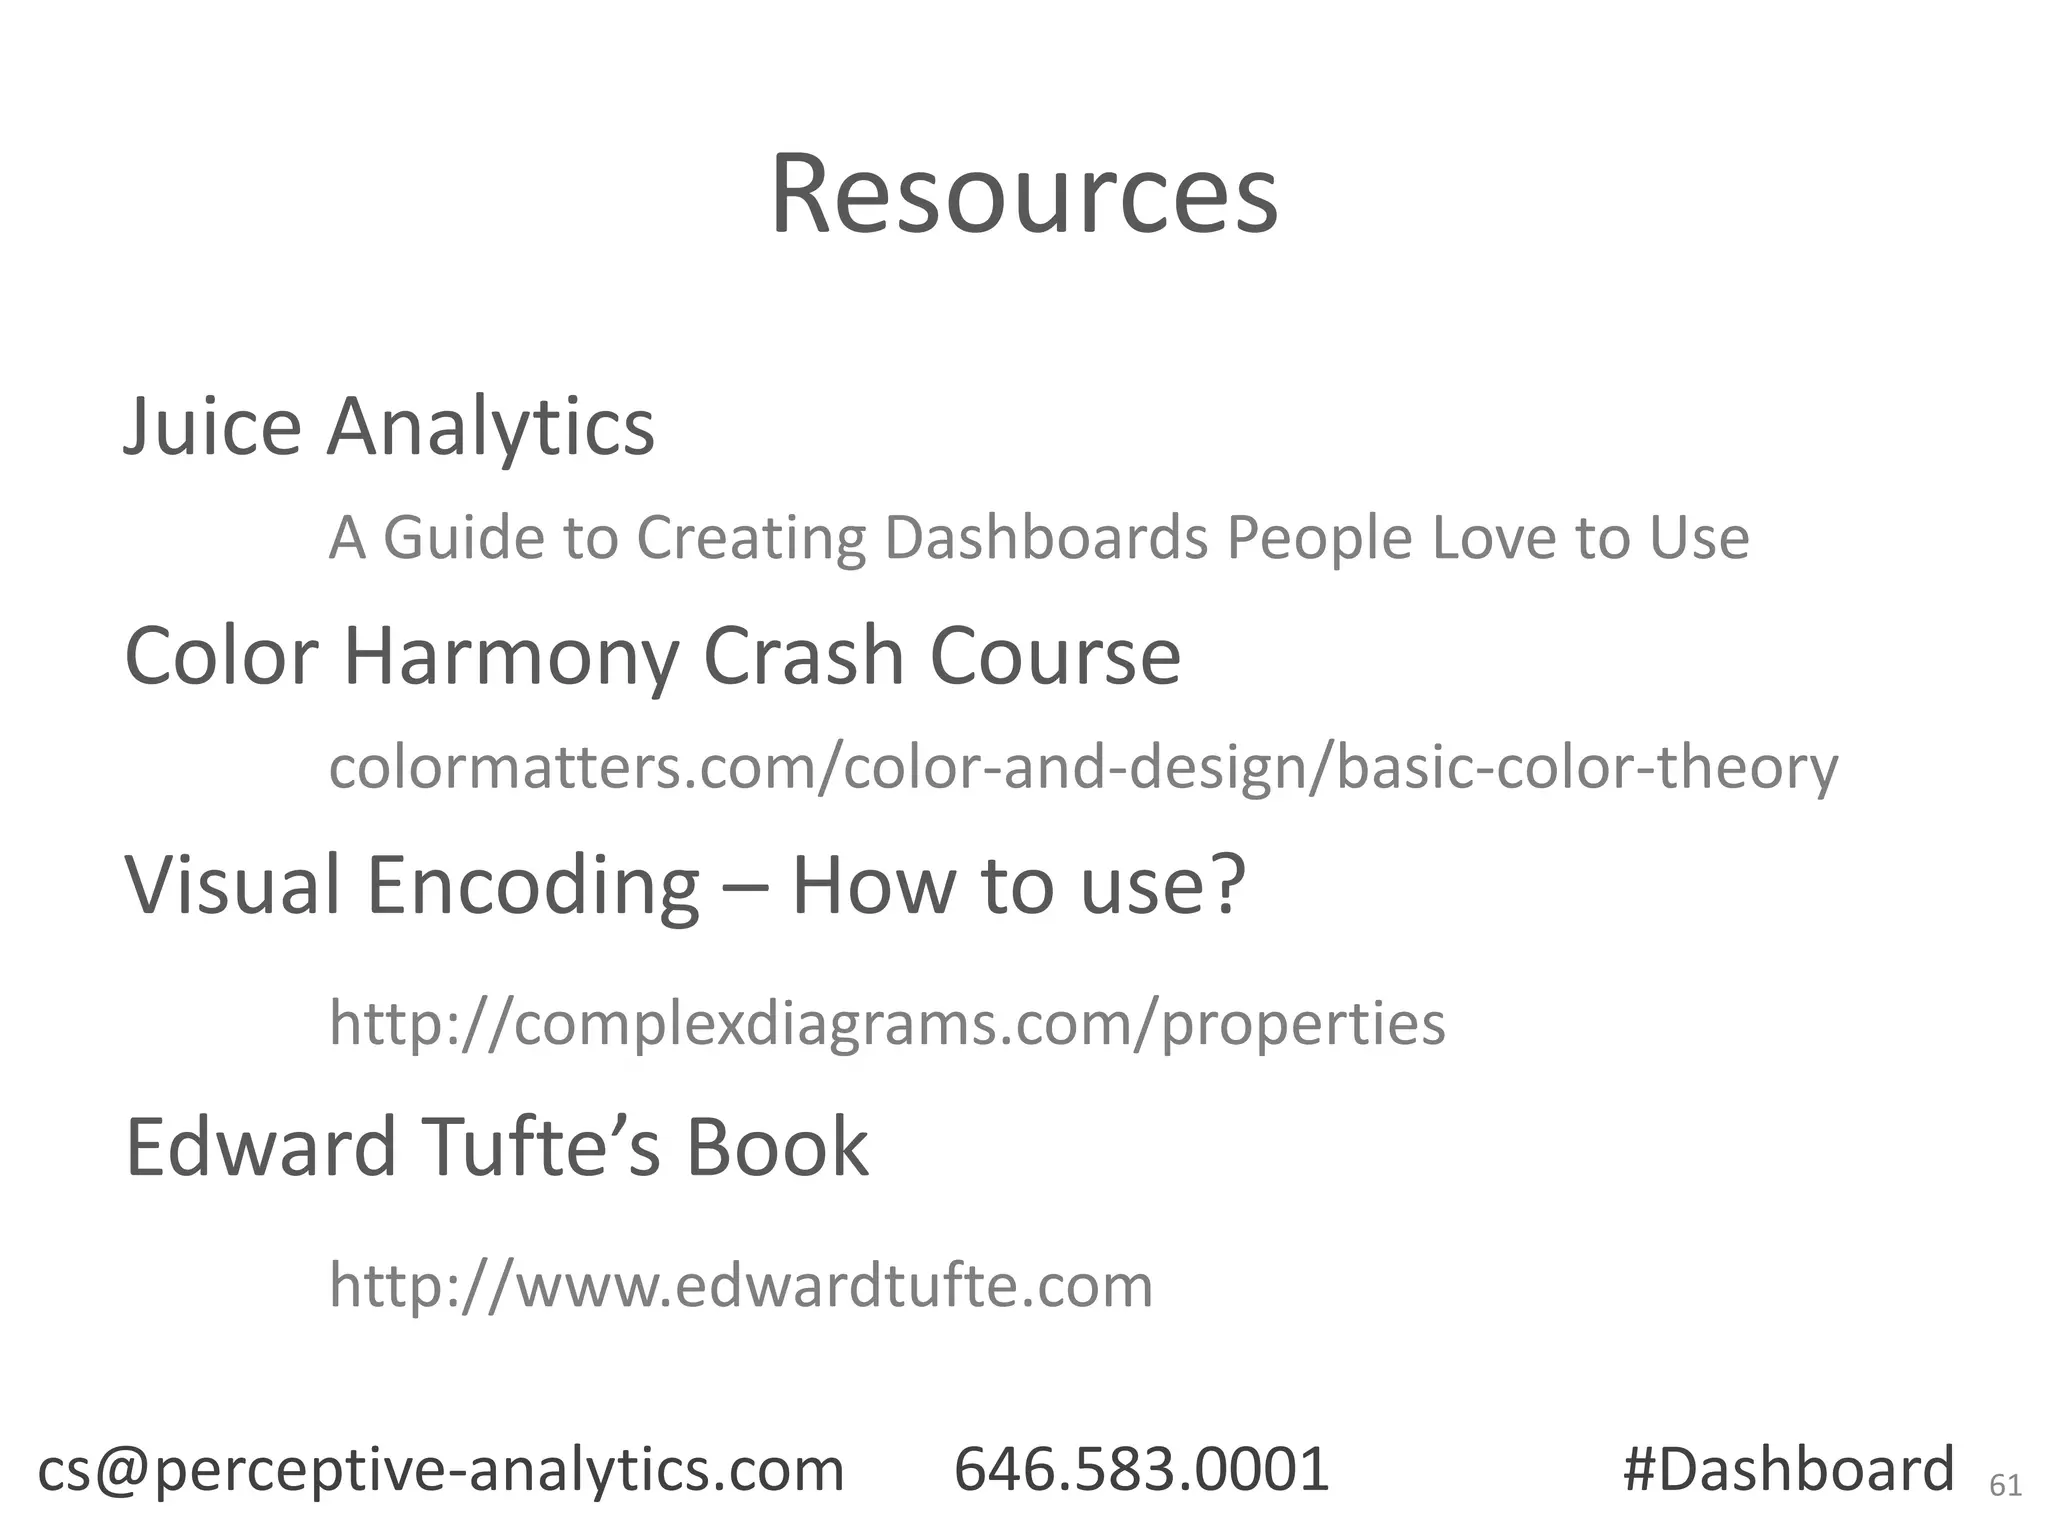
Creating Compelling Dashboards
for Finance Professionals

Chaitanya Sagar
cs@perceptive-analytics.com
646.583.0001

Adarsh A
aa@perceptive-analytics.com
646.583.0042
Data Analytics | Web Analytics | Spreadsheet Solutions

New York

Miami

Hyderabad
2
Our Services
Analytics

Web
Analytics

Spreadsheet
Solutions

Marketing
Marketing Mix Modeling
Segmentation

Price Promotion Analysis
Market Profiling

Catalogue Optimization
Churn Analysis

Liquidity Risk Management
Fraud Detection

Capital Allocation Analysis

Demand Analytics
Freight Lane Analytics

Distribution Network Optimization

Risk Management
Credit Risk Management
Collateral Management

Supply Chain
Inventory Optimization
Sourcing Analytics

3
Our Services
Analytics

Web
Analytics

Traffic Generation Strategy
AdWords Analytics
Search Engine Optimization

Spreadsheet
Solutions

Conversion Optimization
Revenue Analytics
Customer Behavior Analytics

4
Our Services
Analytics

Web
Analytics
Financial Modeling
Dashboards
Reporting
Predictive Modeling

Spreadsheet
Solutions
Spreadsheet Applications
Performance Tracking
Contract Negotiation
Litigation Modeling

5
#Dashboard

6
Which industry do you work in?
• Information Technology &
Services
• Financial Services
• Management Consulting
• Telecommunications
• Others
cs@perceptive-analytics.com

646.583.0001

#Dashboard10
DASHBOARDS

cs@perceptive-analytics.com

646.583.0001

#Dashboard

11
What audience see

Your Work!

Pic by http://blackbeltbartending.com

cs@perceptive-analytics.com

646.583.0001

#Dashboard

12
Dashboard

Pic by http://blackbeltbartending.com

cs@perceptive-analytics.com

646.583.0001

#Dashboard

13
A Dashboard is a Communication Tool

Priorities
Performance
Insights
Action Items

cs@perceptive-analytics.com

646.583.0001

#Dashboard

14
A Dashboard Increases Your Visibility
The invisible you

Good Dashboard

The real you

Craigyc

cs@perceptive-analytics.com

646.583.0001

#Dashboard

15
What is a Dashboard?

Background Pic Bev Goodwin

http://dilbert.com/strips/comic/2007-05-16/

Dilbert is awesome! http://dilbert.com/strips/comic/2007-05-16/

cs@perceptive-analytics.com

646.583.0001

#Dashboard

16
At-a-glance

Pic mhawkin2

cs@perceptive-analytics.com

646.583.0001

#Dashboard

17
Pic by plaits

Key Performance Indicators

cs@perceptive-analytics.com

646.583.0001

#Dashboard

18
Graphical

Pic Yossari

cs@perceptive-analytics.com

646.583.0001

#Dashboard

19
Pic by Toolstop

How to Make a Dashboard

cs@perceptive-analytics.com

646.583.0001

#Dashboard

20
Purpose

cs@perceptive-analytics.com

Design

646.583.0001

#Dashboard

21
Audience

Value Add

cs@perceptive-analytics.com

646.583.0001

Scope

#Dashboard

Pic by Mervi Eskelinen

Purpose

22
Target Audience
What is the role of the person?
What is the context of usage?
What are their biases?
Is the audience heterogeneous?
What are their goals?
What questions will they ask?

cs@perceptive-analytics.com

646.583.0001

#Dashboard

23
What Value Add?

cs@perceptive-analytics.com

646.583.0001

Pic by MDGovpics

Help management stay on top
Help management make a decision
Set goals for individuals or groups
Highlight exceptions
Track progress
Inform important information to teams

#Dashboard

24
Scope
Organization Wide

One Operation/Unit
Tactical

Historical

Predictive

High Level

Detailed

Snapshot

Interactive

cs@perceptive-analytics.com

646.583.0001

#Dashboard

Pic by futureatlas.com

Strategic

25
Strategic?

26
Design

cs@perceptive-analytics.com

646.583.0001

#Dashboard

27
Design
Structure
Elements
Colors
Process
cs@perceptive-analytics.com

646.583.0001

#Dashboard

28
Design
Structure
Elements
Colors
Process
cs@perceptive-analytics.com

646.583.0001

Case study

#Dashboard

29
Dashboard design should support
analytical thinking

cs@perceptive-analytics.com

646.583.0001

#Dashboard

30
Structure

cs@perceptive-analytics.com

646.583.0001

#Dashboard

31
32
Important

Important

Canvas

33
1

2

3

4

cs@perceptive-analytics.com

646.583.0001

#Dashboard

34
Importance

Inputs

cs@perceptive-analytics.com

Outputs

646.583.0001

#Dashboard

35
cs@perceptive-analytics.com

646.583.0001

#Dashboard

37
Important

Importance

cs@perceptive-analytics.com

646.583.0001

#Dashboard

38
39
Step 1

cs@perceptive-analytics.com

Step 2

646.583.0001

Step 3

#Dashboard

40
http://www.flickr.com/photos/9731367@N02/

Choosing Dashboard Elements

cs@perceptive-analytics.com

646.583.0001

#Dashboard

41
www.diverbi.com
Colors

cs@perceptive-analytics.com

646.583.0001

#Dashboard

46
Colors

Create Color Harmony

cs@perceptive-analytics.com

646.583.0001

#Dashboard

47
Ideas for Color Harmony
Analogous

Complementary
Use colorbrewer2.org

cs@perceptive-analytics.com

646.583.0001

#Dashboard

48
Perceptive’s

Step Process

1. Create a laundry list of KPIs
2. Prioritize. Choose the top 20% that has 80+%
impact
3. Allocate the 20% to most visible areas
4. Choose elements wisely
5. Beautify
cs@perceptive-analytics.com

646.583.0001

#Dashboard

49
Laundry List
•
•
•
•
•
•
•
•
•
•
•
•
•
•
•

Cost of Goods Sold
Advance paid to manufacturer
Average cost of acquisition
Advertisement expenditure
Revenue by channel
Sundry debtors
Accounts payable
Prepaid expenses
Miscellaneous expenses
Net profit
Salaries
Short-term Investments
Long-term investments
Citibank Checking Account
Bank of America Checking
Account

•
•
•
•
•
•
•
•
•
•
•
•
•
•
•

Actual
Forecast
Net Sales
Gross sales
Cash position
Net margin
Total head count
Average selling price
Revenue by product
Total expenses
Gross margin
Head count by department
Total head count
Debt Equity Ratio
Equity

•
•
•
•
•
•
•
•

Depreciation
Income taxes
EBITDA
General and Administrative
Expenses
Work in progress
Gross profit
Preference Shares
Cash flow
Context
•
•
•
•
•

CEO worried about cash position
Sales are just picking up
“How many can we hire now?”
“Can we spend marketing dollars as planned?”
“Are our (profitable) direct sales picking up?”
Priority
•
•
•
•
•
•
•
•
•
•
•
•
•
•
•

Cost of Goods Sold
Advance paid to manufacturer
Average cost of acquisition
Advertisement expenditure
Revenue by channel
Sundry debtors
Accounts payable
Prepaid expenses
Miscellaneous expenses
Net profit
Salaries
Short-term Investments
Long-term investments
Citibank Checking Account
Bank of America Checking
Account

•
•
•
•
•
•
•
•
•
•
•
•
•
•
•

Actual
Forecast
Net Sales
Gross sales
Cash position
Net margin
Total head count
Average selling price
Revenue by product
Total expenses
Gross margin
Head count by department
Total head count
Debt Equity Ratio
Equity

•
•
•
•
•
•
•
•

Depreciation
Income taxes
EBITDA
General and Administrative
Expenses
Work in progress
Gross profit
Preference Shares
Cash flow
Draw a draft dashboard manually. A
paper and a pencil works best!
Examples and Critique of
Dashboards

56
57
No Reference

X
100% is how much?

No Index

Different
Periods

58
$M

$M

Axis?

$M

$M

Axis?
Resources
Juice Analytics
A Guide to Creating Dashboards People Love to Use

Color Harmony Crash Course
colormatters.com/color-and-design/basic-color-theory

Visual Encoding – How to use?
http://complexdiagrams.com/properties

Edward Tufte’s Book
http://www.edwardtufte.com
cs@perceptive-analytics.com

646.583.0001

#Dashboard

61
Perceptive’s Dashboard Tool Kit
http://www.perceptive-analytics.com/exceldashboard-reporting/#dbtk
(link will be sent to you via chat)

62
Your Feedback on this Webinar
• Below Expectations
• Met Expectations
• Above Expectations

cs@perceptive-analytics.com

646.583.0001

#Dashboard

63
Webinar – How to create a Winning
Budgeting

January 22, 2014

cs@perceptive-analytics.com

646.583.0001

#Dashboard

64
Thank you!
cs@perceptive-analytics.com
+1.646.583.0001

65

Create Compelling Dashboards for Finance Professionals