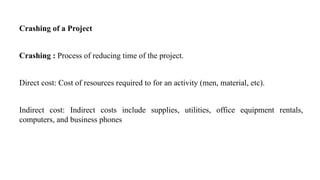
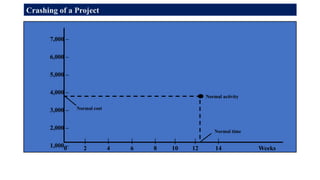
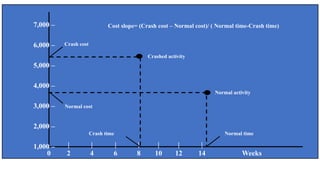
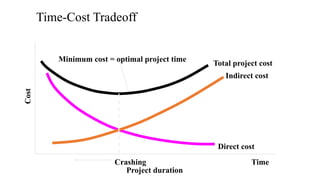
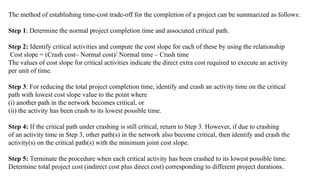
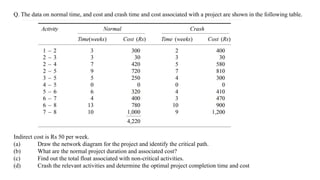
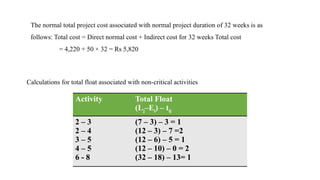
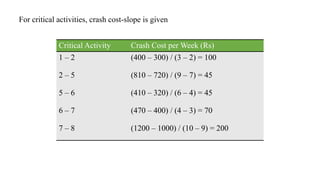
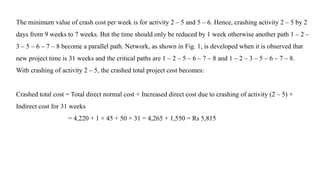
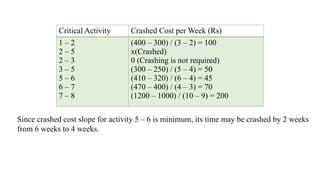
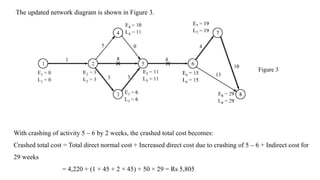
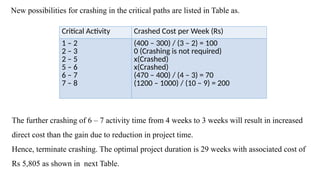
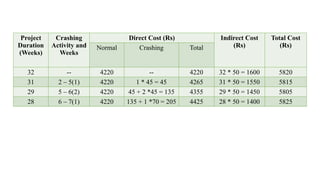
Crashing : Process of reducing time of the project.
Elements of costs
(i)Material
(ii)Labour
(iii) Expenses
(i) Material
Direct : Raw material and components
Indirect: consumable stores, lubricants, cotton waste, cleaning material, stationary , etc.
(ii) Labour
Direct : Employees engaged in manufacturing/activity of a project.
Indirect: Store clerk, material handling staff, supervisors, foremen, works manager etc.
(
iii) Expenses :
Direct- Payments made to consultants, designers, cost of rework.
Indirect- Rent of building, telephone bills, insurance, lighting expenses.
Crashing of a Project
Crashing : Process of reducing time of the project.
Direct cost: Cost of resources required to for an activity (men, material, etc).
Indirect cost: Indirect costs include supplies, utilities, office equipment rentals,
computers, and business phones
7,000 –
6,000 –
5,000 –
4,000 –
3,000 –
2,000 –
1,000 –
| | | | | | |
0 2 4 6 8 10 12 14 Weeks
Normal activity
Normal time
Normal cost
Crashing of a Project.
12
8 0
4 12
4 4
4
1 2 4 6 7
3
5
Housebuilding Network
7,000 –
6,000 –
5,000 –
4,000 –
3,000 –
2,000 –
1,000 –
–
| | | | | | |
0 2 4 6 8 10 12 14 Weeks
Crash cost
Crashed activity
Normal activity
Normal time
Crash time
Normal cost
Cost slope= (Crash cost – Normal cost)/ ( Normal time-Crash time)
Time-Cost Tradeoff
Cost
Project duration
Crashing Time
Minimum cost = optimal project time
Total project cost
Indirect cost
Direct cost
The method of establishing time-cost trade-off for the completion of a project can be summarized as follows:
Step 1: Determine the normal project completion time and associated critical path.
Step 2: Identify critical activities and compute the cost slope for each of these by using the relationship
Cost slope = (Crash cost– Normal cost)/ Normal time – Crash time
The values of cost slope for critical activities indicate the direct extra cost required to execute an activity
per unit of time.
Step 3: For reducing the total project completion time, identify and crash an activity time on the critical
path with lowest cost slope value to the point where
(i) another path in the network becomes critical, or
(ii) the activity has been crash to its lowest possible time.
Step 4: If the critical path under crashing is still critical, return to Step 3. However, if due to crashing
of an activity time in Step 3, other path(s) in the network also become critical, then identify and crash the
activity(s) on the critical path(s) with the minimum joint cost slope.
Step 5: Terminate the procedure when each critical activity has been crashed to its lowest possible time.
Determine total project cost (indirect cost plus direct cost) corresponding to different project durations.
Q. The data on normal time, and cost and crash time and cost associated with a project are shown in the following table.
Indirect cost is Rs 50 per week.
(a) Draw the network diagram for the project and identify the critical path.
(b) What are the normal project duration and associated cost?
(c) Find out the total float associated with non-critical activities.
(d) Crash the relevant activities and determine the optimal project completion time and cost
The critical path is: 1 – 2 – 5 – 6 – 7 – 8 with a project completion time of 32 weeks.
Figure-1
Calculations for total float associated with non-critical activities
The normal total project cost associated with normal project duration of 32 weeks is as
follows: Total cost = Direct normal cost + Indirect cost for 32 weeks Total cost
= 4,220 + 50 × 32 = Rs 5,820
Activity Total Float
(Lj–Ei) – tij
2 – 3
2 – 4
3 – 5
4 – 5
6 - 8
(7 – 3) – 3 = 1
(12 – 3) – 7 =2
(12 – 6) – 5 = 1
(12 – 10) – 0 = 2
(32 – 18) – 13= 1
For critical activities, crash cost-slope is given
Critical Activity Crash Cost per Week (Rs)
1 – 2
2 – 5
5 – 6
6 – 7
7 – 8
(400 – 300) / (3 – 2) = 100
(810 – 720) / (9 – 7) = 45
(410 – 320) / (6 – 4) = 45
(470 – 400) / (4 – 3) = 70
(1200 – 1000) / (10 – 9) = 200
The minimum value of crash cost per week is for activity 2 – 5 and 5 – 6. Hence, crashing activity 2 – 5 by 2
days from 9 weeks to 7 weeks. But the time should only be reduced by 1 week otherwise another path 1 – 2 –
3 – 5 – 6 – 7 – 8 become a parallel path. Network, as shown in Fig. 1, is developed when it is observed that
new project time is 31 weeks and the critical paths are 1 – 2 – 5 – 6 – 7 – 8 and 1 – 2 – 3 – 5 – 6 – 7 – 8.
With crashing of activity 2 – 5, the crashed total project cost becomes:
Crashed total cost = Total direct normal cost + Increased direct cost due to crashing of activity (2 – 5) +
Indirect cost for 31 weeks
= 4,220 + 1 × 45 + 50 × 31 = 4,265 + 1,550 = Rs 5,815
Figure-2
For revised network shown in Figure 2, new possibilities for crashing critical activities are listed in in the next Table.
Since crashed cost slope for activity 5 – 6 is minimum, its time may be crashed by 2 weeks
from 6 weeks to 4 weeks.
Critical Activity Crashed Cost per Week (Rs)
1 – 2
2 – 5
2 – 3
3 – 5
5 – 6
6 – 7
7 – 8
(400 – 300) / (3 – 2) = 100
x(Crashed)
0 (Crashing is not required)
(300 – 250) / (5 – 4) = 50
(410 – 320) / (6 – 4) = 45
(470 – 400) / (4 – 3) = 70
(1200 – 1000) / (10 – 9) = 200
The updated network diagram is shown in Figure 3.
Figure 3
With crashing of activity 5 – 6 by 2 weeks, the crashed total cost becomes:
Crashed total cost = Total direct normal cost + Increased direct cost due to crashing of 5 – 6 + Indirect cost for
29 weeks
= 4,220 + (1 × 45 + 2 × 45) + 50 × 29 = Rs 5,805
New possibilities for crashing in the critical paths are listed in Table as.
The further crashing of 6 – 7 activity time from 4 weeks to 3 weeks will result in increased
direct cost than the gain due to reduction in project time.
Hence, terminate crashing. The optimal project duration is 29 weeks with associated cost of
Rs 5,805 as shown in next Table.
Critical Activity Crashed Cost per Week (Rs)
1 – 2
2 – 3
2 – 5
5 – 6
6 – 7
7 – 8
(400 – 300) / (3 – 2) = 100
0 (Crashing is not required)
x(Crashed)
x(Crashed)
(470 – 400) / (4 – 3) = 70
(1200 – 1000) / (10 – 9) = 200
Project
Duration
(Weeks)
Crashing
Activity and
Weeks
Direct Cost (Rs) Indirect Cost
(Rs)
Total Cost
(Rs)
Normal Crashing Total
32 -- 4220 -- 4220 32 * 50 = 1600 5820
31 2 – 5(1) 4220 1 * 45 = 45 4265 31 * 50 = 1550 5815
29 5 – 6(2) 4220 45 + 2 *45 = 135 4355 29 * 50 = 1450 5805
28 6 – 7(1) 4220 135 + 1 *70 = 205 4425 28 * 50 = 1400 5825

crashing.pptxbbbbbbbbbbbbbbbbbbbbbbbbbbbbbb

  • 1.
    Crashing : Processof reducing time of the project.
  • 2.
  • 3.
    (i) Material Direct :Raw material and components Indirect: consumable stores, lubricants, cotton waste, cleaning material, stationary , etc. (ii) Labour Direct : Employees engaged in manufacturing/activity of a project. Indirect: Store clerk, material handling staff, supervisors, foremen, works manager etc. ( iii) Expenses : Direct- Payments made to consultants, designers, cost of rework. Indirect- Rent of building, telephone bills, insurance, lighting expenses.
  • 4.
    Crashing of aProject Crashing : Process of reducing time of the project. Direct cost: Cost of resources required to for an activity (men, material, etc). Indirect cost: Indirect costs include supplies, utilities, office equipment rentals, computers, and business phones
  • 5.
    7,000 – 6,000 – 5,000– 4,000 – 3,000 – 2,000 – 1,000 – | | | | | | | 0 2 4 6 8 10 12 14 Weeks Normal activity Normal time Normal cost Crashing of a Project.
  • 6.
    12 8 0 4 12 44 4 1 2 4 6 7 3 5 Housebuilding Network 7,000 – 6,000 – 5,000 – 4,000 – 3,000 – 2,000 – 1,000 – – | | | | | | | 0 2 4 6 8 10 12 14 Weeks Crash cost Crashed activity Normal activity Normal time Crash time Normal cost Cost slope= (Crash cost – Normal cost)/ ( Normal time-Crash time)
  • 7.
    Time-Cost Tradeoff Cost Project duration CrashingTime Minimum cost = optimal project time Total project cost Indirect cost Direct cost
  • 8.
    The method ofestablishing time-cost trade-off for the completion of a project can be summarized as follows: Step 1: Determine the normal project completion time and associated critical path. Step 2: Identify critical activities and compute the cost slope for each of these by using the relationship Cost slope = (Crash cost– Normal cost)/ Normal time – Crash time The values of cost slope for critical activities indicate the direct extra cost required to execute an activity per unit of time. Step 3: For reducing the total project completion time, identify and crash an activity time on the critical path with lowest cost slope value to the point where (i) another path in the network becomes critical, or (ii) the activity has been crash to its lowest possible time. Step 4: If the critical path under crashing is still critical, return to Step 3. However, if due to crashing of an activity time in Step 3, other path(s) in the network also become critical, then identify and crash the activity(s) on the critical path(s) with the minimum joint cost slope. Step 5: Terminate the procedure when each critical activity has been crashed to its lowest possible time. Determine total project cost (indirect cost plus direct cost) corresponding to different project durations.
  • 9.
    Q. The dataon normal time, and cost and crash time and cost associated with a project are shown in the following table. Indirect cost is Rs 50 per week. (a) Draw the network diagram for the project and identify the critical path. (b) What are the normal project duration and associated cost? (c) Find out the total float associated with non-critical activities. (d) Crash the relevant activities and determine the optimal project completion time and cost
  • 10.
    The critical pathis: 1 – 2 – 5 – 6 – 7 – 8 with a project completion time of 32 weeks. Figure-1
  • 11.
    Calculations for totalfloat associated with non-critical activities The normal total project cost associated with normal project duration of 32 weeks is as follows: Total cost = Direct normal cost + Indirect cost for 32 weeks Total cost = 4,220 + 50 × 32 = Rs 5,820 Activity Total Float (Lj–Ei) – tij 2 – 3 2 – 4 3 – 5 4 – 5 6 - 8 (7 – 3) – 3 = 1 (12 – 3) – 7 =2 (12 – 6) – 5 = 1 (12 – 10) – 0 = 2 (32 – 18) – 13= 1
  • 12.
    For critical activities,crash cost-slope is given Critical Activity Crash Cost per Week (Rs) 1 – 2 2 – 5 5 – 6 6 – 7 7 – 8 (400 – 300) / (3 – 2) = 100 (810 – 720) / (9 – 7) = 45 (410 – 320) / (6 – 4) = 45 (470 – 400) / (4 – 3) = 70 (1200 – 1000) / (10 – 9) = 200
  • 13.
    The minimum valueof crash cost per week is for activity 2 – 5 and 5 – 6. Hence, crashing activity 2 – 5 by 2 days from 9 weeks to 7 weeks. But the time should only be reduced by 1 week otherwise another path 1 – 2 – 3 – 5 – 6 – 7 – 8 become a parallel path. Network, as shown in Fig. 1, is developed when it is observed that new project time is 31 weeks and the critical paths are 1 – 2 – 5 – 6 – 7 – 8 and 1 – 2 – 3 – 5 – 6 – 7 – 8. With crashing of activity 2 – 5, the crashed total project cost becomes: Crashed total cost = Total direct normal cost + Increased direct cost due to crashing of activity (2 – 5) + Indirect cost for 31 weeks = 4,220 + 1 × 45 + 50 × 31 = 4,265 + 1,550 = Rs 5,815
  • 14.
    Figure-2 For revised networkshown in Figure 2, new possibilities for crashing critical activities are listed in in the next Table.
  • 15.
    Since crashed costslope for activity 5 – 6 is minimum, its time may be crashed by 2 weeks from 6 weeks to 4 weeks. Critical Activity Crashed Cost per Week (Rs) 1 – 2 2 – 5 2 – 3 3 – 5 5 – 6 6 – 7 7 – 8 (400 – 300) / (3 – 2) = 100 x(Crashed) 0 (Crashing is not required) (300 – 250) / (5 – 4) = 50 (410 – 320) / (6 – 4) = 45 (470 – 400) / (4 – 3) = 70 (1200 – 1000) / (10 – 9) = 200
  • 16.
    The updated networkdiagram is shown in Figure 3. Figure 3 With crashing of activity 5 – 6 by 2 weeks, the crashed total cost becomes: Crashed total cost = Total direct normal cost + Increased direct cost due to crashing of 5 – 6 + Indirect cost for 29 weeks = 4,220 + (1 × 45 + 2 × 45) + 50 × 29 = Rs 5,805
  • 17.
    New possibilities forcrashing in the critical paths are listed in Table as. The further crashing of 6 – 7 activity time from 4 weeks to 3 weeks will result in increased direct cost than the gain due to reduction in project time. Hence, terminate crashing. The optimal project duration is 29 weeks with associated cost of Rs 5,805 as shown in next Table. Critical Activity Crashed Cost per Week (Rs) 1 – 2 2 – 3 2 – 5 5 – 6 6 – 7 7 – 8 (400 – 300) / (3 – 2) = 100 0 (Crashing is not required) x(Crashed) x(Crashed) (470 – 400) / (4 – 3) = 70 (1200 – 1000) / (10 – 9) = 200
  • 18.
    Project Duration (Weeks) Crashing Activity and Weeks Direct Cost(Rs) Indirect Cost (Rs) Total Cost (Rs) Normal Crashing Total 32 -- 4220 -- 4220 32 * 50 = 1600 5820 31 2 – 5(1) 4220 1 * 45 = 45 4265 31 * 50 = 1550 5815 29 5 – 6(2) 4220 45 + 2 *45 = 135 4355 29 * 50 = 1450 5805 28 6 – 7(1) 4220 135 + 1 *70 = 205 4425 28 * 50 = 1400 5825