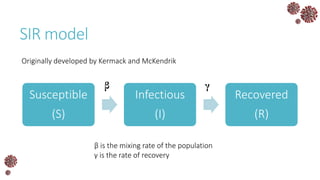
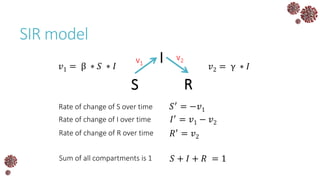
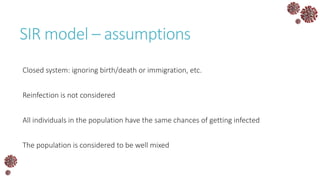
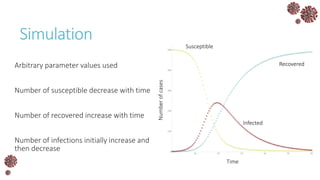
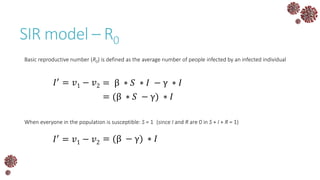
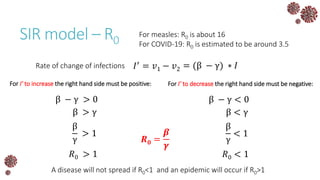
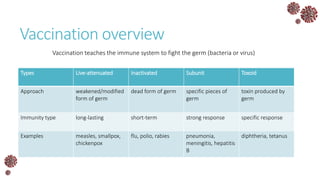
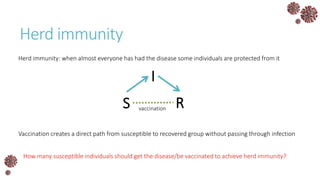
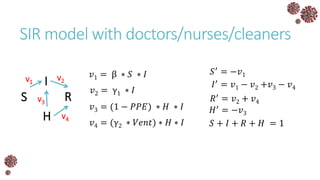
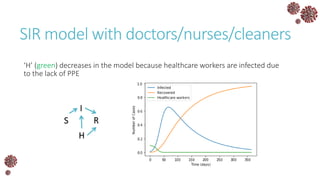
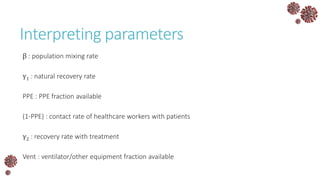
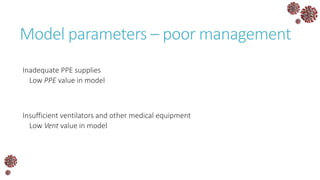
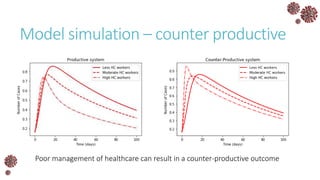
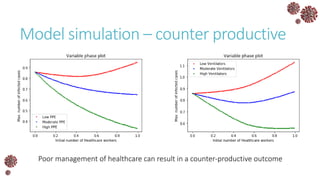
Mathematically
modelling the spread of
COVID-19
Thawfeek Mohamed Varusai
Scientific Data Analyst, EMBL-EBI, Cambridge, UK
History of modelling epidemics
Started as early as the 15th century.
First prominent modelling effort was done in the 16th century by Daniel Bernoulli to
understand small pox vaccination
Other early efforts include the spatial and temporal study of cholera spread in London
by John Snow in the mid 17th century
Compartmental modelling
Most commonly used approach in epidemiology.
In the early 20th century it was believed that so long as mosquitoes were present in a population
malaria cannot be eliminated.
Dr Ross won the Nobel prize in 1902 for proving that malaria can be overcome by merely reducing
the mosquitoes population below a critical level.
He used a compartmental modelling approach to study the spread of malaria to estimate precise
numbers.
The concept of ‘basic reproduction number’ (R0) was born here.
Stochastic modelling
Used when there is incomplete mixing in a population –small population or people
with restriction contacts
In the initial phase of the epidemic, there are very few infected individuals who
have limited contacts
Under these circumstances, stochastic modelling is used to predict the spread
SIR model
Susceptible
(S)
Infectious
(I)
Recovered
(R)
Originally developed by Kermack and McKendrik
β γ
β is the mixing rate of the population
γ is the rate of recovery
SIR model
S
I
R
v1
v2
𝑆′
= −𝑣1
𝐼′ = 𝑣1 − 𝑣2
𝑅′ = 𝑣2
Rate of change of S over time
Rate of change of I over time
Rate of change of R over time
𝑆 + 𝐼 + 𝑅 = 1Sum of all compartments is 1
𝑣1 = β ∗ 𝑆 ∗ 𝐼 𝑣2 = γ ∗ 𝐼
SIR model – assumptions
Closed system: ignoring birth/death or immigration, etc.
Reinfection is not considered
All individuals in the population have the same chances of getting infected
The population is considered to be well mixed
Simulation
Arbitrary parameter values used
Number of susceptible decrease with time
Number of recovered increase with time
Number of infections initially increase and
then decrease
Susceptible
Recovered
Infected
TimeNumberofcases
SIR model – R0
𝐼′
= 𝑣1 − 𝑣2
Basic reproductive number (R0) is defined as the average number of people infected by an infected individual
= β ∗ 𝑆 ∗ 𝐼 − γ ∗ 𝐼
= (β ∗ 𝑆 − γ) ∗ 𝐼
When everyone in the population is susceptible: S = 1 (since I and R are 0 in S + I + R = 1)
= (β − γ) ∗ 𝐼𝐼′ = 𝑣1 − 𝑣2
SIR model – R0
= (β − γ) ∗ 𝐼𝐼′ = 𝑣1 − 𝑣2
For I’ to increase the right hand side must be positive:
β − γ > 0
β > γ
β
γ
> 1
𝑅0 > 1
For I’ to decrease the right hand side must be negative:
β − γ < 0
β < γ
β
γ
< 1
𝑅0 < 1
A disease will not spread if R0<1 and an epidemic will occur if R0>1
Rate of change of infections
𝑹 𝟎 =
𝜷
𝜸
For measles: R0 is about 16
For COVID-19: R0 is estimated to be around 3.5
Vaccination overview
Vaccination teaches the immune system to fight the germ (bacteria or virus)
Types Live-attenuated Inactivated Subunit Toxoid
Approach weakened/modified
form of germ
dead form of germ specific pieces of
germ
toxin produced by
germ
Immunity type long-lasting short-term strong response specific response
Examples measles, smallpox,
chickenpox
flu, polio, rabies pneumonia,
meningitis, hepatitis
B
diphtheria, tetanus
Herd immunity
Vaccination creates a direct path from susceptible to recovered group without passing through infection
How many susceptible individuals should get the disease/be vaccinated to achieve herd immunity?
S
I
Rvaccination
Herd immunity: when almost everyone has had the disease some individuals are protected from it
SIR model – herd immunity
(β ∗ 𝑆 − γ) ∗ 𝐼𝐼′
=Rate of change of infections
For infection to stop spreading:
𝐼′ = 0
β ∗ 𝑆 − γ = 0
since S + I + R = 1β ∗ (1 − (𝐼 + 𝑅)) − γ = 0
let (I + R) = ρβ ∗ (1 − ρ) − γ = 0
rearrangingρ = 1 −
γ
β
since 𝑅0 =
β
γρ = 𝟏 −
𝟏
𝑹 𝟎
Population that needs to be immune
For measles: ρ is close to 0.95
For COVID-19: ρ is estimated to be close to 0.70
SARS-CoV2
COVID-19 is a disease spread by a virus in the beta family of corona viruses
There have been other epidemics with the same family of virus before this – SARS in
2002, MERS in 2013 and now its COVID-19
COVID-19 virus is very similar to the SARS virus from 2002 and is also known as SARS-
CoV2
The primary infection site is the respiratory system through which the virus can enter
host cells and later spread to other organs
SIR model of SARS-CoV2
S
I
R
v1
v2
𝑣1 = β ∗ 𝑆 ∗ 𝐼 𝑣2 = γ ∗ 𝐼
𝑆′
= −𝑣1
𝐼′ = 𝑣1 − 𝑣2
𝑅′ = 𝑣2
𝑆 + 𝐼 + 𝑅 = 1
We don’t consider patient death in this basic model
Interpreting parameters
β is the mixing rate of the population (depends on awareness/laws)
γ is the rate of recovery (depends on medical facilities and medicines)
R0 for COVID-19 seems to between 3 and 4 (on average 3.5 people are infected by an
infected individual)
ρ for COVID-19 seems to be close to 0.7 (70% of the population should be
infected/vaccinated before herd immunity)
Simulation – limited healthcare
resources
• Every country has a limited healthcare resource
• Number of COVID-19 infected cases should be
within this limit for effective treatment
• We assume that a country can accommodate up
to 70% of its population at any time in the
hospital (blue line)
• Maximum number of cases is less than
healthcare resources
Number of beds/other facilities in hospitals
Simulation – lockdown effect
• When a lockdown is practiced it reduces the
mixing of population and lowers the value of β
• This reduces the number of infections well
within limits to handle it
Simulation – Koyambedu market
incident
• The Koyambedu market incident might have
caused a spike in number of infections by
increasing the value of β
Simulation – liquor stores opening effect
• Opening liquor stores can greatly increase the
value of β and result in higher infections
Simulation – Overview
• More mixing in the population is bad for an
epidemic
• Physical isolation can reduce the maximum
infection count
• A lower infection count can help the healthcare
to fight COVID-19 better
Parameter estimation from real data
For our model we used hypothetical values for parameters
In the real world model parameters are estimated using observed data
The aim is to match the predicted and observed data points as close as possible
Modifications of SIR model
Detailed models can predict real-life situations better
Special cases for vector-based endemic diseases
Different approach for population heterogeneity
Different approach for age-based vulnerability
SIR model with doctors/nurses/cleaners
H is a new compartment including
doctors/nurses/cleaners and all other staff who work in
the frontline of treating COVID-19
H has two roles in treating an epidemic:
1. H can treat patients and cure the disease
2. If not protected with PPE, H can also become a
patient
S
I
R
H 1
2
SIR model with doctors/nurses/cleaners
S
I
R
H
v1
v2
v3
v4
𝑣1 = β ∗ 𝑆 ∗ 𝐼
𝑣2 = γ1 ∗ 𝐼
𝑣3 = (1 − 𝑃𝑃𝐸) ∗ 𝐻 ∗ 𝐼
𝑣4 = (γ2 ∗ 𝑉𝑒𝑛𝑡) ∗ 𝐻 ∗ 𝐼
𝑆′ = −𝑣1
𝐼′ = 𝑣1 − 𝑣2 +𝑣3 − 𝑣4
𝑅′
= 𝑣2 + 𝑣4
𝑆 + 𝐼 + 𝑅 + 𝐻 = 1
𝐻′
= −𝑣3
SIR model with doctors/nurses/cleaners
‘H’ (green) decreases in the model because healthcare workers are infected due
to the lack of PPE
S
I
R
H
Interpreting parameters
β : population mixing rate
γ1 : natural recovery rate
PPE : PPE fraction available
(1-PPE) : contact rate of healthcare workers with patients
γ2 : recovery rate with treatment
Vent : ventilator/other equipment fraction available
Model parameters – poor management
Inadequate PPE supplies
Low PPE value in model
Insufficient ventilators and other medical equipment
Low Vent value in model
Model simulation – counter productive
Poor management of healthcare can result in a counter-productive outcome
Model simulation – counter productive
Poor management of healthcare can result in a counter-productive outcome
SIR model with doctors/nurses/cleaners
Interested audience can read more about this model creation and simulation in my
blog (links below).
1. https://medium.com/modelling-covid19-pandemic/role-of-healthcare-workers-in-
the-sir-epidemiological-model-
6e1ec046797d?source=friends_link&sk=a07c1bf6c830e17151fc97392d3c8982
2. https://medium.com/modelling-covid19-pandemic/a-surge-of-healthcare-workers-
can-be-bad-news-for-covid19-pandemic-
81ca3328eff2?source=friends_link&sk=5a619f9894f00950caa2596d523c6ef9
Take home messages
SIR model is a simple model that can give valuable insights into the spread of an
epidemic
Every epidemic is different and the model has to be modified to simulate real world
cases
Reducing the mixing rate of population and providing adequate healthcare support
seems to be the way to handle COVID-19 pandemic
Other DIY modelling
How will variable immunity impact COVID-19 spread?
How will opening public transport affect the disease spread?
How will migrant workers change the spread?

COVID-19 SIR model overview

  • 1.
    Mathematically modelling the spreadof COVID-19 Thawfeek Mohamed Varusai Scientific Data Analyst, EMBL-EBI, Cambridge, UK
  • 2.
    History of modellingepidemics Started as early as the 15th century. First prominent modelling effort was done in the 16th century by Daniel Bernoulli to understand small pox vaccination Other early efforts include the spatial and temporal study of cholera spread in London by John Snow in the mid 17th century
  • 3.
    Compartmental modelling Most commonlyused approach in epidemiology. In the early 20th century it was believed that so long as mosquitoes were present in a population malaria cannot be eliminated. Dr Ross won the Nobel prize in 1902 for proving that malaria can be overcome by merely reducing the mosquitoes population below a critical level. He used a compartmental modelling approach to study the spread of malaria to estimate precise numbers. The concept of ‘basic reproduction number’ (R0) was born here.
  • 4.
    Stochastic modelling Used whenthere is incomplete mixing in a population –small population or people with restriction contacts In the initial phase of the epidemic, there are very few infected individuals who have limited contacts Under these circumstances, stochastic modelling is used to predict the spread
  • 5.
    SIR model Susceptible (S) Infectious (I) Recovered (R) Originally developedby Kermack and McKendrik β γ β is the mixing rate of the population γ is the rate of recovery
  • 6.
    SIR model S I R v1 v2 𝑆′ = −𝑣1 𝐼′= 𝑣1 − 𝑣2 𝑅′ = 𝑣2 Rate of change of S over time Rate of change of I over time Rate of change of R over time 𝑆 + 𝐼 + 𝑅 = 1Sum of all compartments is 1 𝑣1 = β ∗ 𝑆 ∗ 𝐼 𝑣2 = γ ∗ 𝐼
  • 7.
    SIR model –assumptions Closed system: ignoring birth/death or immigration, etc. Reinfection is not considered All individuals in the population have the same chances of getting infected The population is considered to be well mixed
  • 8.
    Simulation Arbitrary parameter valuesused Number of susceptible decrease with time Number of recovered increase with time Number of infections initially increase and then decrease Susceptible Recovered Infected TimeNumberofcases
  • 9.
    SIR model –R0 𝐼′ = 𝑣1 − 𝑣2 Basic reproductive number (R0) is defined as the average number of people infected by an infected individual = β ∗ 𝑆 ∗ 𝐼 − γ ∗ 𝐼 = (β ∗ 𝑆 − γ) ∗ 𝐼 When everyone in the population is susceptible: S = 1 (since I and R are 0 in S + I + R = 1) = (β − γ) ∗ 𝐼𝐼′ = 𝑣1 − 𝑣2
  • 10.
    SIR model –R0 = (β − γ) ∗ 𝐼𝐼′ = 𝑣1 − 𝑣2 For I’ to increase the right hand side must be positive: β − γ > 0 β > γ β γ > 1 𝑅0 > 1 For I’ to decrease the right hand side must be negative: β − γ < 0 β < γ β γ < 1 𝑅0 < 1 A disease will not spread if R0<1 and an epidemic will occur if R0>1 Rate of change of infections 𝑹 𝟎 = 𝜷 𝜸 For measles: R0 is about 16 For COVID-19: R0 is estimated to be around 3.5
  • 11.
    Vaccination overview Vaccination teachesthe immune system to fight the germ (bacteria or virus) Types Live-attenuated Inactivated Subunit Toxoid Approach weakened/modified form of germ dead form of germ specific pieces of germ toxin produced by germ Immunity type long-lasting short-term strong response specific response Examples measles, smallpox, chickenpox flu, polio, rabies pneumonia, meningitis, hepatitis B diphtheria, tetanus
  • 12.
    Herd immunity Vaccination createsa direct path from susceptible to recovered group without passing through infection How many susceptible individuals should get the disease/be vaccinated to achieve herd immunity? S I Rvaccination Herd immunity: when almost everyone has had the disease some individuals are protected from it
  • 13.
    SIR model –herd immunity (β ∗ 𝑆 − γ) ∗ 𝐼𝐼′ =Rate of change of infections For infection to stop spreading: 𝐼′ = 0 β ∗ 𝑆 − γ = 0 since S + I + R = 1β ∗ (1 − (𝐼 + 𝑅)) − γ = 0 let (I + R) = ρβ ∗ (1 − ρ) − γ = 0 rearrangingρ = 1 − γ β since 𝑅0 = β γρ = 𝟏 − 𝟏 𝑹 𝟎 Population that needs to be immune For measles: ρ is close to 0.95 For COVID-19: ρ is estimated to be close to 0.70
  • 14.
    SARS-CoV2 COVID-19 is adisease spread by a virus in the beta family of corona viruses There have been other epidemics with the same family of virus before this – SARS in 2002, MERS in 2013 and now its COVID-19 COVID-19 virus is very similar to the SARS virus from 2002 and is also known as SARS- CoV2 The primary infection site is the respiratory system through which the virus can enter host cells and later spread to other organs
  • 15.
    SIR model ofSARS-CoV2 S I R v1 v2 𝑣1 = β ∗ 𝑆 ∗ 𝐼 𝑣2 = γ ∗ 𝐼 𝑆′ = −𝑣1 𝐼′ = 𝑣1 − 𝑣2 𝑅′ = 𝑣2 𝑆 + 𝐼 + 𝑅 = 1 We don’t consider patient death in this basic model
  • 16.
    Interpreting parameters β isthe mixing rate of the population (depends on awareness/laws) γ is the rate of recovery (depends on medical facilities and medicines) R0 for COVID-19 seems to between 3 and 4 (on average 3.5 people are infected by an infected individual) ρ for COVID-19 seems to be close to 0.7 (70% of the population should be infected/vaccinated before herd immunity)
  • 17.
    Simulation – limitedhealthcare resources • Every country has a limited healthcare resource • Number of COVID-19 infected cases should be within this limit for effective treatment • We assume that a country can accommodate up to 70% of its population at any time in the hospital (blue line) • Maximum number of cases is less than healthcare resources Number of beds/other facilities in hospitals
  • 18.
    Simulation – lockdowneffect • When a lockdown is practiced it reduces the mixing of population and lowers the value of β • This reduces the number of infections well within limits to handle it
  • 19.
    Simulation – Koyambedumarket incident • The Koyambedu market incident might have caused a spike in number of infections by increasing the value of β
  • 20.
    Simulation – liquorstores opening effect • Opening liquor stores can greatly increase the value of β and result in higher infections
  • 21.
    Simulation – Overview •More mixing in the population is bad for an epidemic • Physical isolation can reduce the maximum infection count • A lower infection count can help the healthcare to fight COVID-19 better
  • 22.
    Parameter estimation fromreal data For our model we used hypothetical values for parameters In the real world model parameters are estimated using observed data The aim is to match the predicted and observed data points as close as possible
  • 23.
    Modifications of SIRmodel Detailed models can predict real-life situations better Special cases for vector-based endemic diseases Different approach for population heterogeneity Different approach for age-based vulnerability
  • 24.
    SIR model withdoctors/nurses/cleaners H is a new compartment including doctors/nurses/cleaners and all other staff who work in the frontline of treating COVID-19 H has two roles in treating an epidemic: 1. H can treat patients and cure the disease 2. If not protected with PPE, H can also become a patient S I R H 1 2
  • 25.
    SIR model withdoctors/nurses/cleaners S I R H v1 v2 v3 v4 𝑣1 = β ∗ 𝑆 ∗ 𝐼 𝑣2 = γ1 ∗ 𝐼 𝑣3 = (1 − 𝑃𝑃𝐸) ∗ 𝐻 ∗ 𝐼 𝑣4 = (γ2 ∗ 𝑉𝑒𝑛𝑡) ∗ 𝐻 ∗ 𝐼 𝑆′ = −𝑣1 𝐼′ = 𝑣1 − 𝑣2 +𝑣3 − 𝑣4 𝑅′ = 𝑣2 + 𝑣4 𝑆 + 𝐼 + 𝑅 + 𝐻 = 1 𝐻′ = −𝑣3
  • 26.
    SIR model withdoctors/nurses/cleaners ‘H’ (green) decreases in the model because healthcare workers are infected due to the lack of PPE S I R H
  • 27.
    Interpreting parameters β :population mixing rate γ1 : natural recovery rate PPE : PPE fraction available (1-PPE) : contact rate of healthcare workers with patients γ2 : recovery rate with treatment Vent : ventilator/other equipment fraction available
  • 28.
    Model parameters –poor management Inadequate PPE supplies Low PPE value in model Insufficient ventilators and other medical equipment Low Vent value in model
  • 29.
    Model simulation –counter productive Poor management of healthcare can result in a counter-productive outcome
  • 30.
    Model simulation –counter productive Poor management of healthcare can result in a counter-productive outcome
  • 31.
    SIR model withdoctors/nurses/cleaners Interested audience can read more about this model creation and simulation in my blog (links below). 1. https://medium.com/modelling-covid19-pandemic/role-of-healthcare-workers-in- the-sir-epidemiological-model- 6e1ec046797d?source=friends_link&sk=a07c1bf6c830e17151fc97392d3c8982 2. https://medium.com/modelling-covid19-pandemic/a-surge-of-healthcare-workers- can-be-bad-news-for-covid19-pandemic- 81ca3328eff2?source=friends_link&sk=5a619f9894f00950caa2596d523c6ef9
  • 32.
    Take home messages SIRmodel is a simple model that can give valuable insights into the spread of an epidemic Every epidemic is different and the model has to be modified to simulate real world cases Reducing the mixing rate of population and providing adequate healthcare support seems to be the way to handle COVID-19 pandemic
  • 33.
    Other DIY modelling Howwill variable immunity impact COVID-19 spread? How will opening public transport affect the disease spread? How will migrant workers change the spread?