Download as PDF, PPTX


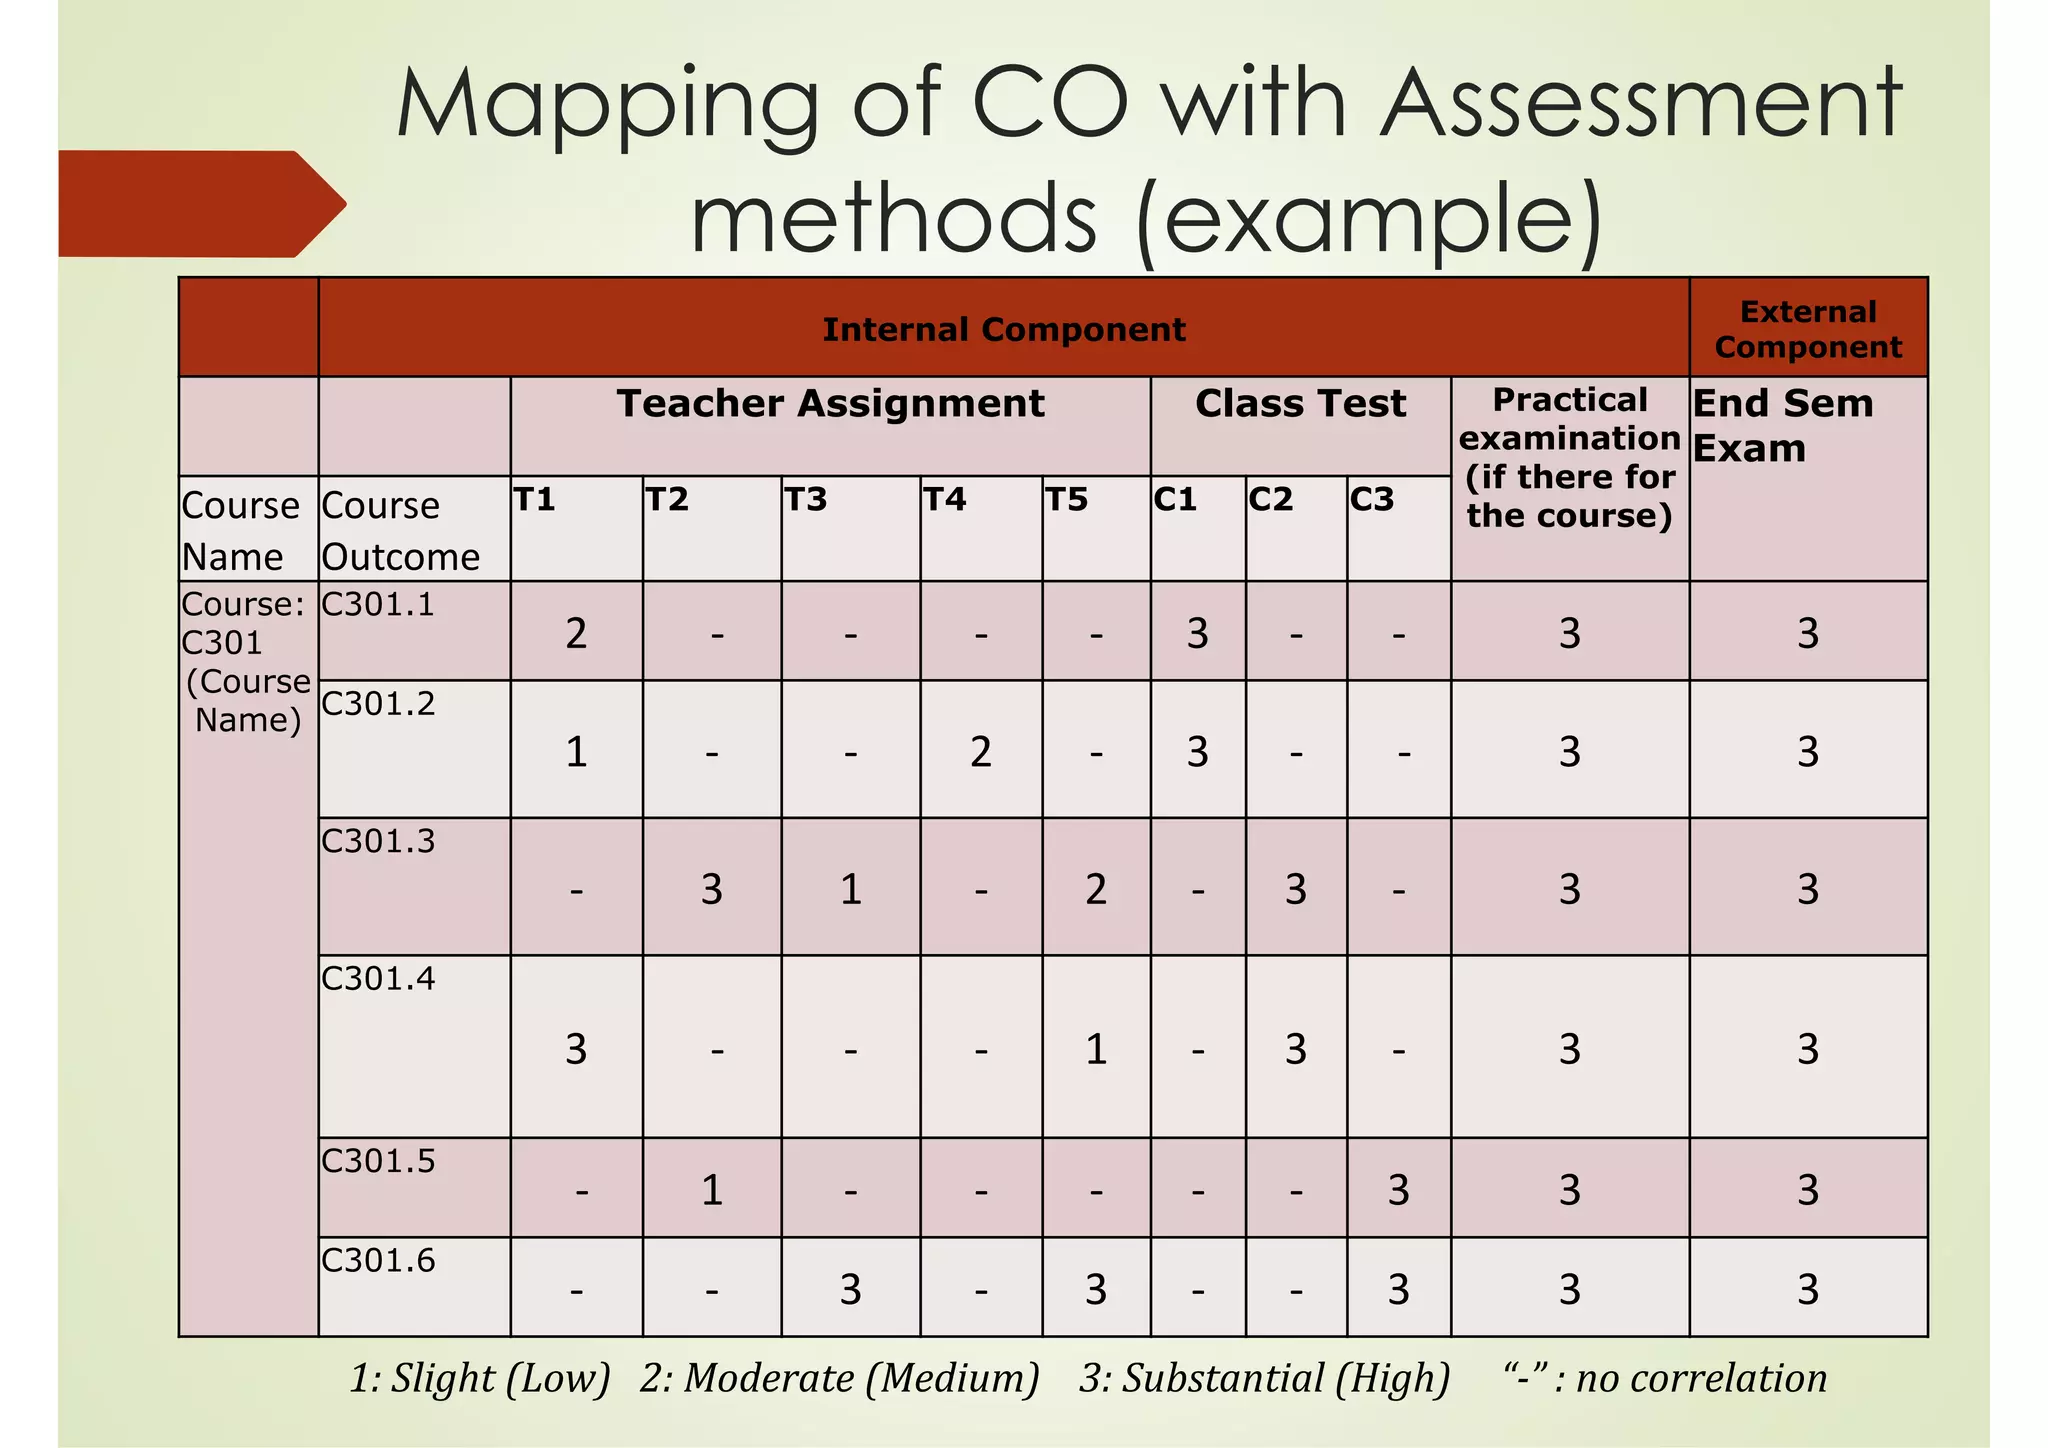


![Course Outcome Calculation
For calculation purpose ‘-’ is replaced by ‘0’
Teacher Assignment Class Test
Practi
cal [*int]
Attainme
nt Level
(Internal)
End
Sem
Exam
[*ext]
Attainme
nt Level
(External
)
Overall
Attain
ment
Course
Name
Course
Outco
me
T1 T2 T3 T4 T5 C1 C2 C3 Pr
Levels LL HH HH LL HH LL HH MM HH LL
Level Point
1 3 3 1 3 1 3 2 3 1
int*0.
4+
ext*0.
6
Course:
C301
C301.1
2 0 0 0 0 3 0 0 3 *1.75 3 1 1.30
(Cours
e
Name)
C301.2 1 0 0 2 0 3 0 0 3 1.67 3 1 1.27
C301.3 0 3 1 0 2 0 3 0 3 2.67 3 1 1.67
C301.4 3 0 0 0 1 0 3 0 3 2.20 3 1 1.48
C301.5 0 1 0 0 0 0 0 3 3 2.57 3 1 1.63
C301.6 0 0 3 0 3 0 0 3 3 2.25 3 1 1.50
*Calculation explained in next slide](https://image.slidesharecdn.com/nbaco-pocalculationnew-170525182134/75/Course-Outcome-and-Program-Outcome-Calculation-new-method-14-2048.jpg)
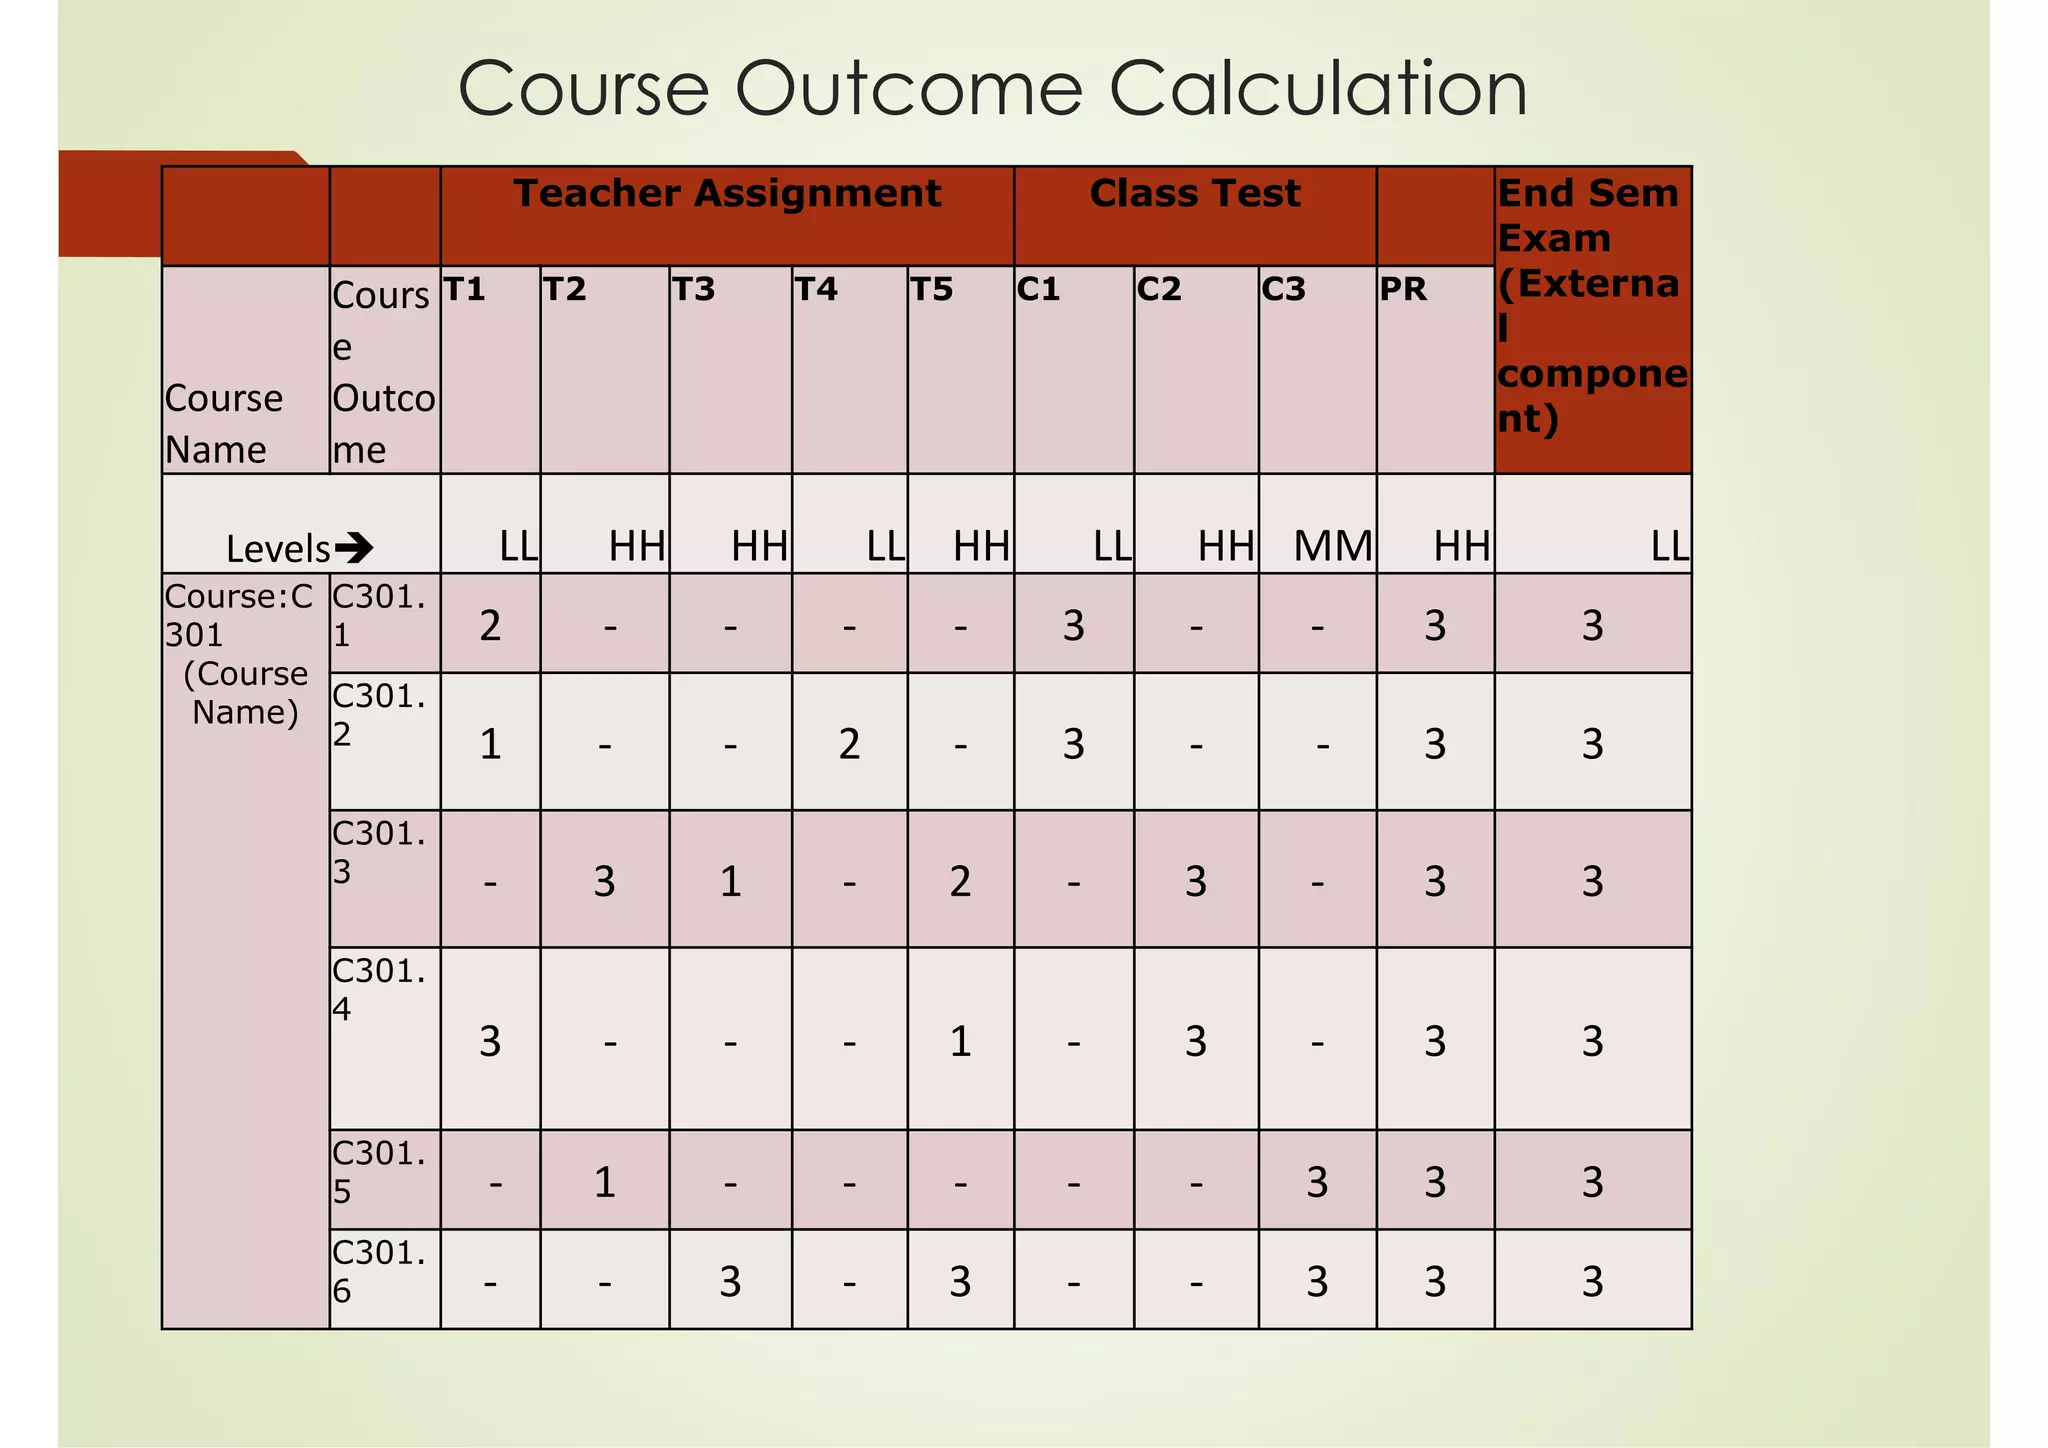
![Course Outcome
Calculation Explained
Teacher Assignment Class Test
Practi
cal [*int]
Attainme
nt Level
(Internal)
End
Sem
Exam
[*ext]
Attainme
nt Level
(External
)
Overall
Attain
ment
Course
Name
Course
Outco
me
T1 T2 T3 T4 T5 C1 C2 C3 Pr
Levels LL HH HH LL HH LL HH MM HH LL
Level Point
1 3 3 1 3 1 3 2 3 1
int*0.
4+
ext*0.
6
Course:
C301
C301.1
2 0 0 0 0 3 0 0 3 1.75 3 1 1.30
Attainment Level(internal)= Σ (Mapping factor*Level Points)/ Σ Mapping factor
= (2*1+0*3+0*3+0*1+ 0*3+3*1+0*3+0*2+3*3)/ (2+3+3)
=1.75
Attainment Level (external)= (3*1)/3=1
Overall Attainment CO1(C301.1) (considering 40% contribution from internal assessment
and 60% from external assessment) = 1.75*0.4+1*0.6= 1.30](https://image.slidesharecdn.com/nbaco-pocalculationnew-170525182134/75/Course-Outcome-and-Program-Outcome-Calculation-new-method-15-2048.jpg)


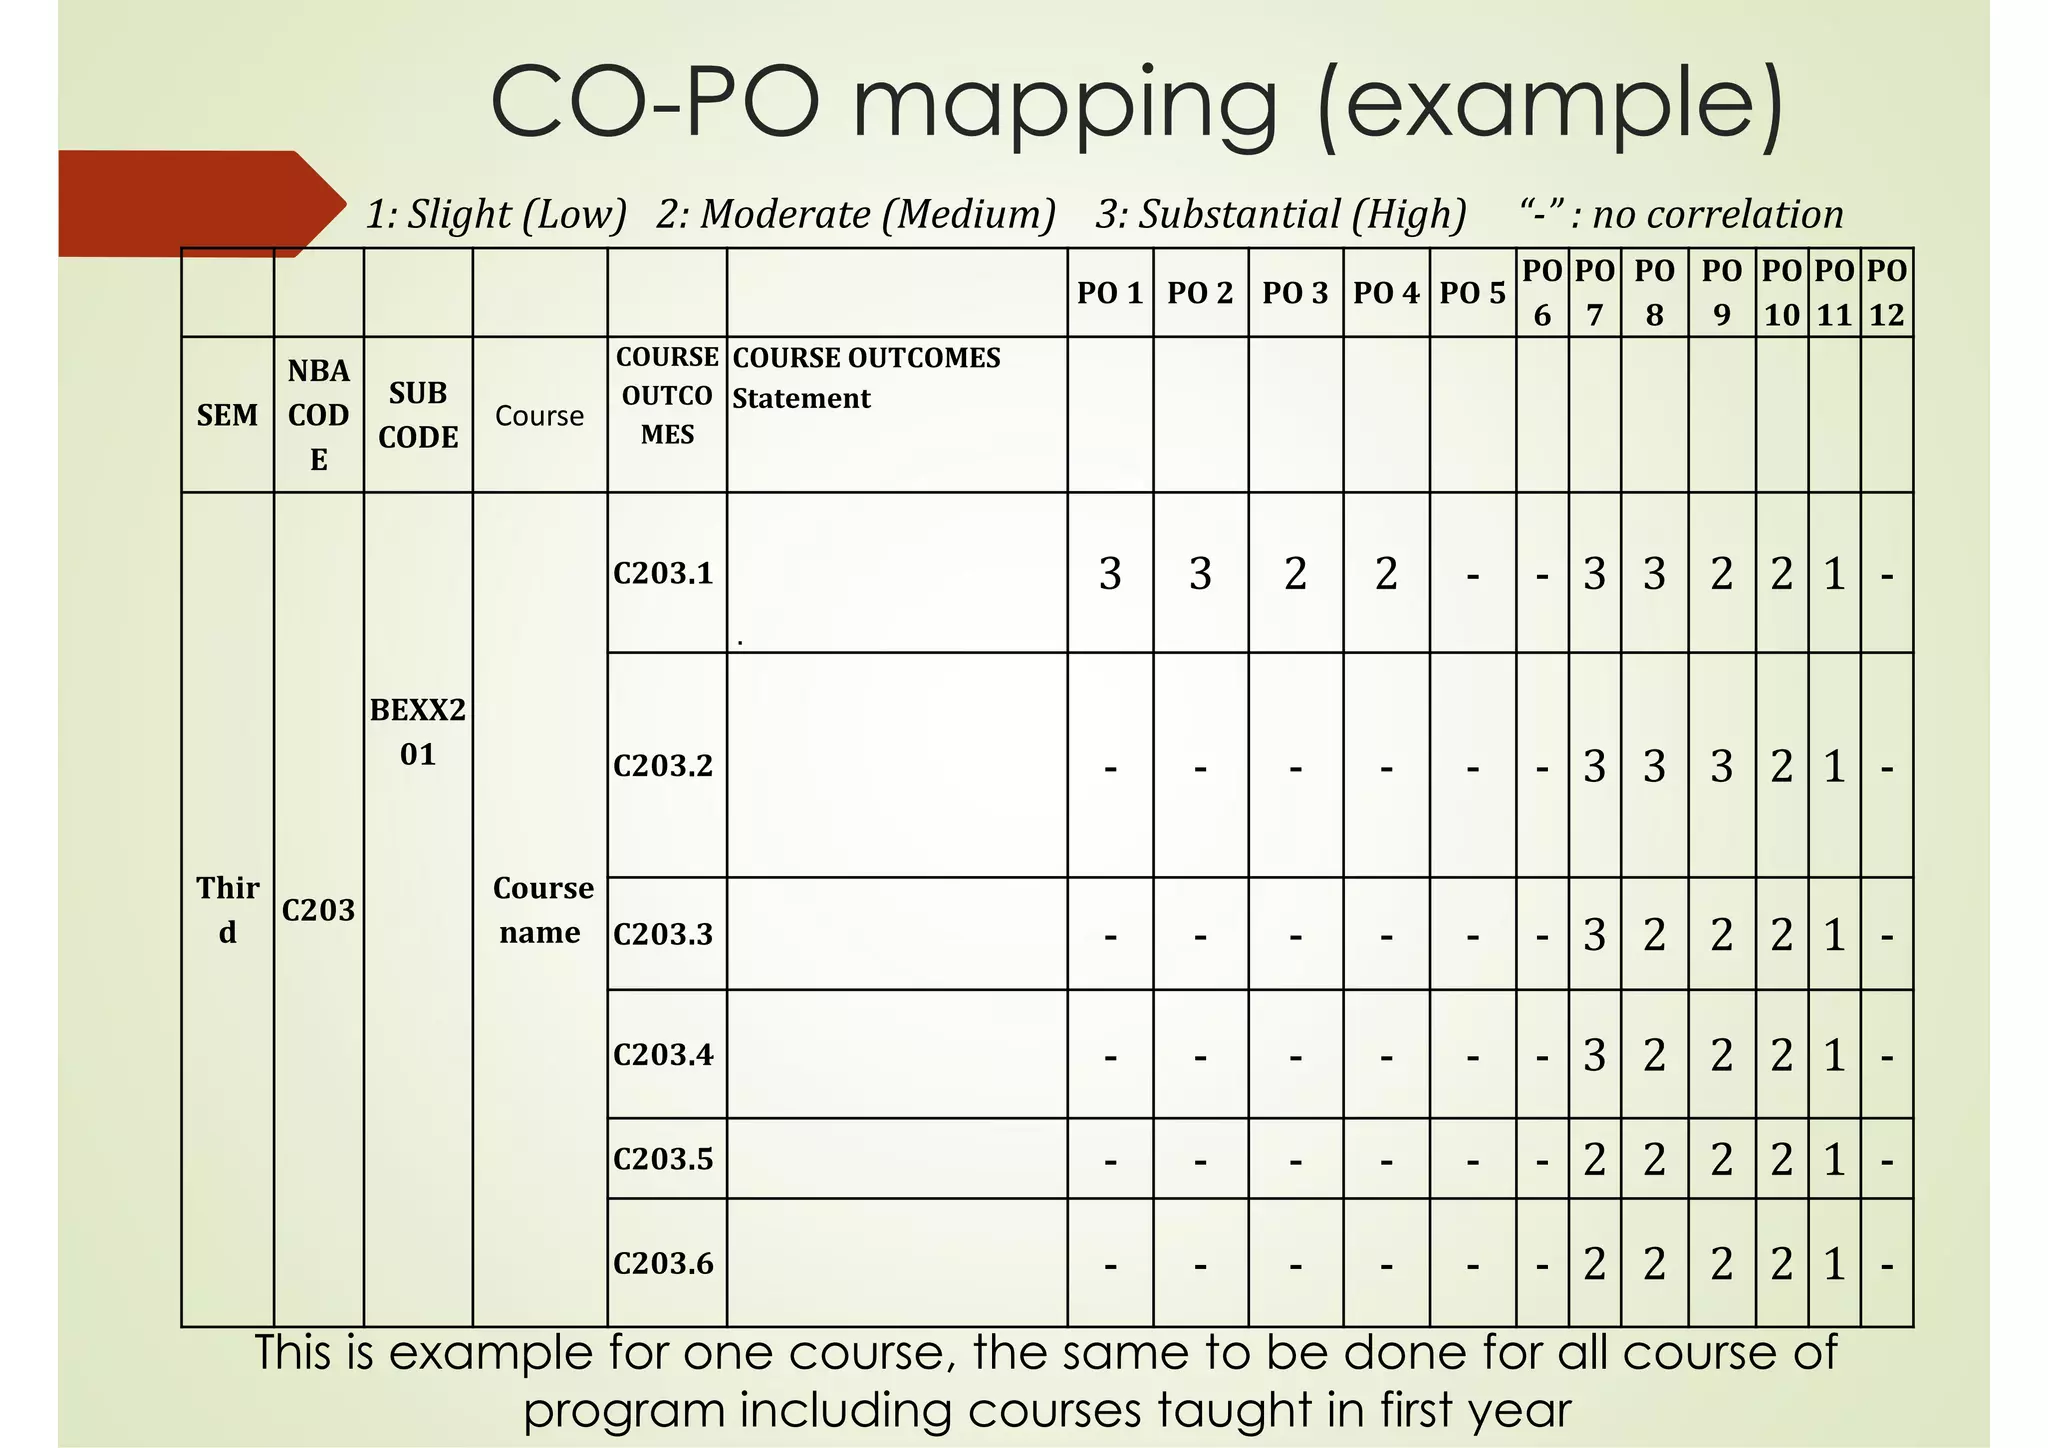
![Program Articulation Matrix with Program
Outcomes & PSO (to be done for all
courses) [3.1 point in NBA SAR]
Course
PO1
PO2
PO3
PO4
PO5
PO6
PO7
PO8
PO9
PO10
PO11
PO12
PSO1
PSO2
PSO3
C101
3 3 - - - - - - - - - 2 - - -
C102
3 - - - - - - - - - - - - - -
C103
3 3 - - - - - - - - - - - - -
C104
3 3 - - - - - - - - - - - - -
C105
3 3 3 - - - - - - - - - - - -
C107
3 3 - - - - - - - - - 3 - - -
C108](https://image.slidesharecdn.com/nbaco-pocalculationnew-170525182134/75/Course-Outcome-and-Program-Outcome-Calculation-new-method-21-2048.jpg)
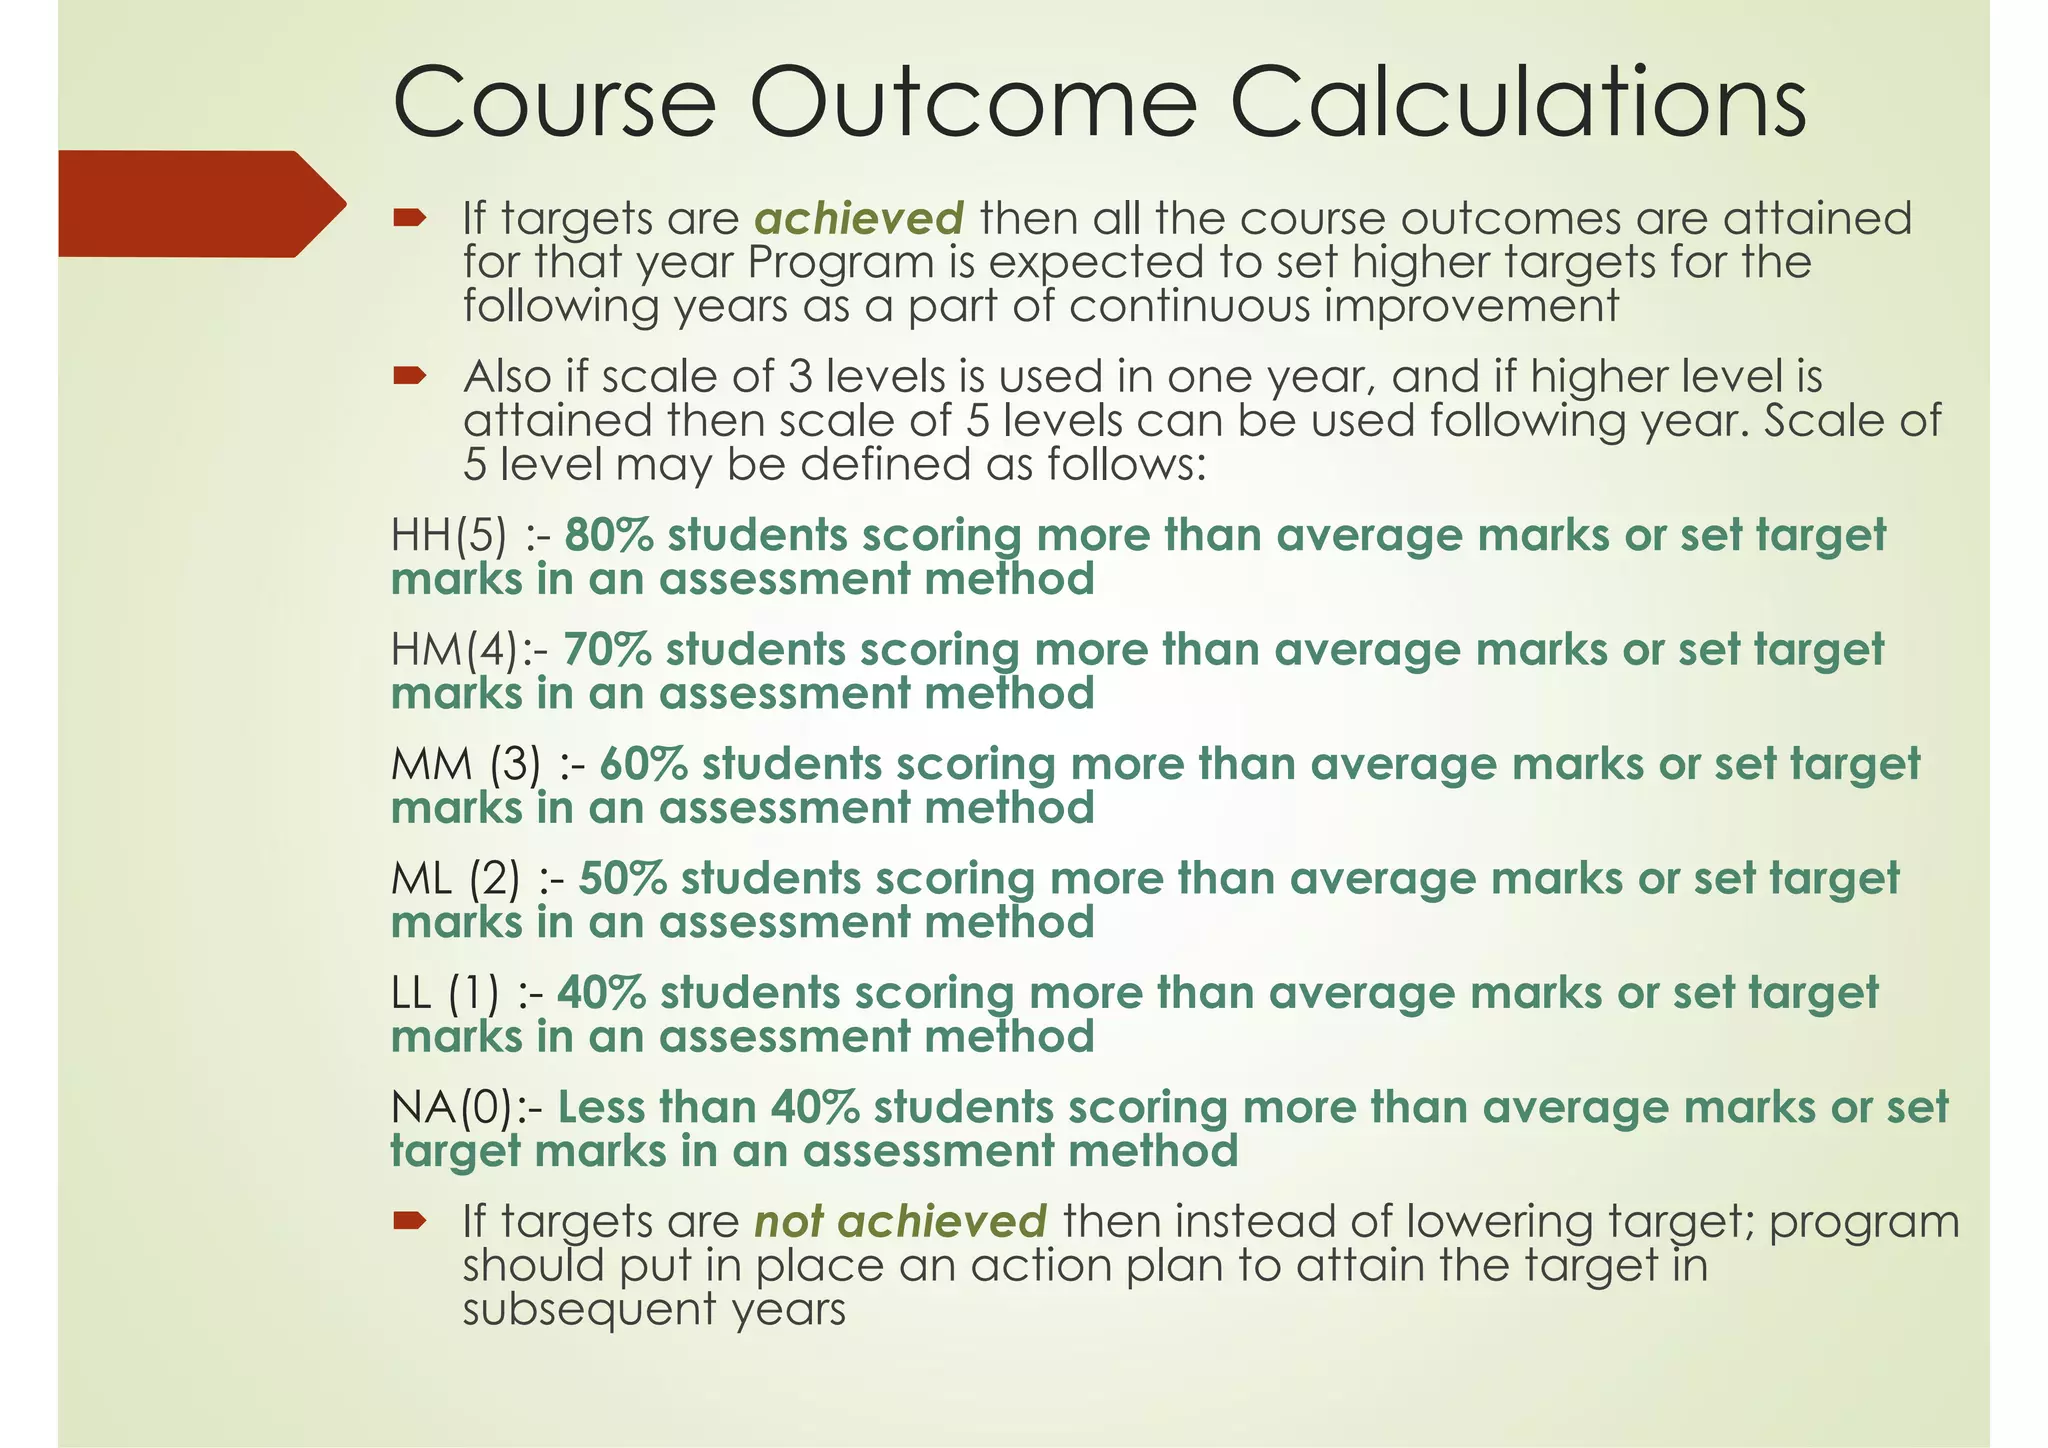
![Course Articulation Matrix [to be
done for all courses of program]
Course
COURSE OUTCOMES [Statement]
PO1
PO2
PO3
PO4
PO5
PO6
PO7
PO8
PO9
PO10
PO11
PO12
PSO1
PSO2
PSO3
C301
C301.1 1 1 3 2 2 - - - 1 - - - 2 2 1
C301.2 1 1 3 2 3 - - - 1 - - - 2 2 1
C301.3 1 1 3 3 3 - - - 1 - - - 3 3 1
C301.4 1 1 3 3 3 - - - 1 - - - 3 3 1
C301.5 1 2 3 3 3 - - - 1 - - 1 3 3 1
C301.6 1 2 3 3 3 - - - 1 - - 1 3 3 1](https://image.slidesharecdn.com/nbaco-pocalculationnew-170525182134/75/Course-Outcome-and-Program-Outcome-Calculation-new-method-22-2048.jpg)
![Program Outcome
Calculation
For Calculation of Program Outcome, we can use two method:
(i)Direct Method (ii)Indirect Method
Direct Method: In direct method, we take CO attainment of all
courses contributing to particular Program Outcomes and then
calculate the attainment based on mapping (as per course
articulation matrix)
Indirect Method: In indirect method, surveys from current passing out
students (program exit survey), survey from employer (during
placement), survey from industry person (if students are working as
intern for some industry) to be taken.
All this survey needs to be quantified [put questions like rate our students
in the scale of 5 (5-excellent, 1-not satisfactory)]
Indirect method too should be based on predefined levels
Example; Level-3: 80% or above survey takers giving 4 or 5 marks
Level-2: 70% or above survey takers giving 4 or 5 marks
Level-1: 60% or above survey takers giving 4 or 5 marks](https://image.slidesharecdn.com/nbaco-pocalculationnew-170525182134/75/Course-Outcome-and-Program-Outcome-Calculation-new-method-23-2048.jpg)
![Program Outcome Calculation
[Direct Method]
Co
urse
Course
Outco
mes
Attainmen
t Level
Column A
PO1
colum
n B
PO2 PO3 PO4 PO5 PO6 PO7 PO8 PO9 PO10 PO11 PO12 PSO1 PSO2 PSO3
C3
01
C301.1 1.5 1 1 3 2 2 1 - 1 1 - - - 2 2 1
C301.2 2.1 1 1 3 2 3 1 - - 1 - - - 2 2 1
C301.3 2.4 1 1 3 3 3 - - - 1 2 - - 3 3 1
C301.4 2.5 1 1 3 3 3 2 - - 1 - - - 3 3 1
C301.5 2.4 1 2 3 3 3 - - 1 1 - - 1 3 3 1
C301.6 2.7 1 2 3 3 3 2 - - 1 2 - 1 3 3 1
C3
02
C302.1 1.8 - - - - - - 1 - 2 1 3 - - - -
C302.2 1.9 - - - - - - 1 - 2 - 3 - - - -
C302.3 1.7 - - - - - - 1 - 2 - 3 - - - -
C302.4 2.7 - - - - - - 1 - 2 - 3 - - - -
C302.5 2.1 - - - - - - 1 - 2 - 3 - - - -
C302.6 1.4 - - - - - - 1 - 2 - 3 - - - -
Program
Outcome
Attainmen
t 2.27 2.34 2.27 2.33 2.31 2.33 1.93 1.95 2.04 2.40 1.93 2.55 2.33 2.33 2.27
Here only 2 course are taken but for actual calculations all courses needs to be taken
Calculation: PO1= (column A* Column B)/Sum(column B)
This can be easily done in excel](https://image.slidesharecdn.com/nbaco-pocalculationnew-170525182134/75/Course-Outcome-and-Program-Outcome-Calculation-new-method-24-2048.jpg)
![Program Outcome Calculation
[Indirect Method]
Attainment levels
Survey
Mappin
g ColA
PO1
ColB
PO2 PO3 PO4 PO5 PO6 PO7 PO8 PO9
PO1
0
PO1
1
PO1
2
PSO
1
PSO
2
PSO
3
Program
Exit
Survey 1 3 2 3 2 3 1 3 3 1 3 3 2 3 2 3
Employe
r Survey 2 2 3 1 2 2 2 2 2 2 2 2 3 1 2 2
External
Guide
Survey 2 2 3 3 3 3 2 3 3 2 3 2 3 3 3 3
Program
Outcome
Attainme
nt 2.2 2.8 2.2 2.4 2.6 1.8 2.6 2.6 1.8 2.6 2.2 2.8 2.2 2.4 2.6
Calculation: PO1= ColA*ColB/5](https://image.slidesharecdn.com/nbaco-pocalculationnew-170525182134/75/Course-Outcome-and-Program-Outcome-Calculation-new-method-25-2048.jpg)
![Program Outcome Attainment
[Indirect Method]
3
2
3
2
3
1
3 3
1
3 3
2
3
2
3
2
3
1
2 2 2 2 2 2 2 2
3
1
2 22
3 3 3 3
2
3 3
2
3
2
3 3 3 3
0
0.5
1
1.5
2
2.5
3
PO1 PO2 PO3 PO4 PO5 PO6 PO7 PO8 PO9 PO10 PO11 PO12 PSO1 PSO2 PSO3
Program Outcomes Attainment (Indirect Method)
Program Exit Survey Employer Survey External Guide Survey](https://image.slidesharecdn.com/nbaco-pocalculationnew-170525182134/75/Course-Outcome-and-Program-Outcome-Calculation-new-method-26-2048.jpg)
![Program Outcome
Calculation [Overall]
Method PO1 PO2 PO3 PO4 PO5 PO6 PO7 PO8 PO9 PO10 PO11 PO12 PSO1 PSO2 PSO3
Direct
Method 2.27 2.34 2.27 2.33 2.31 2.33 1.93 1.95 2.04 2.40 1.93 2.55 2.33 2.33 2.27
Indirect
Method 2.2 2.8 2.2 2.4 2.6 1.8 2.6 2.6 1.8 2.6 2.2 2.8 2.2 2.4 2.6
Overall
Attainm
ent
(Direct*
0.6+indi
rect*0.4
) 2.24 2.52 2.24 2.36 2.43 2.12 2.20 2.21 1.94 2.48 2.04 2.65 2.28 2.36 2.40
Here Direct method is considered to have 60% contribution
and indirect method as 40% contribution
Calculation: Overall Attainment= direct*0.6+indirect*0.4](https://image.slidesharecdn.com/nbaco-pocalculationnew-170525182134/75/Course-Outcome-and-Program-Outcome-Calculation-new-method-27-2048.jpg)


This document outlines a new method for calculating Course Outcomes (CO) and Program Outcomes (PO) for accreditation, focusing on mapping attainment levels between various assessments. Various definitions and mappings are provided, along with examples of setting targets and determining levels of attainment based on student performance. Additionally, it emphasizes the importance of continuous improvement in educational programs through the establishment of action plans when targets are not met.