Downloaded 122 times


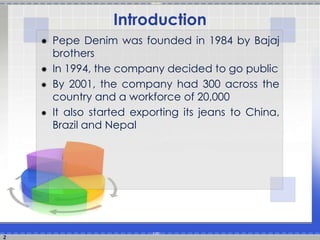

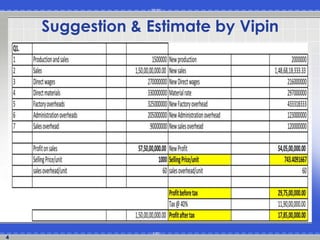


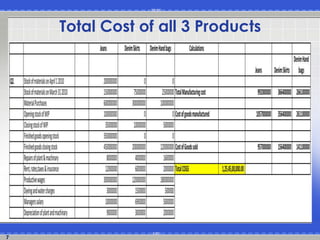

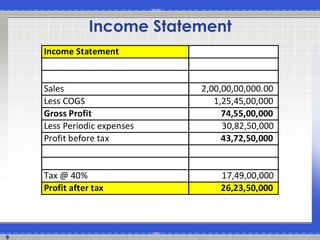
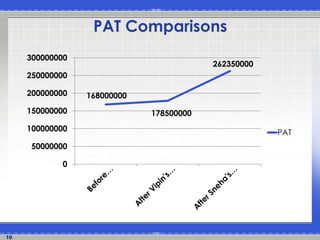


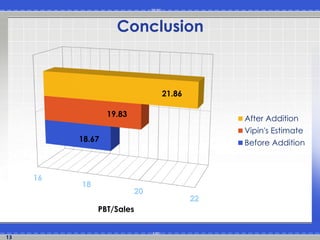


Pepe Denim was founded in 1984 and had grown to 300 stores and 20,000 employees by 2001. After 2007, the company's stock prices began declining even as sales remained consistent. To address declining profits due to competition, an employee, Sneha, suggested introducing denim skirts and handbags, which could be manufactured using the same materials and workers as jeans. Analysis showed the new product lines would increase costs by 32% but profits by 32%, with net profit ratios improving from 18.67% to 21.86%, indicating the new products would benefit the company.


