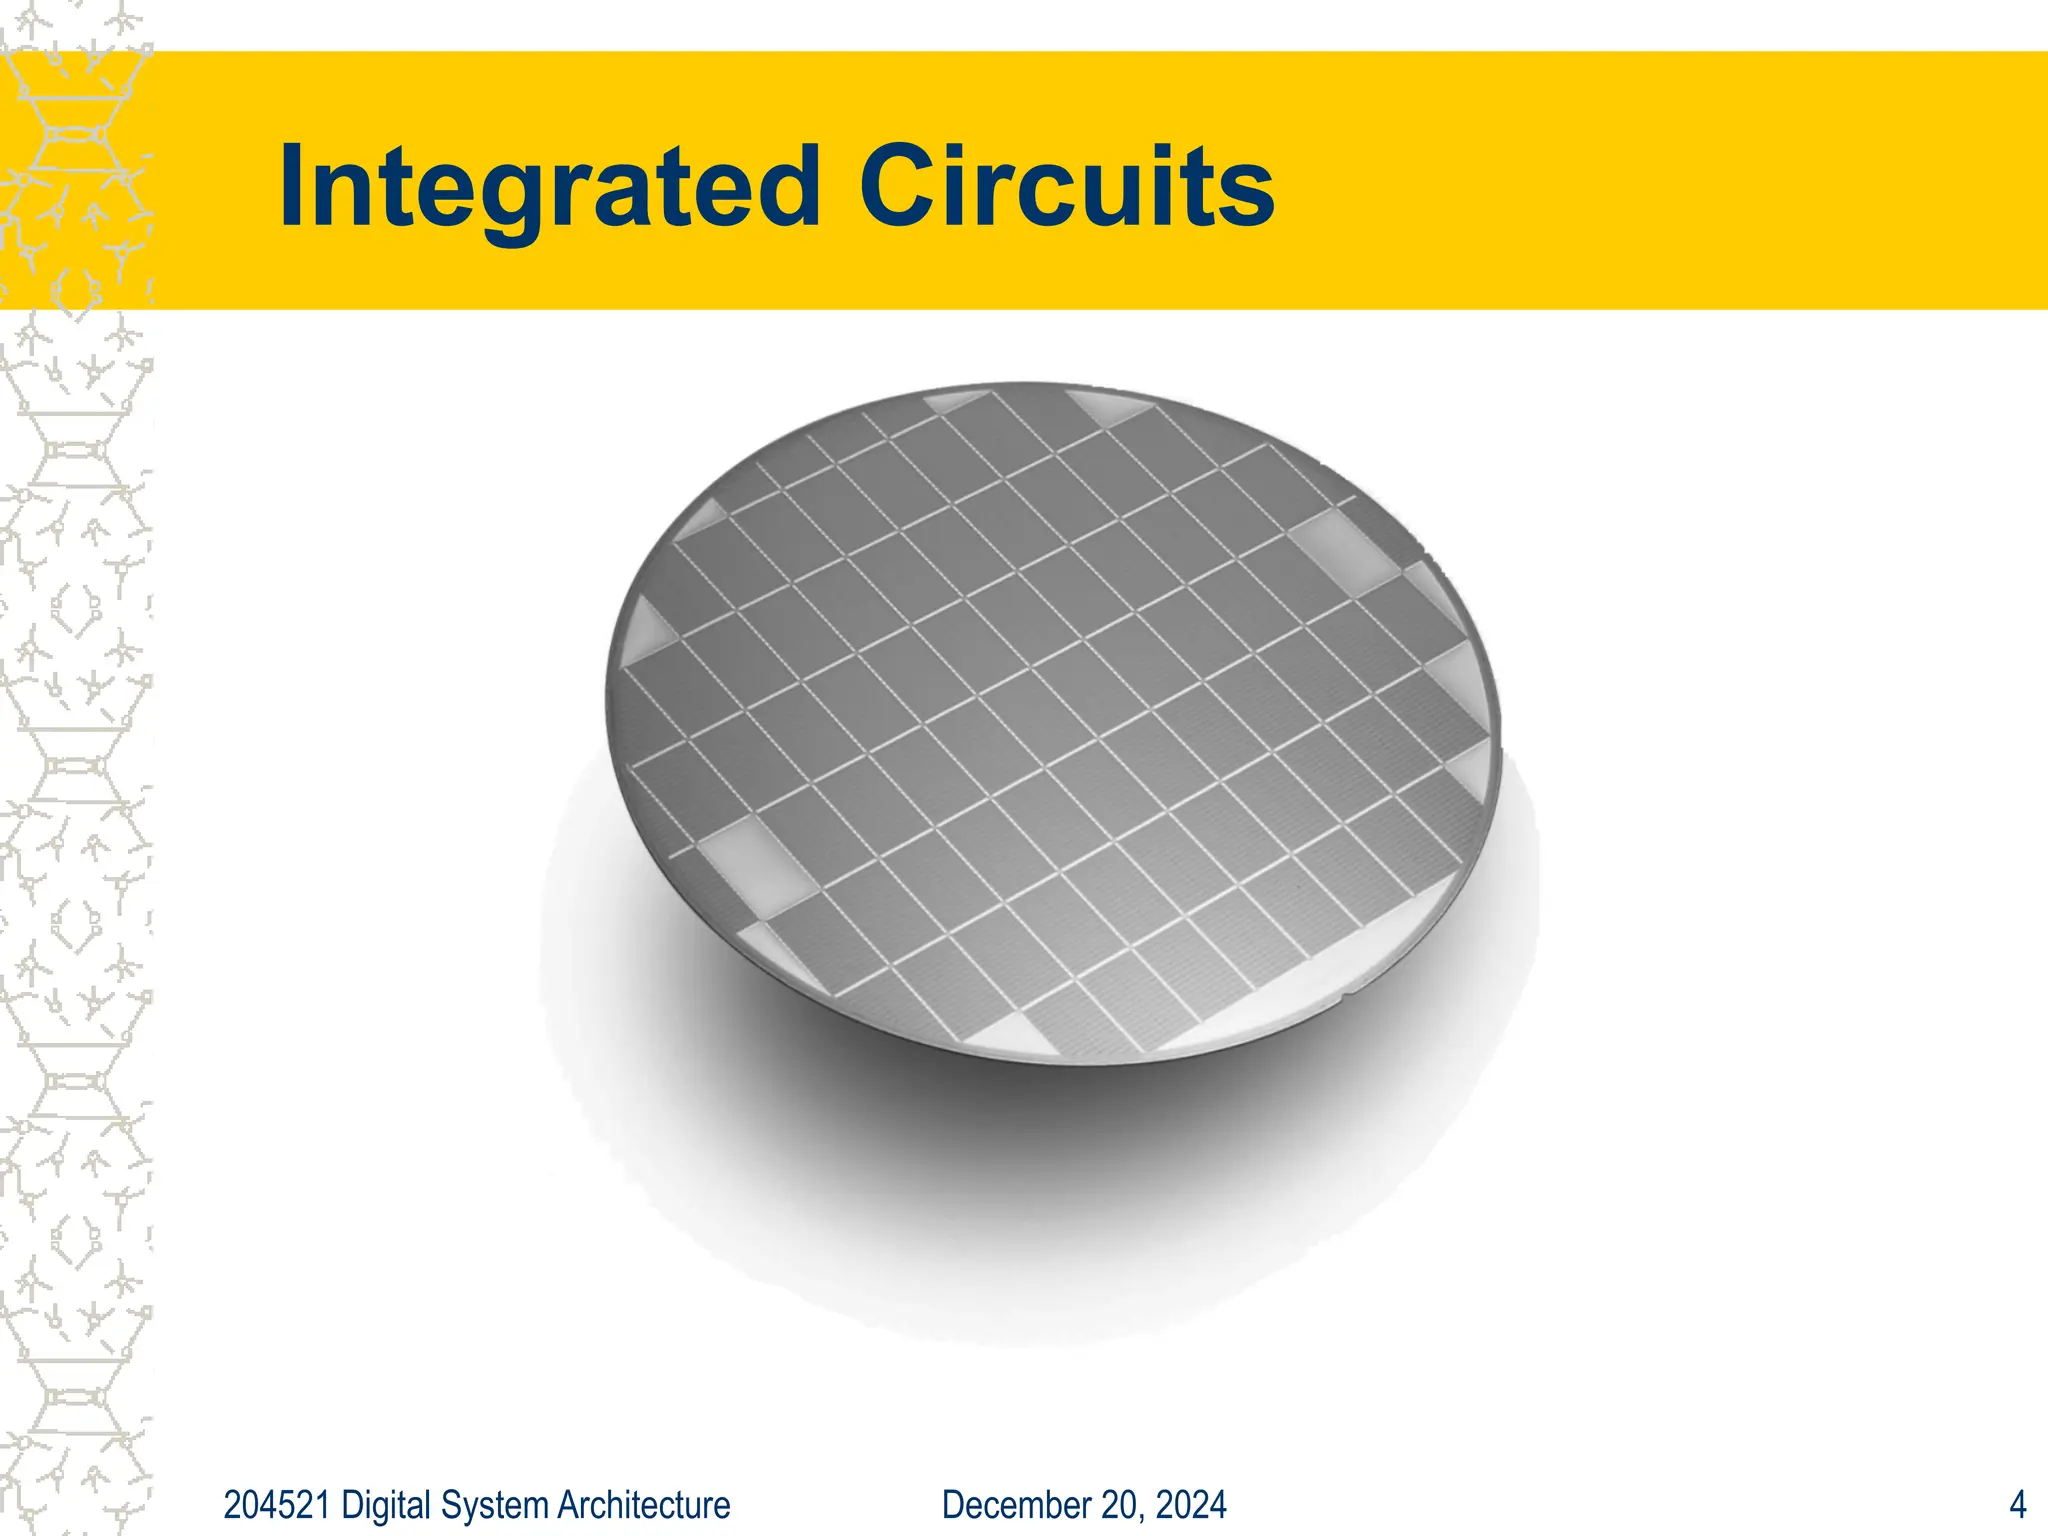
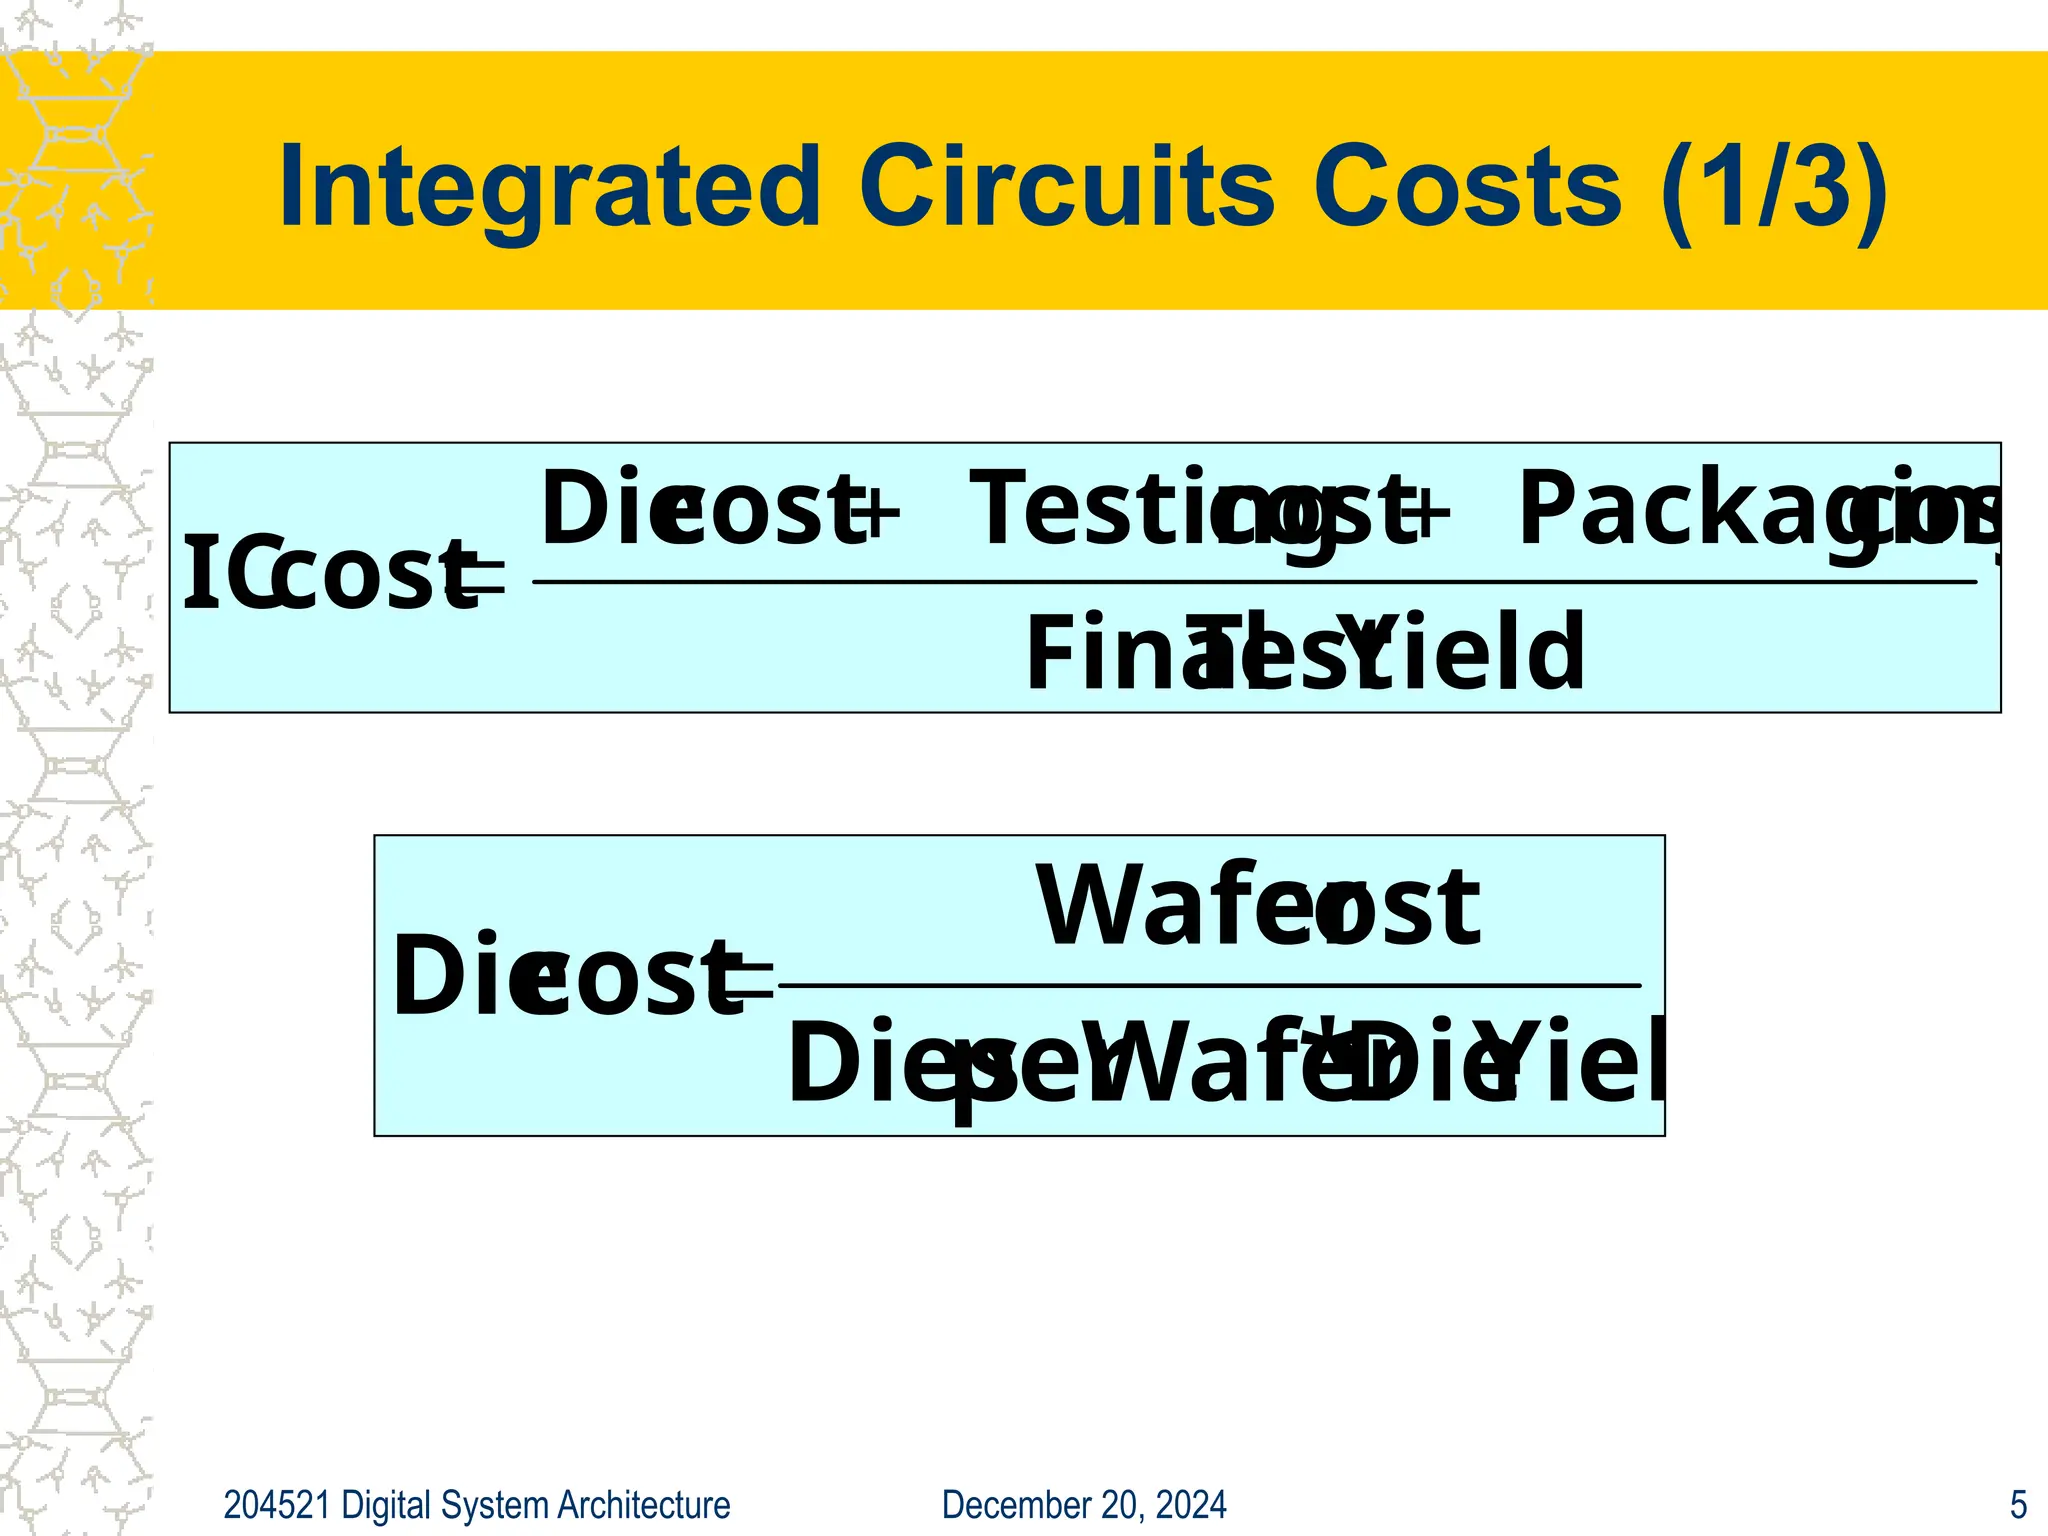
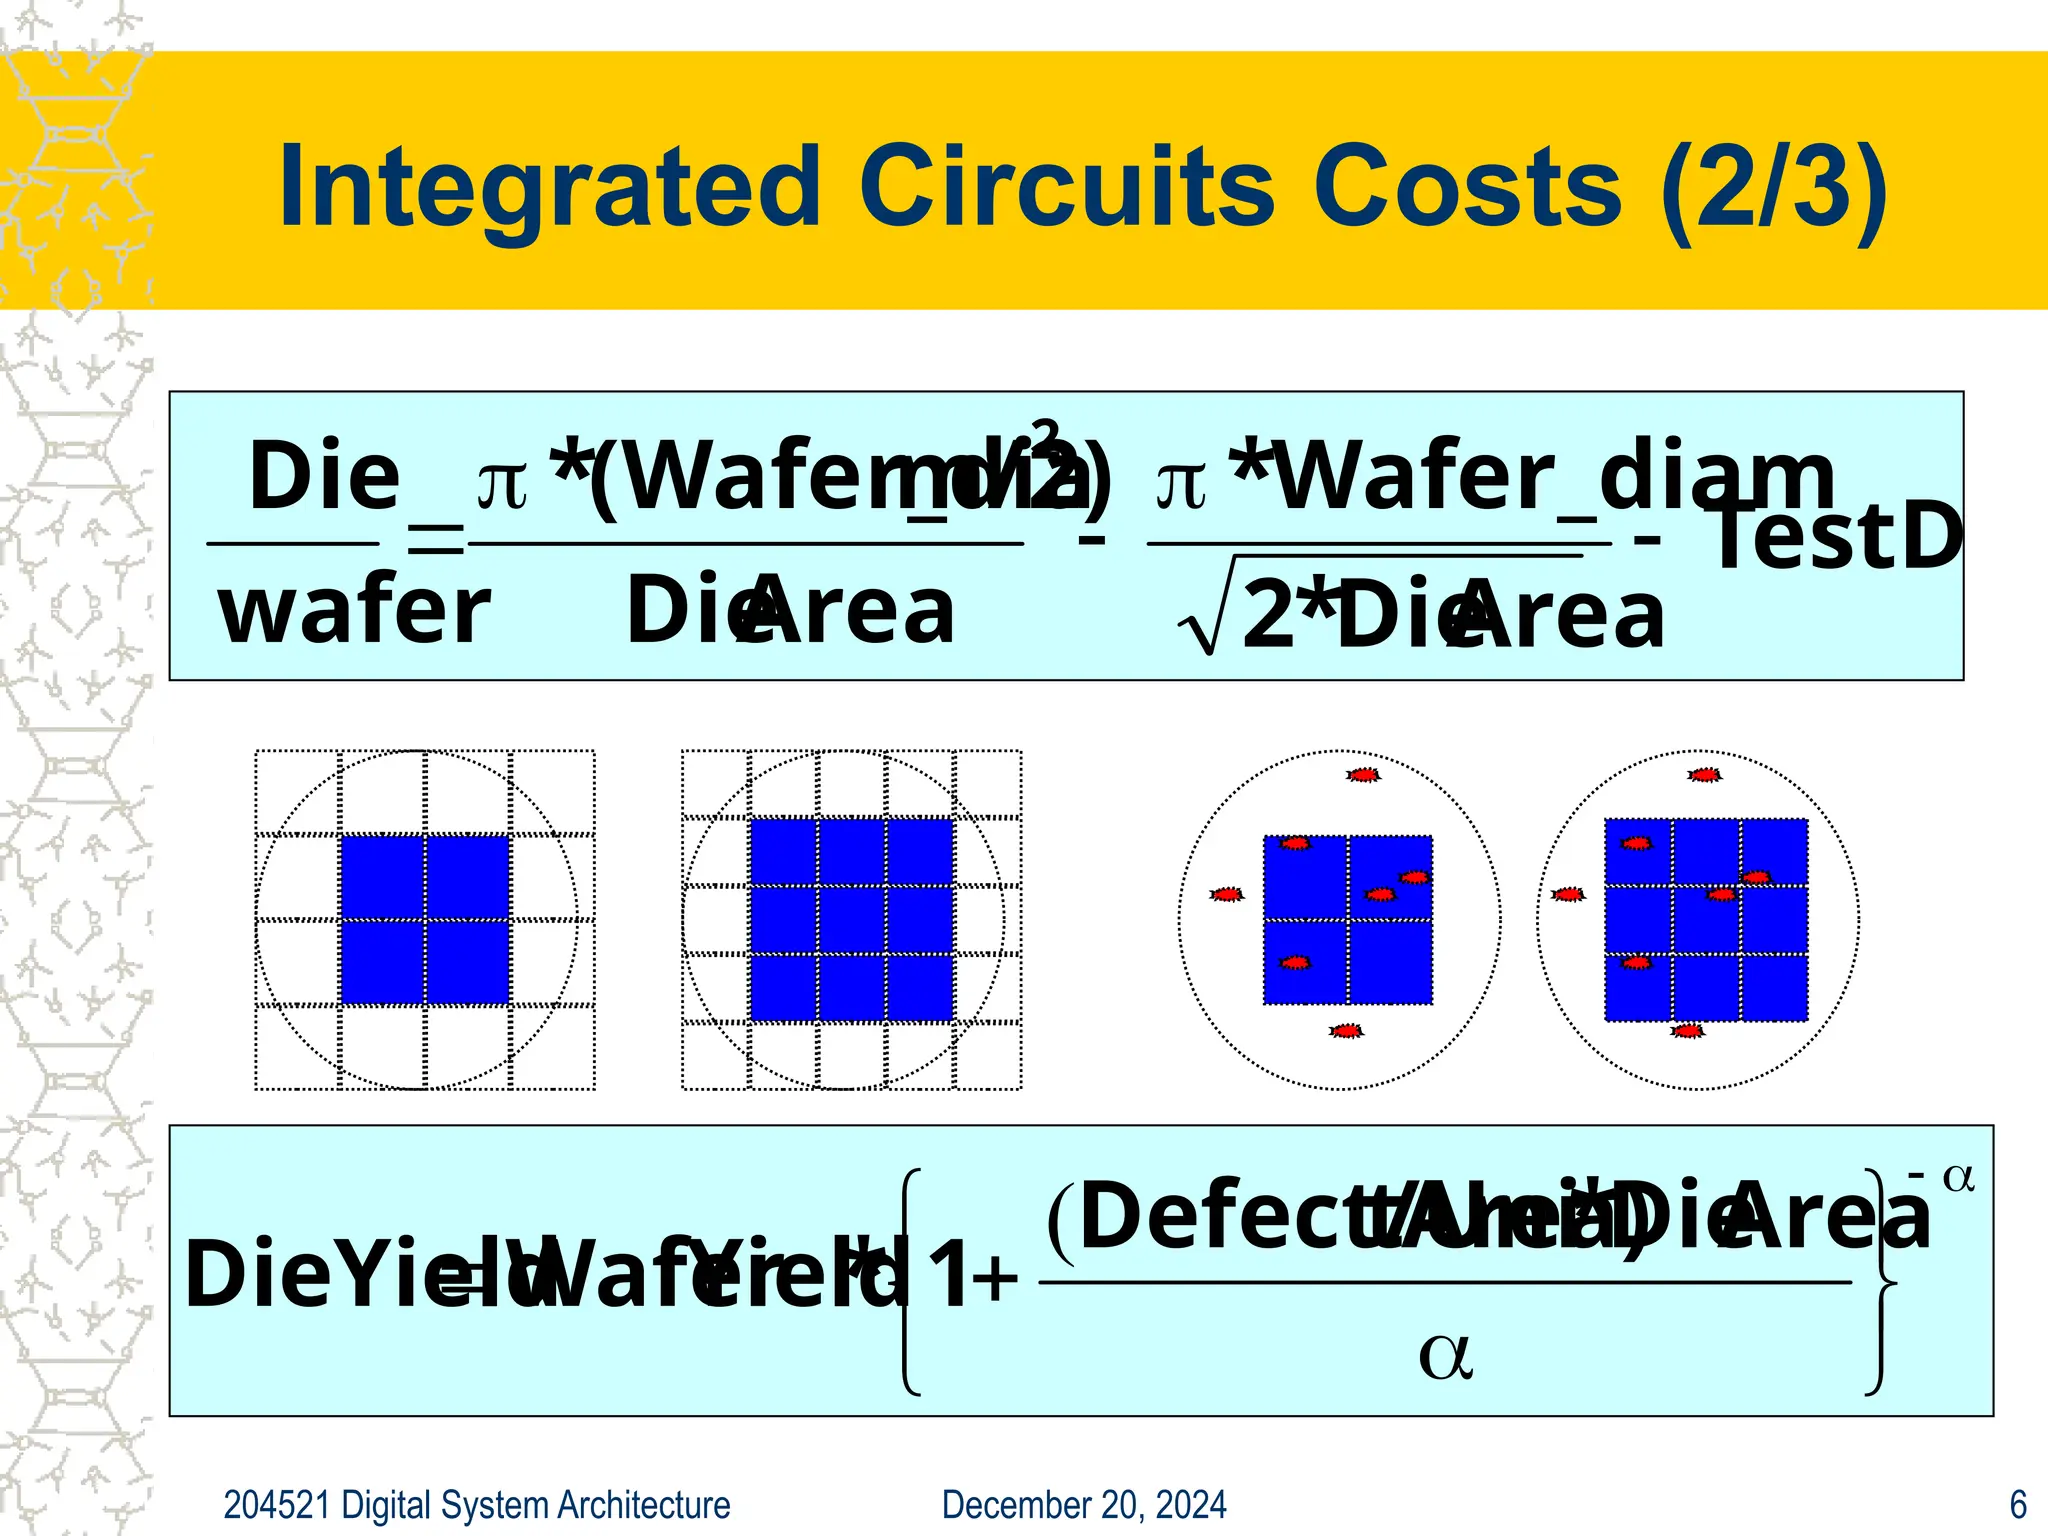
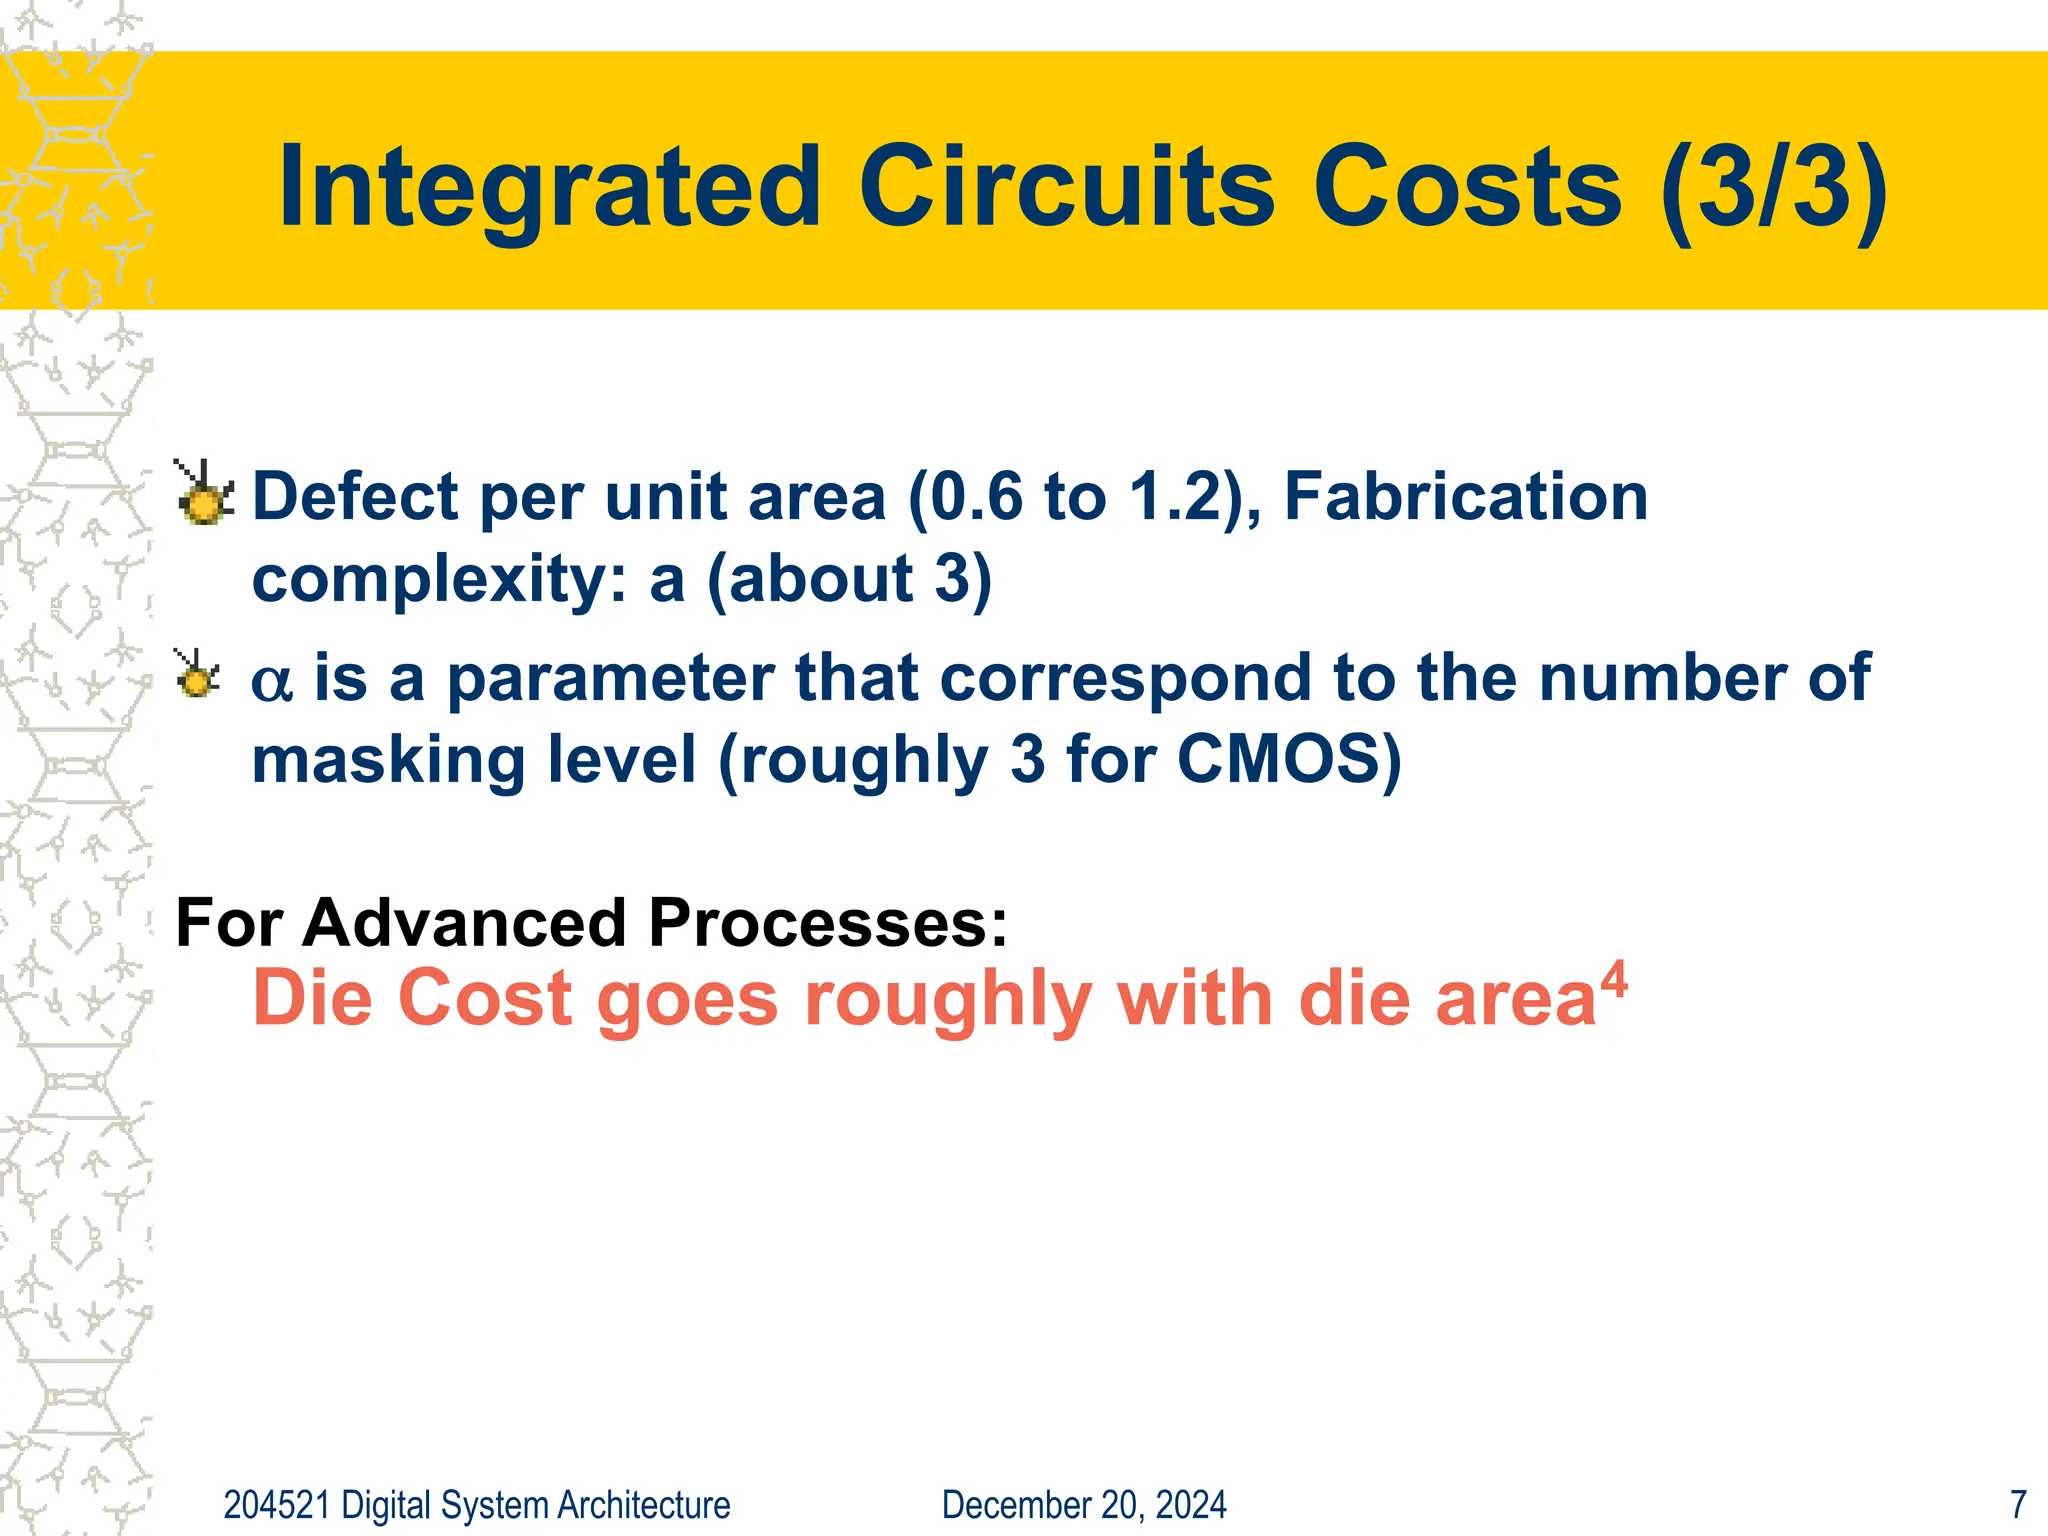
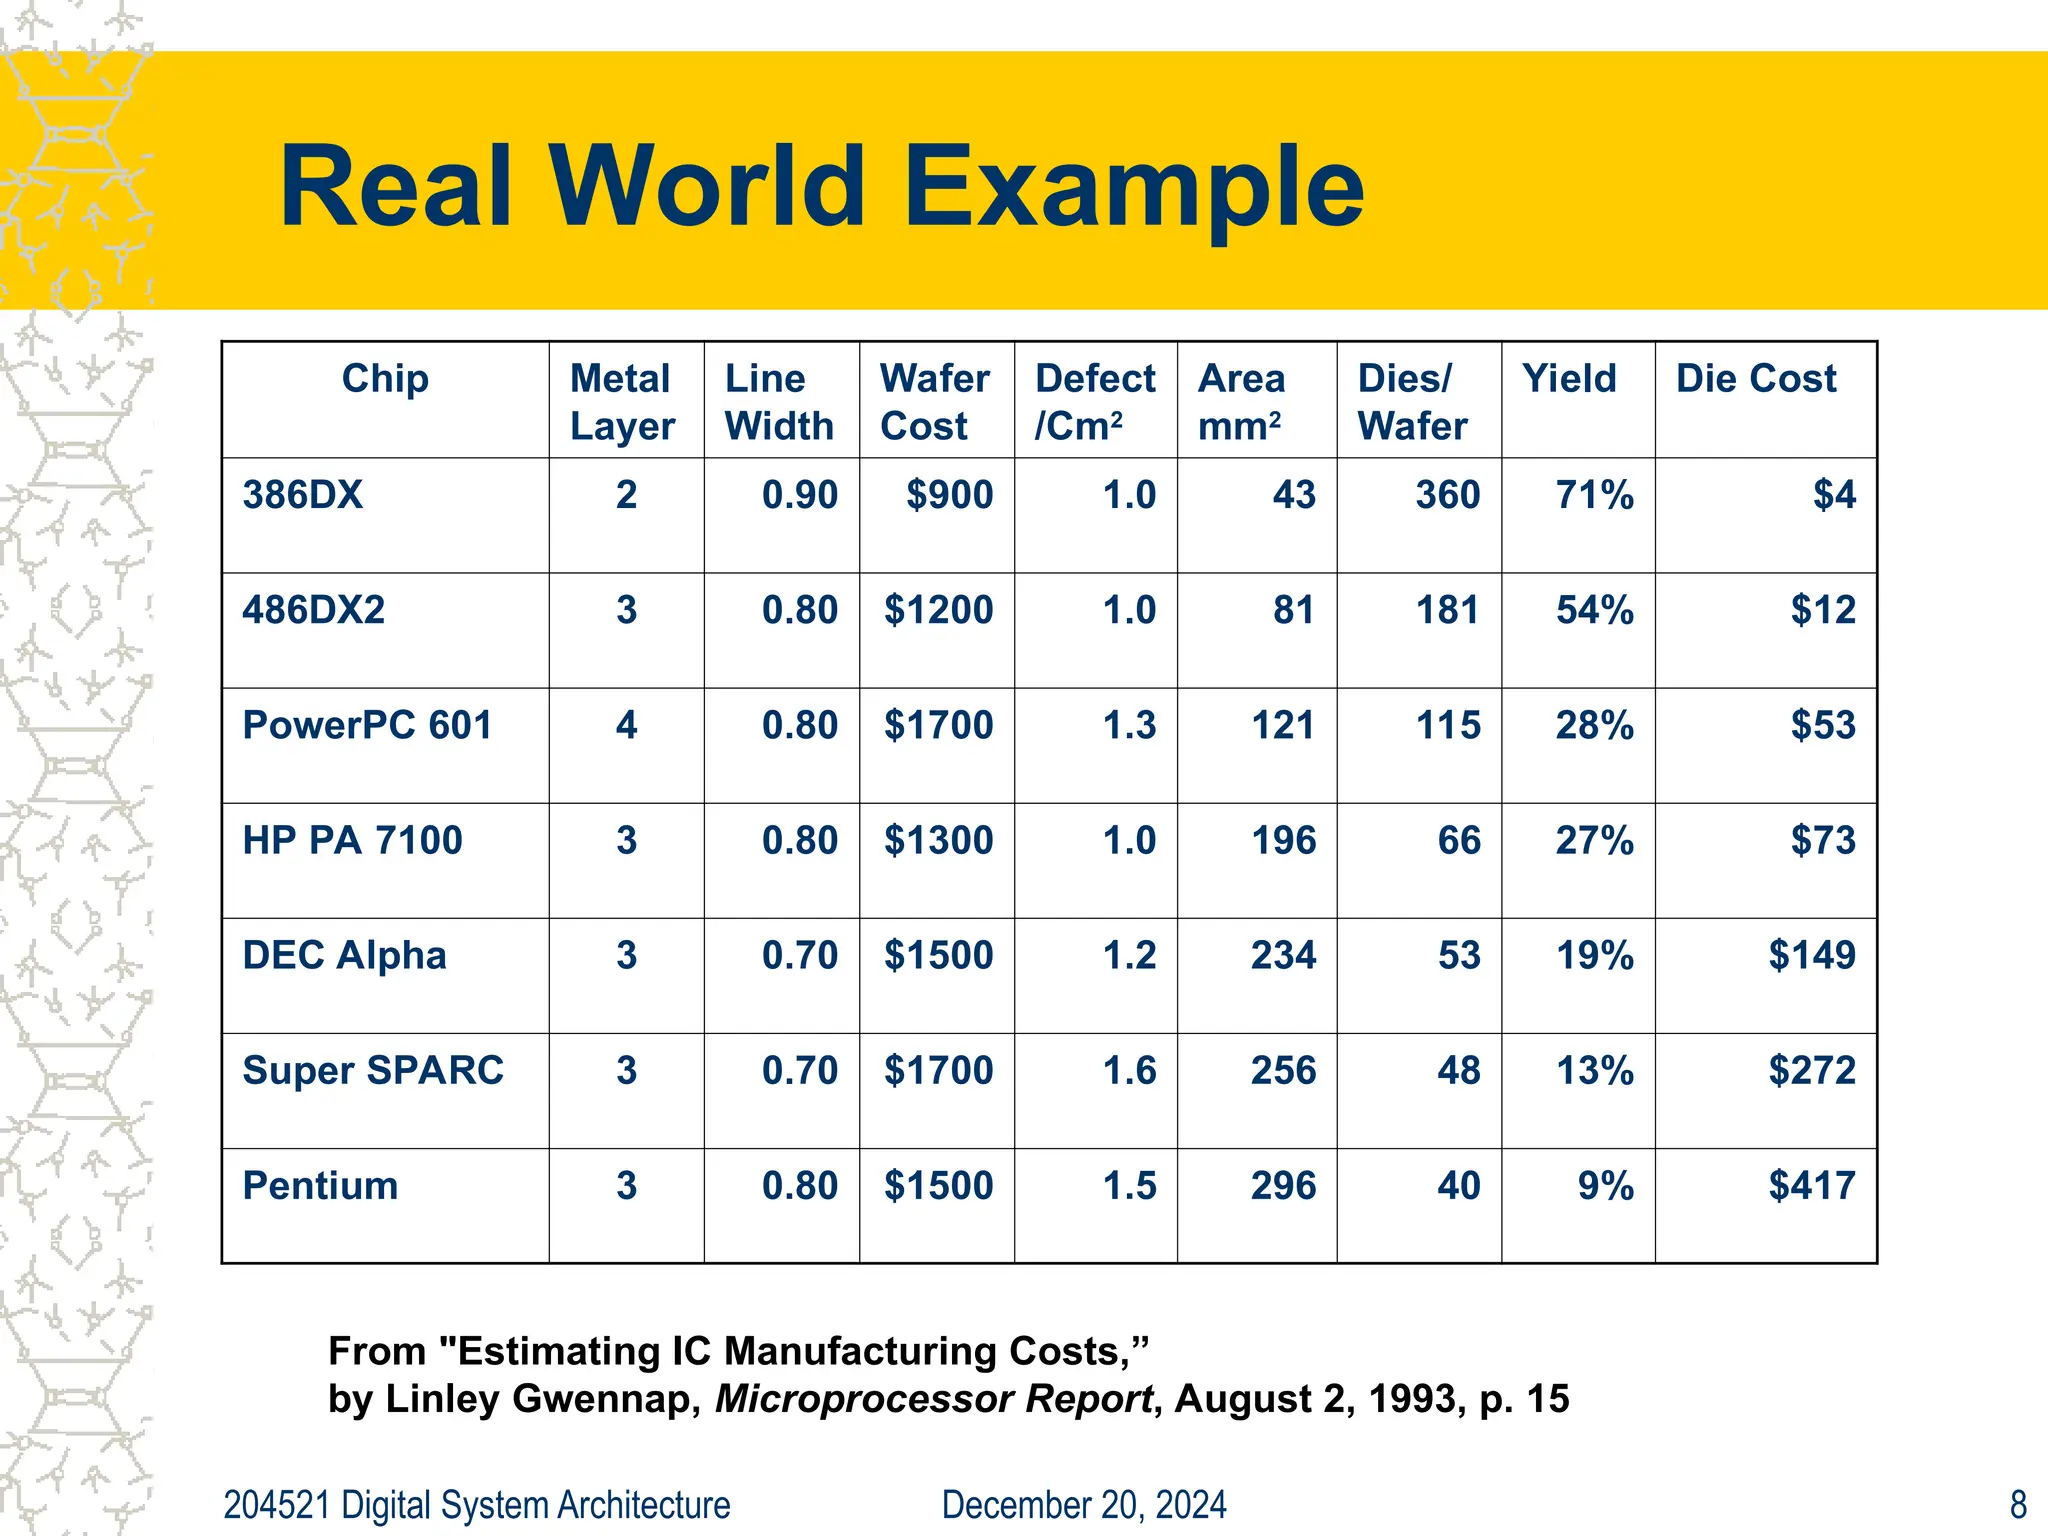
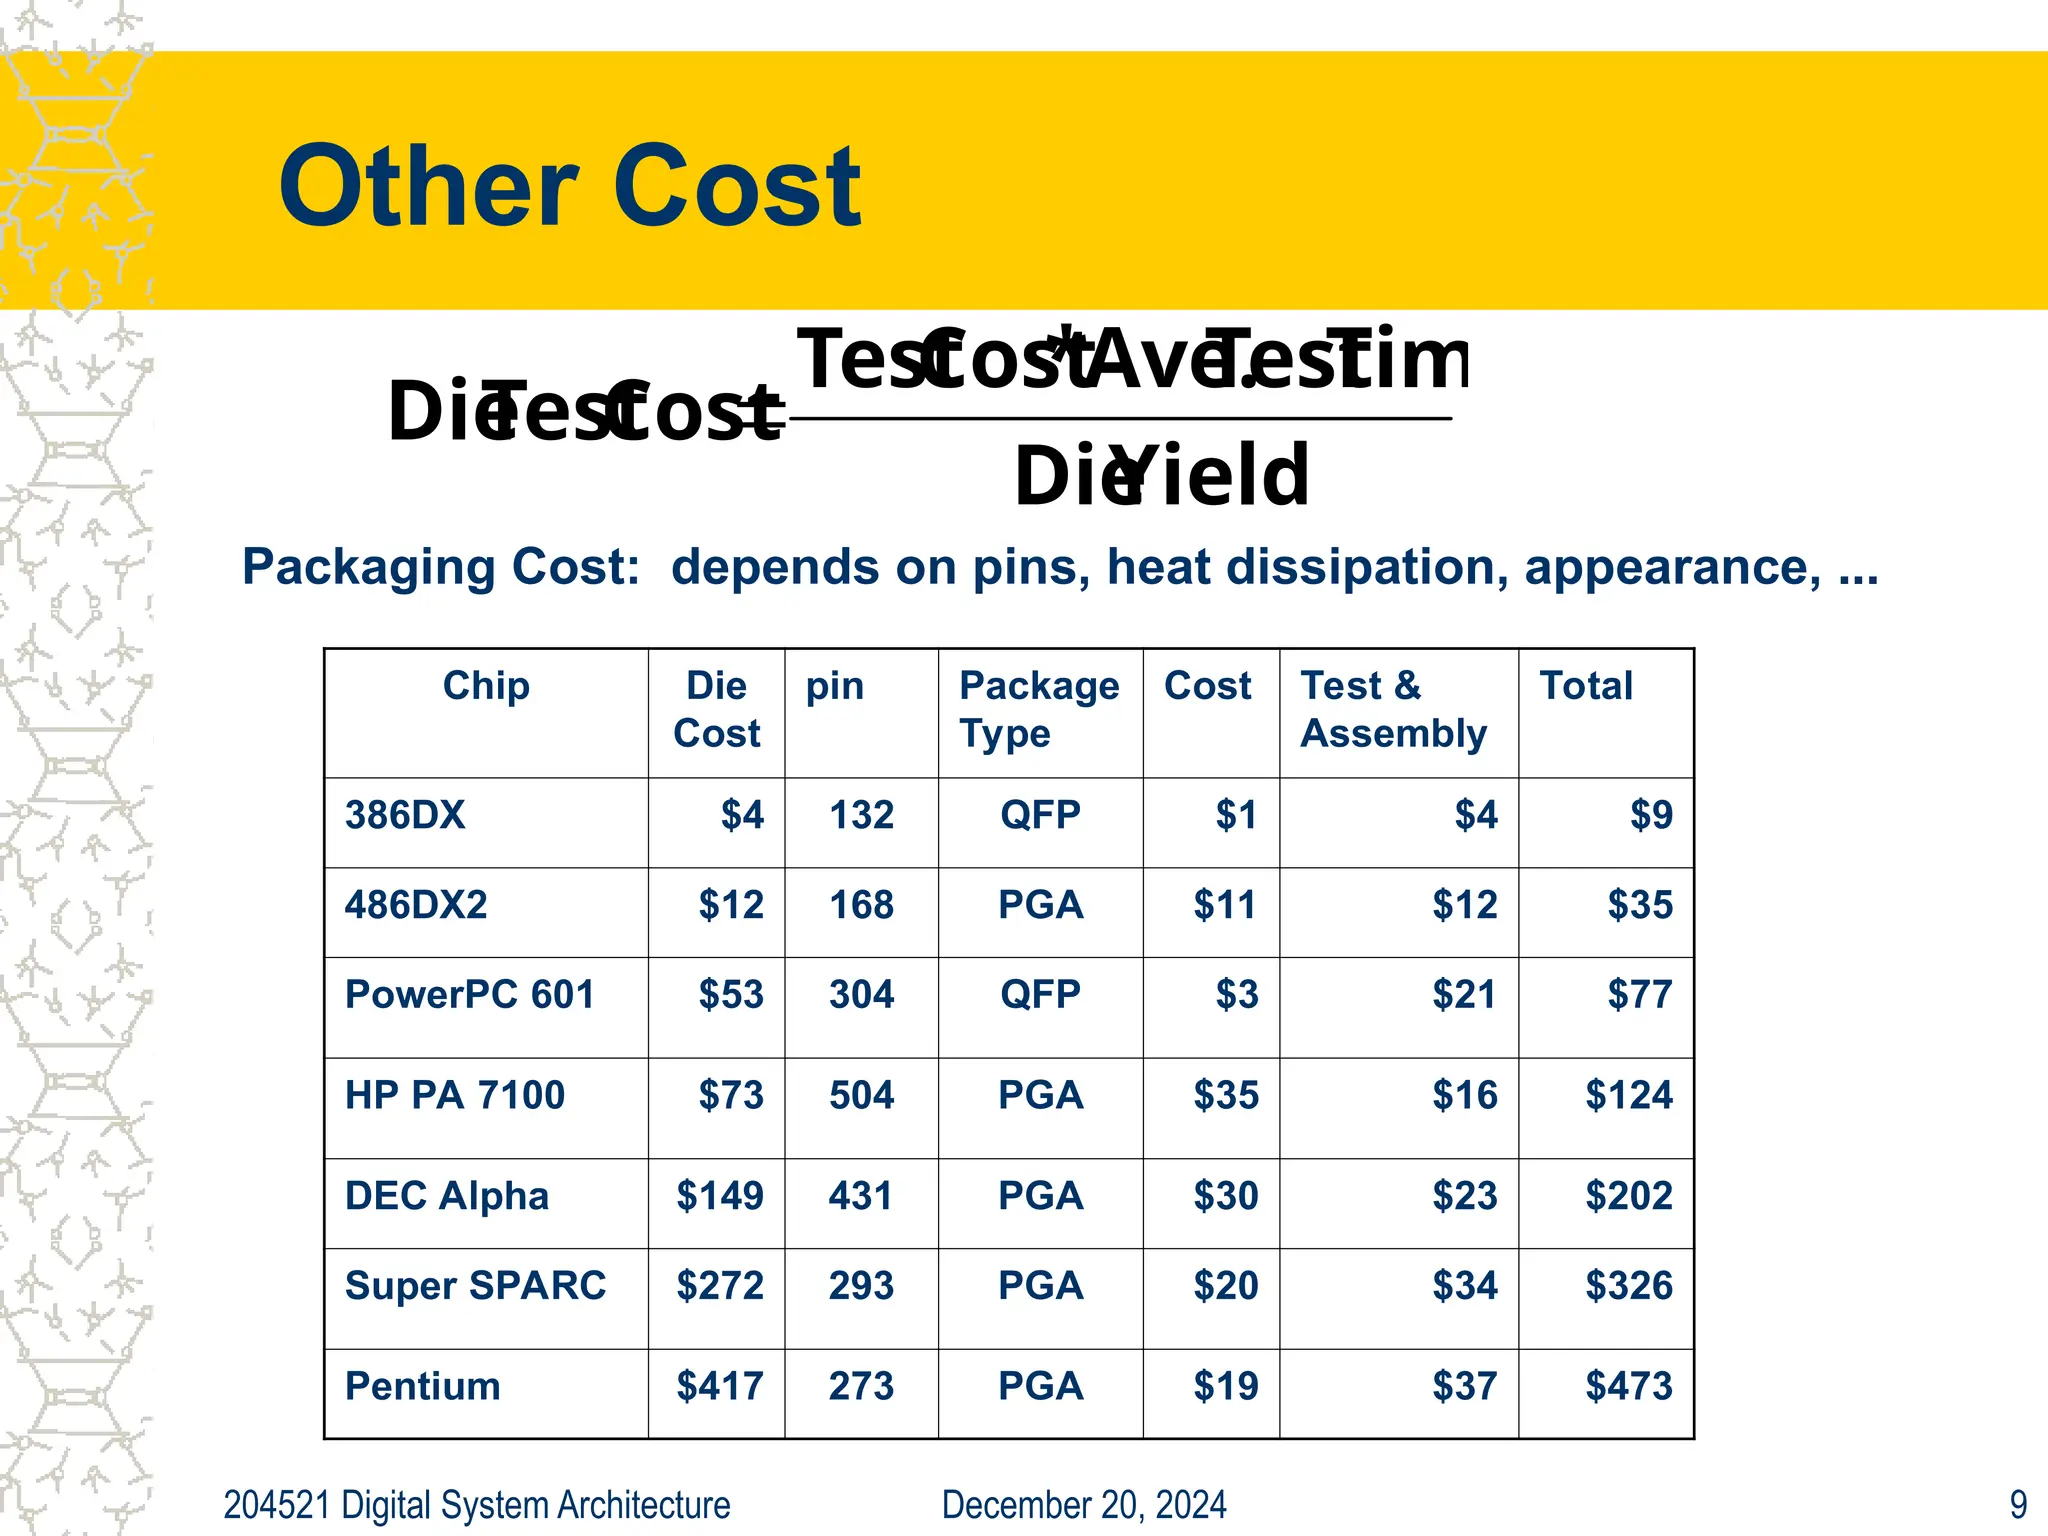
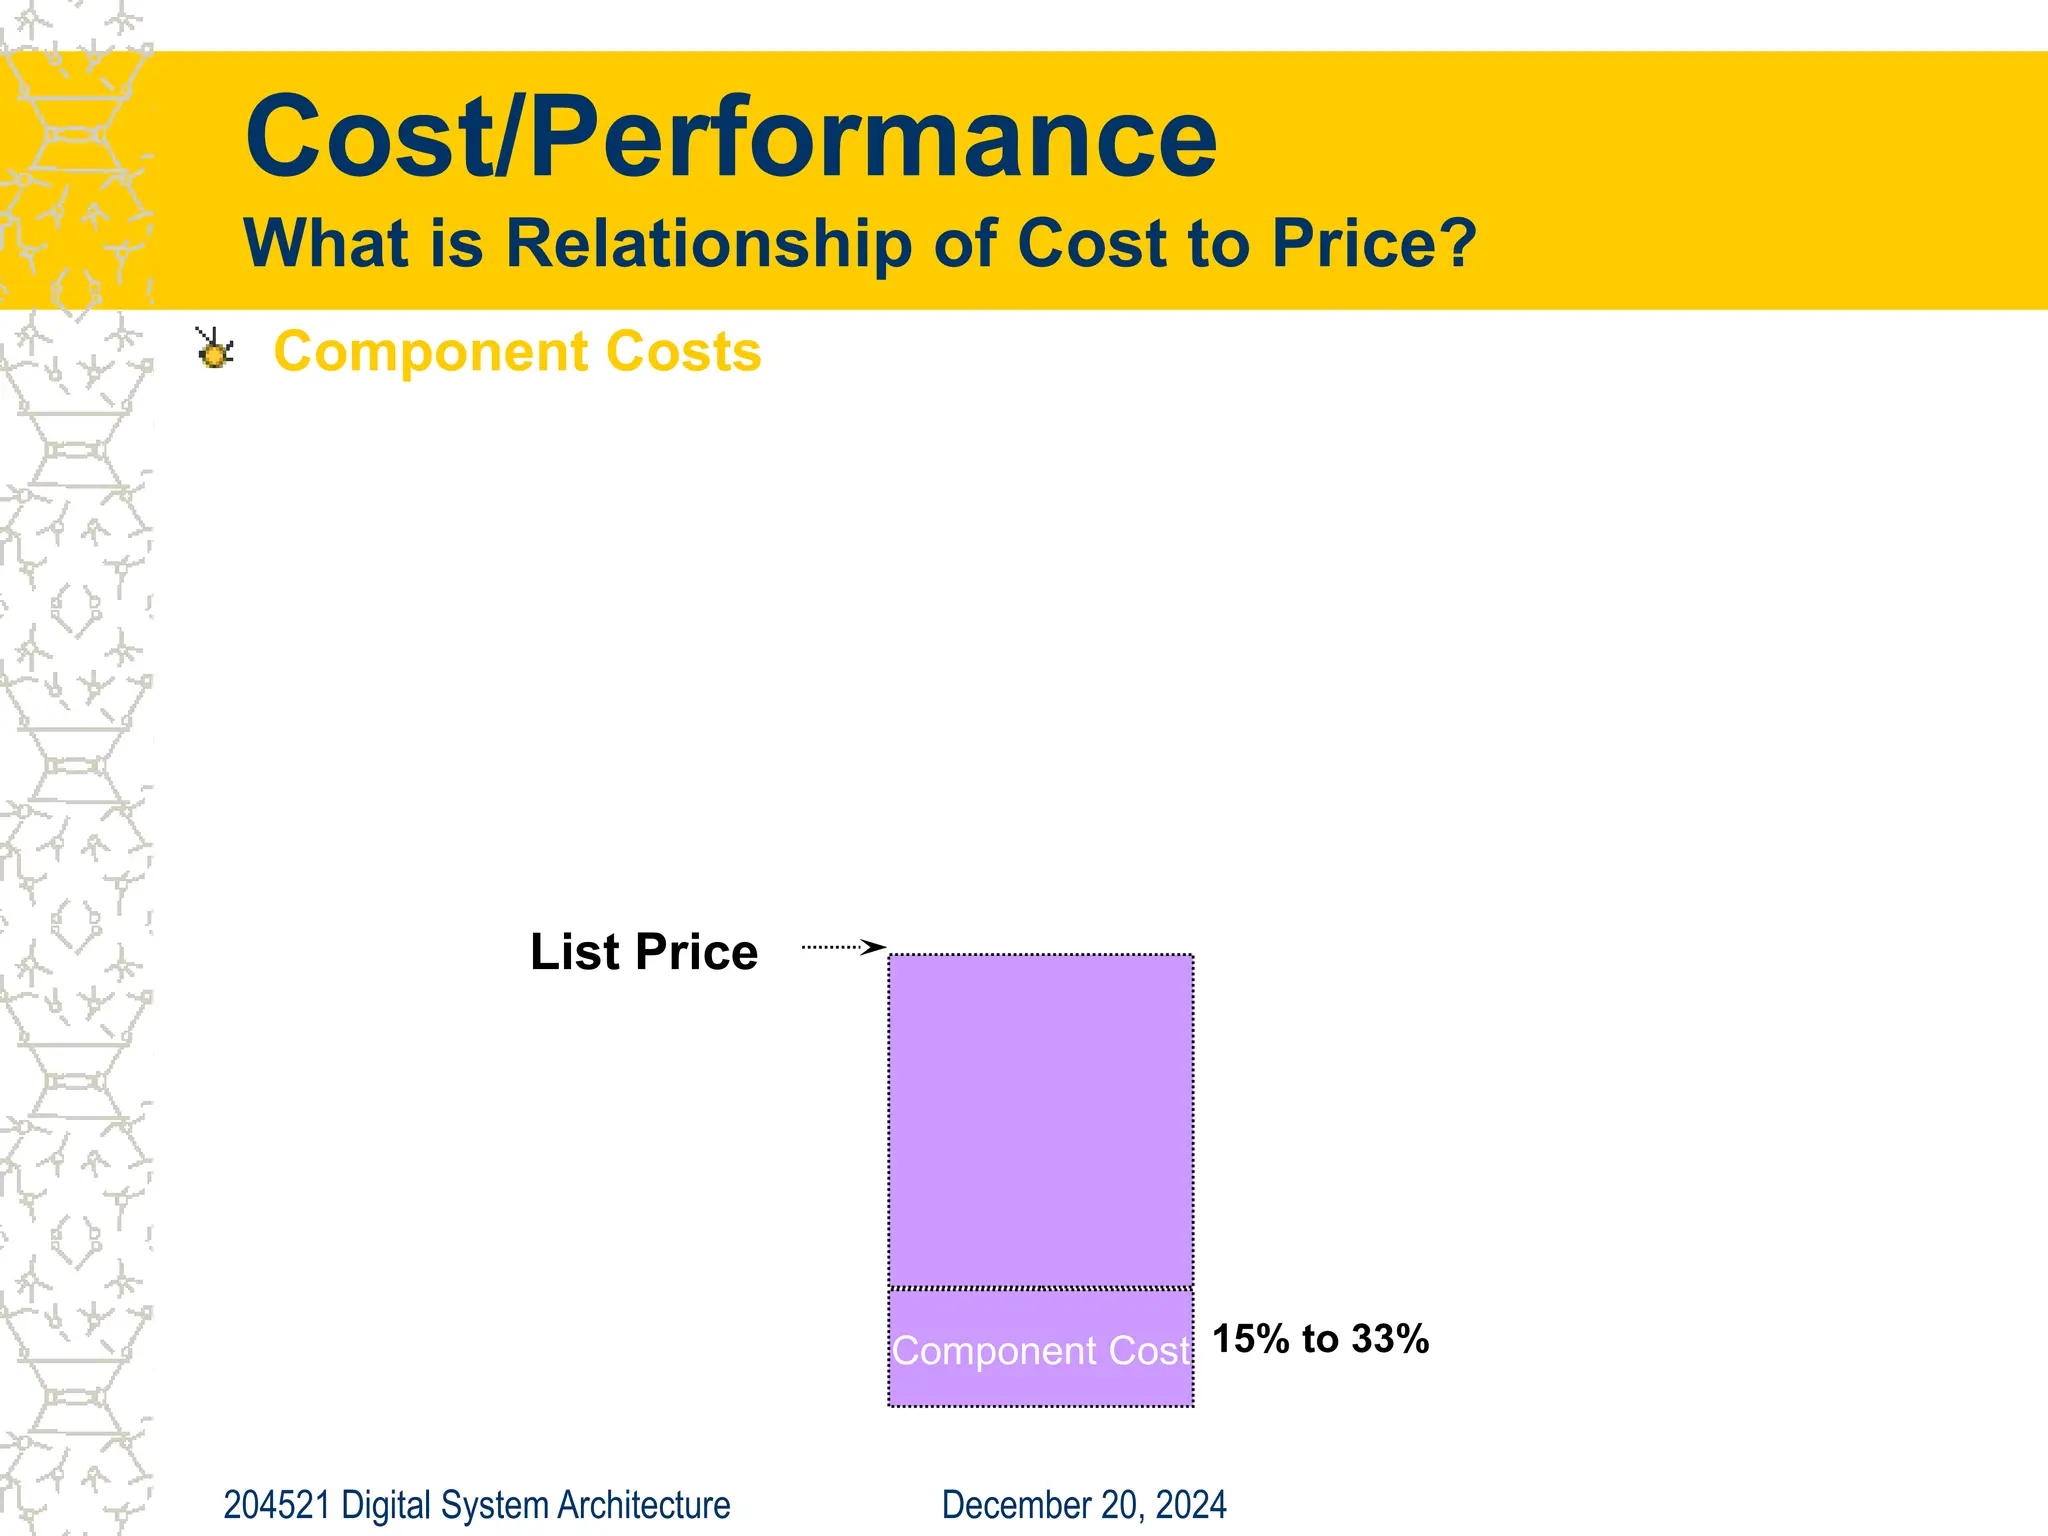
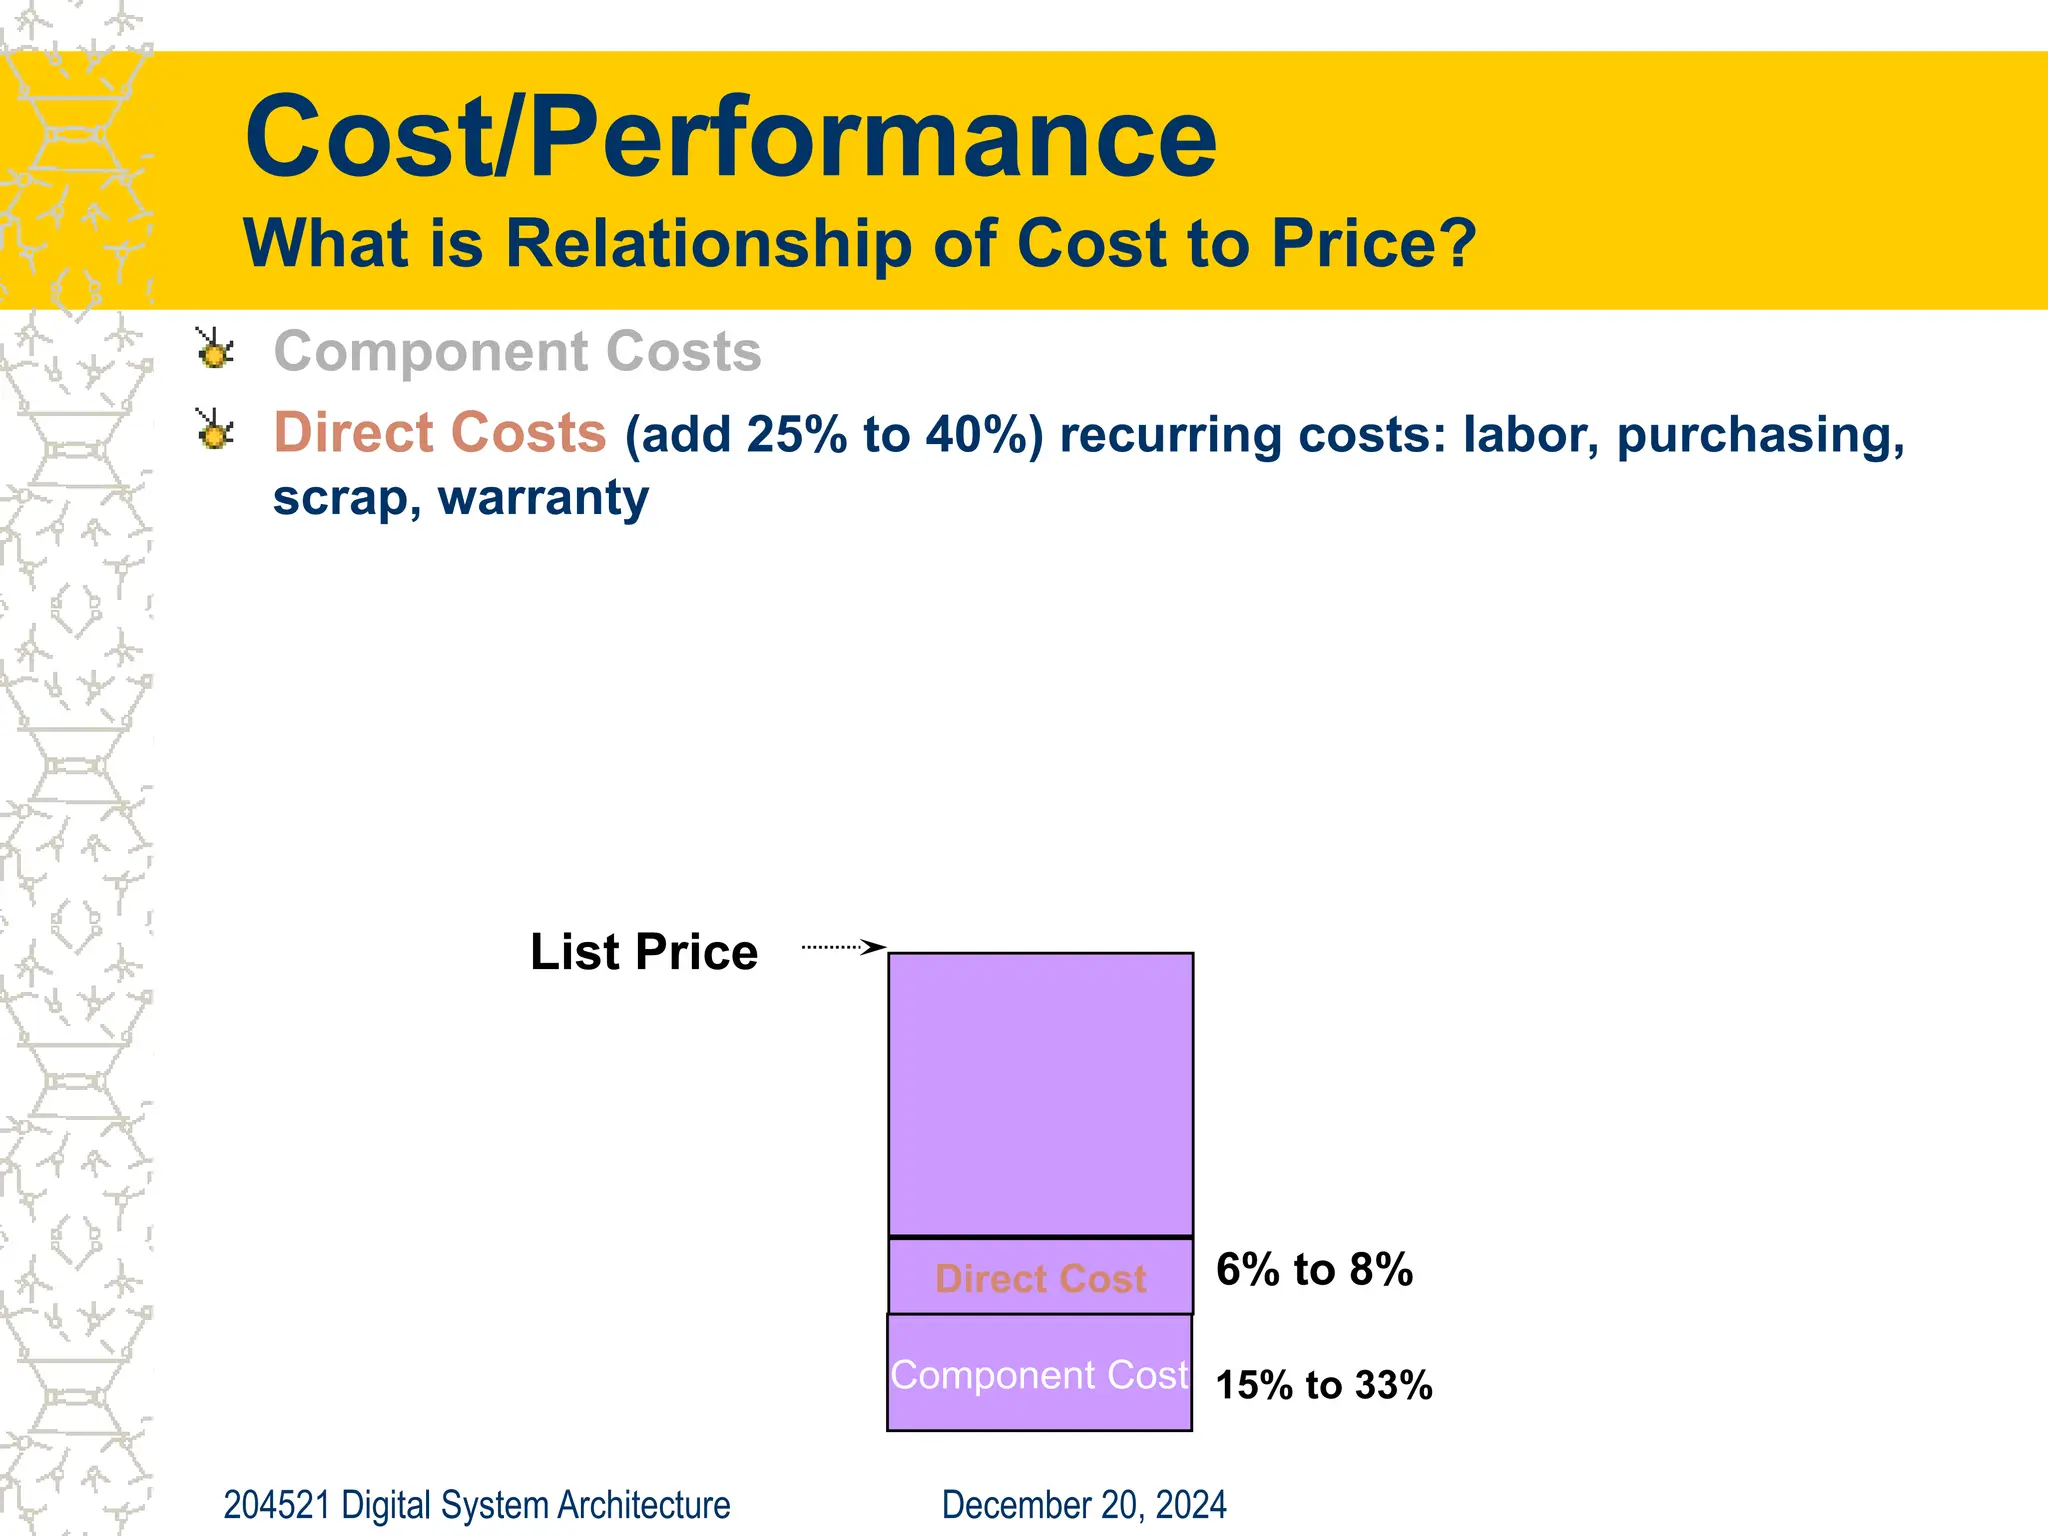
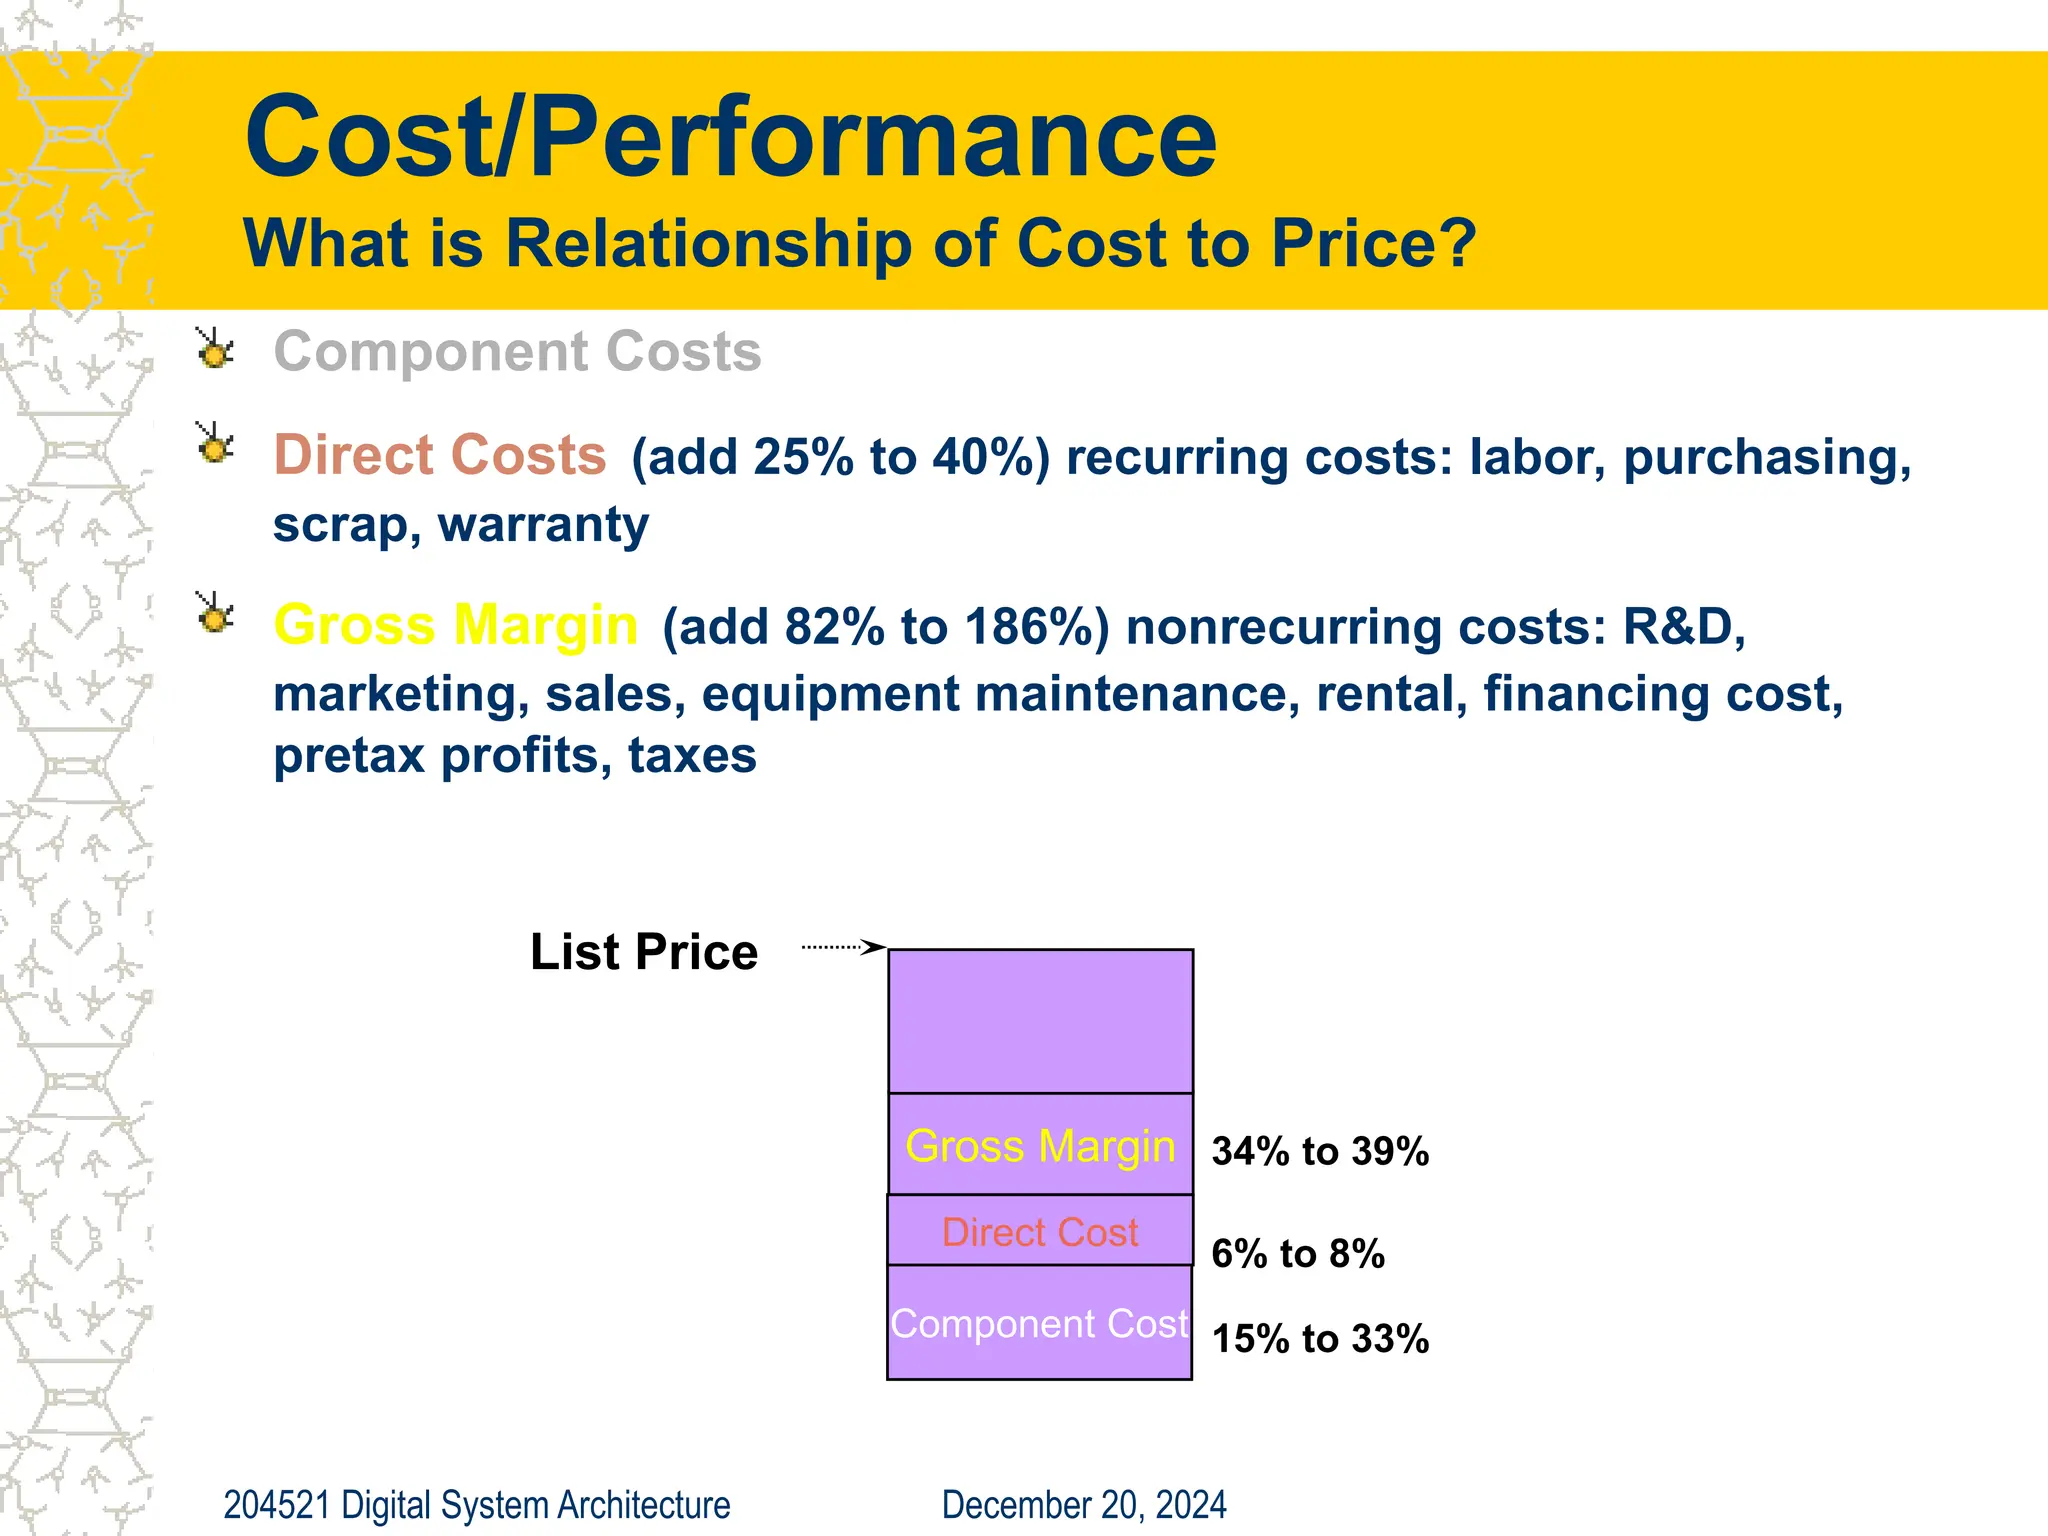
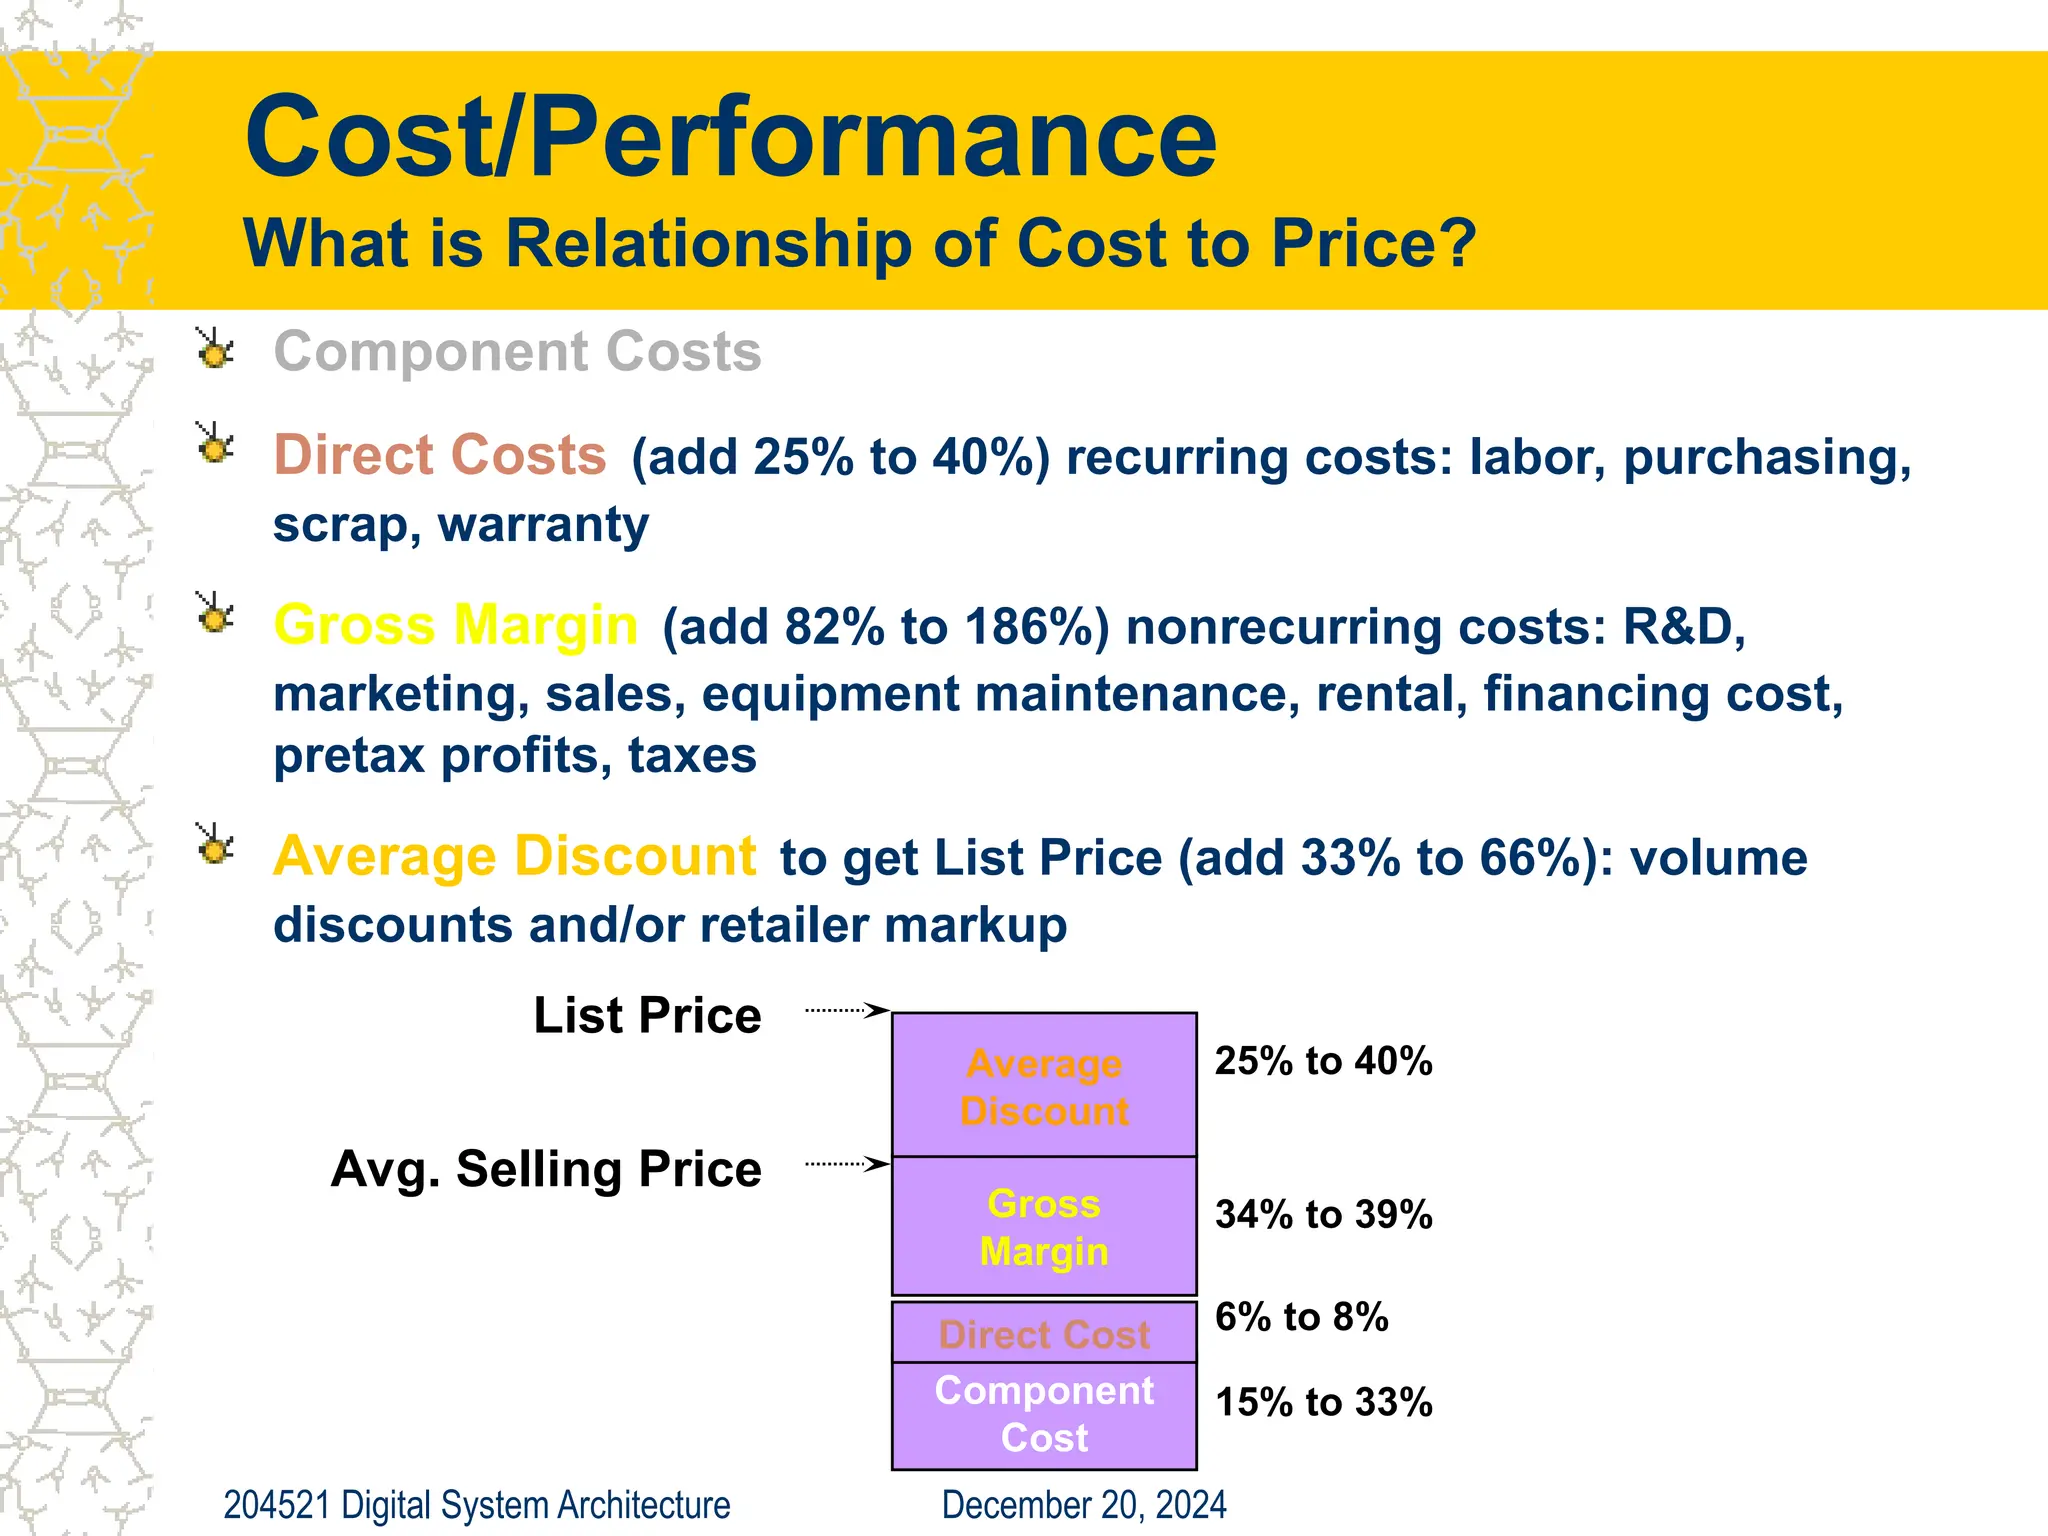
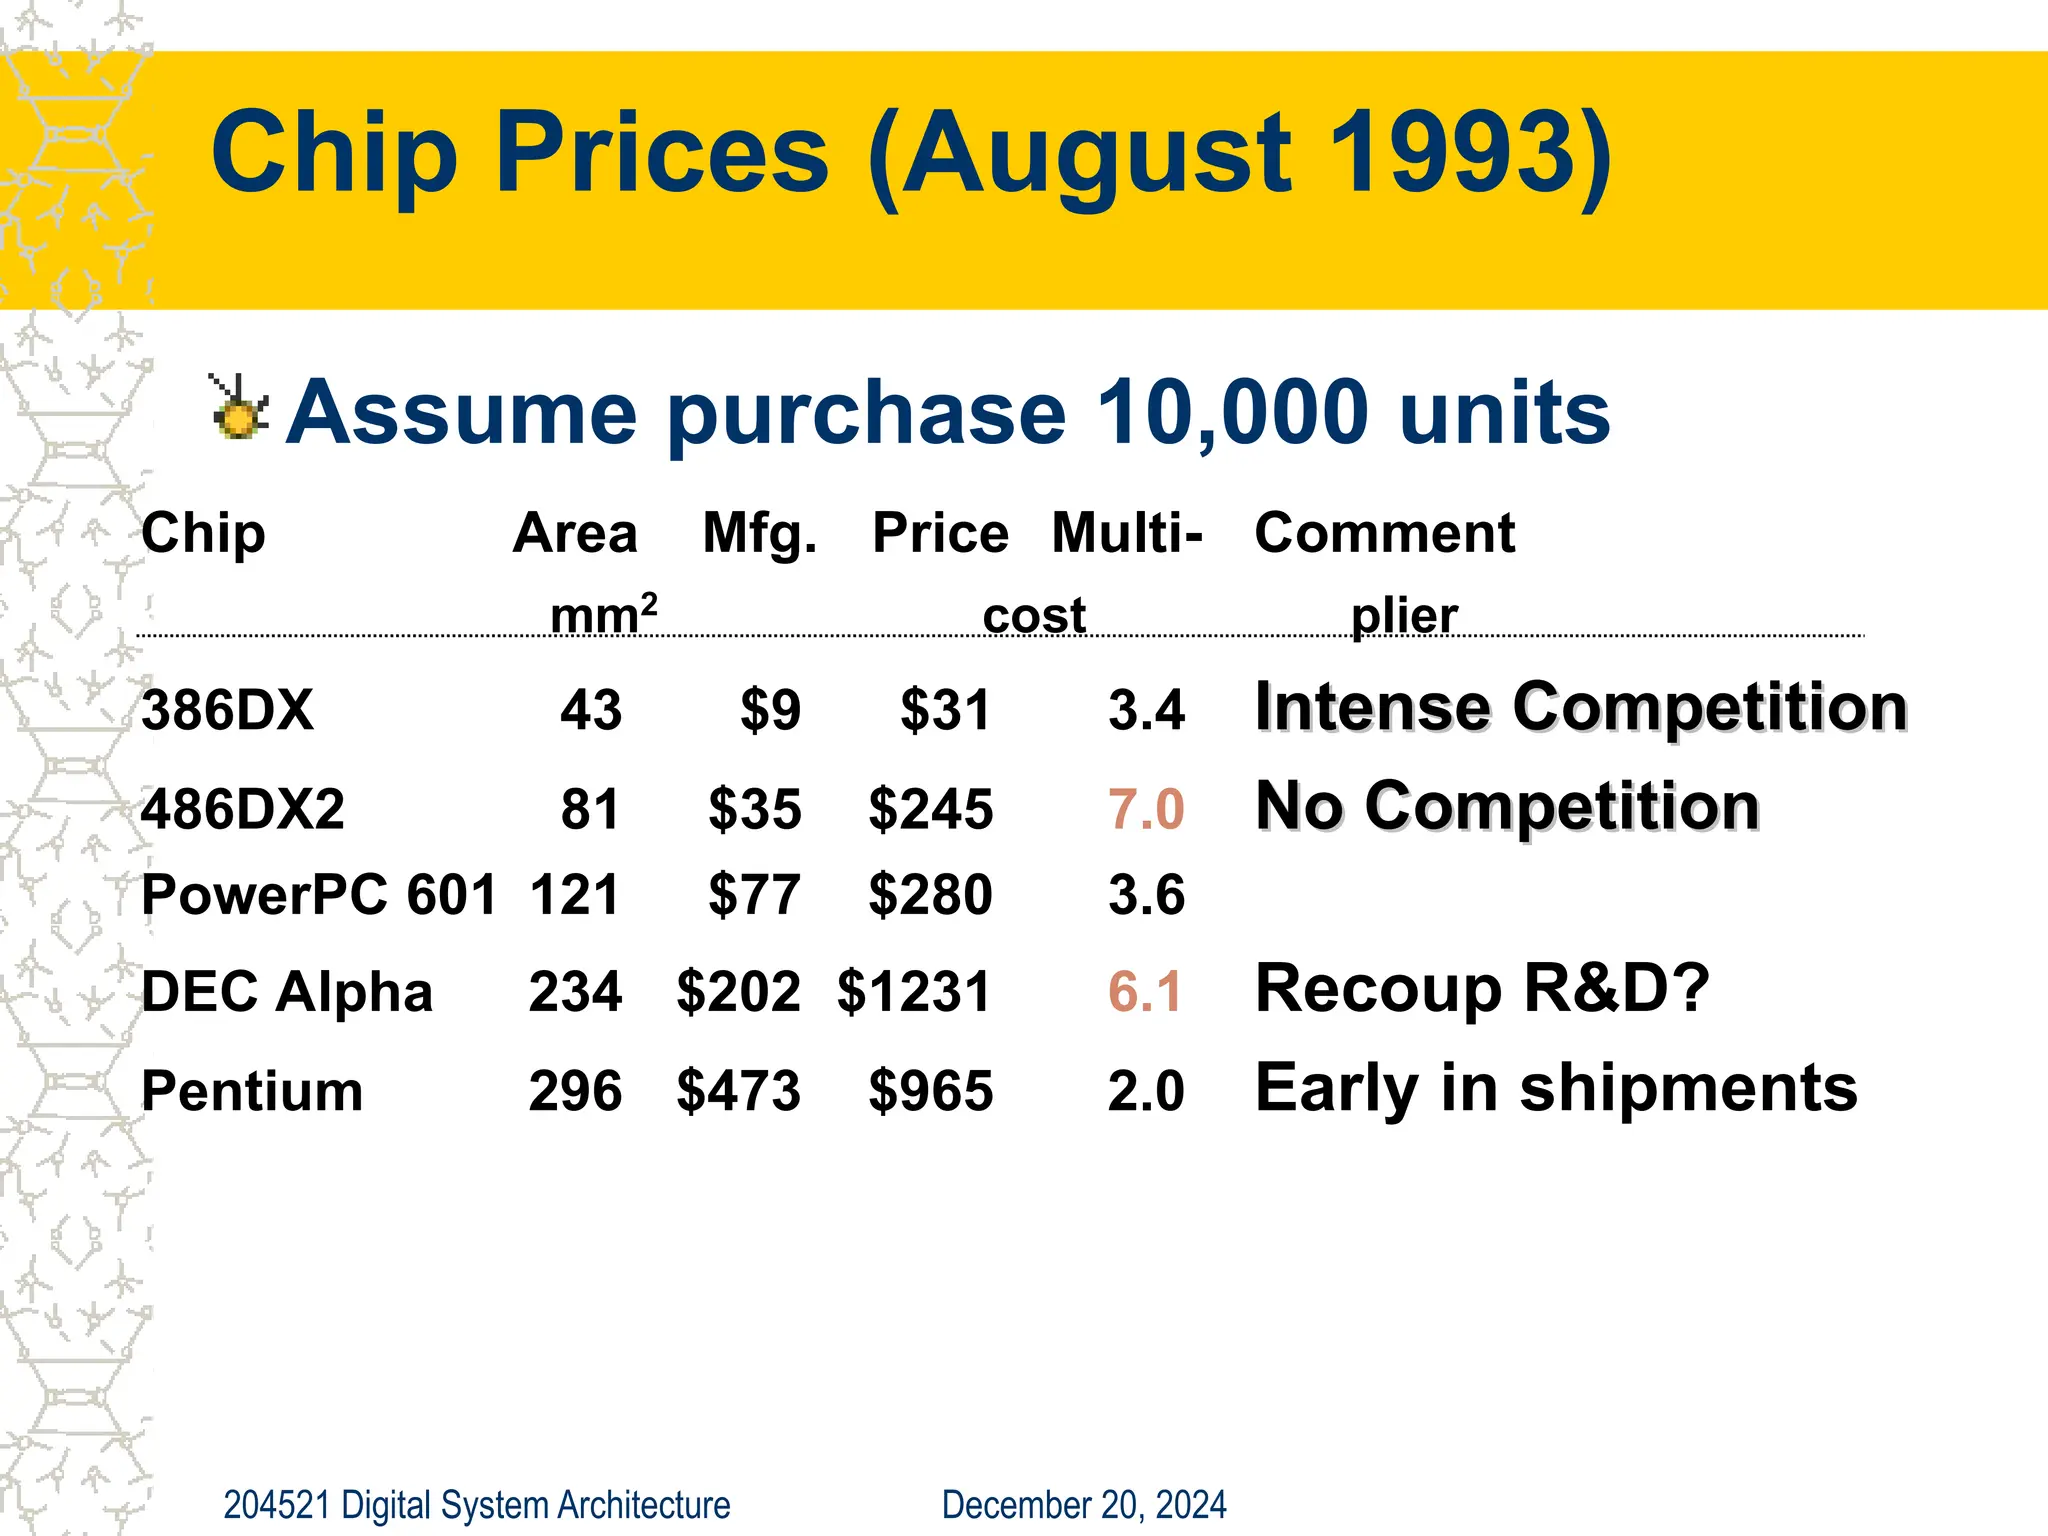
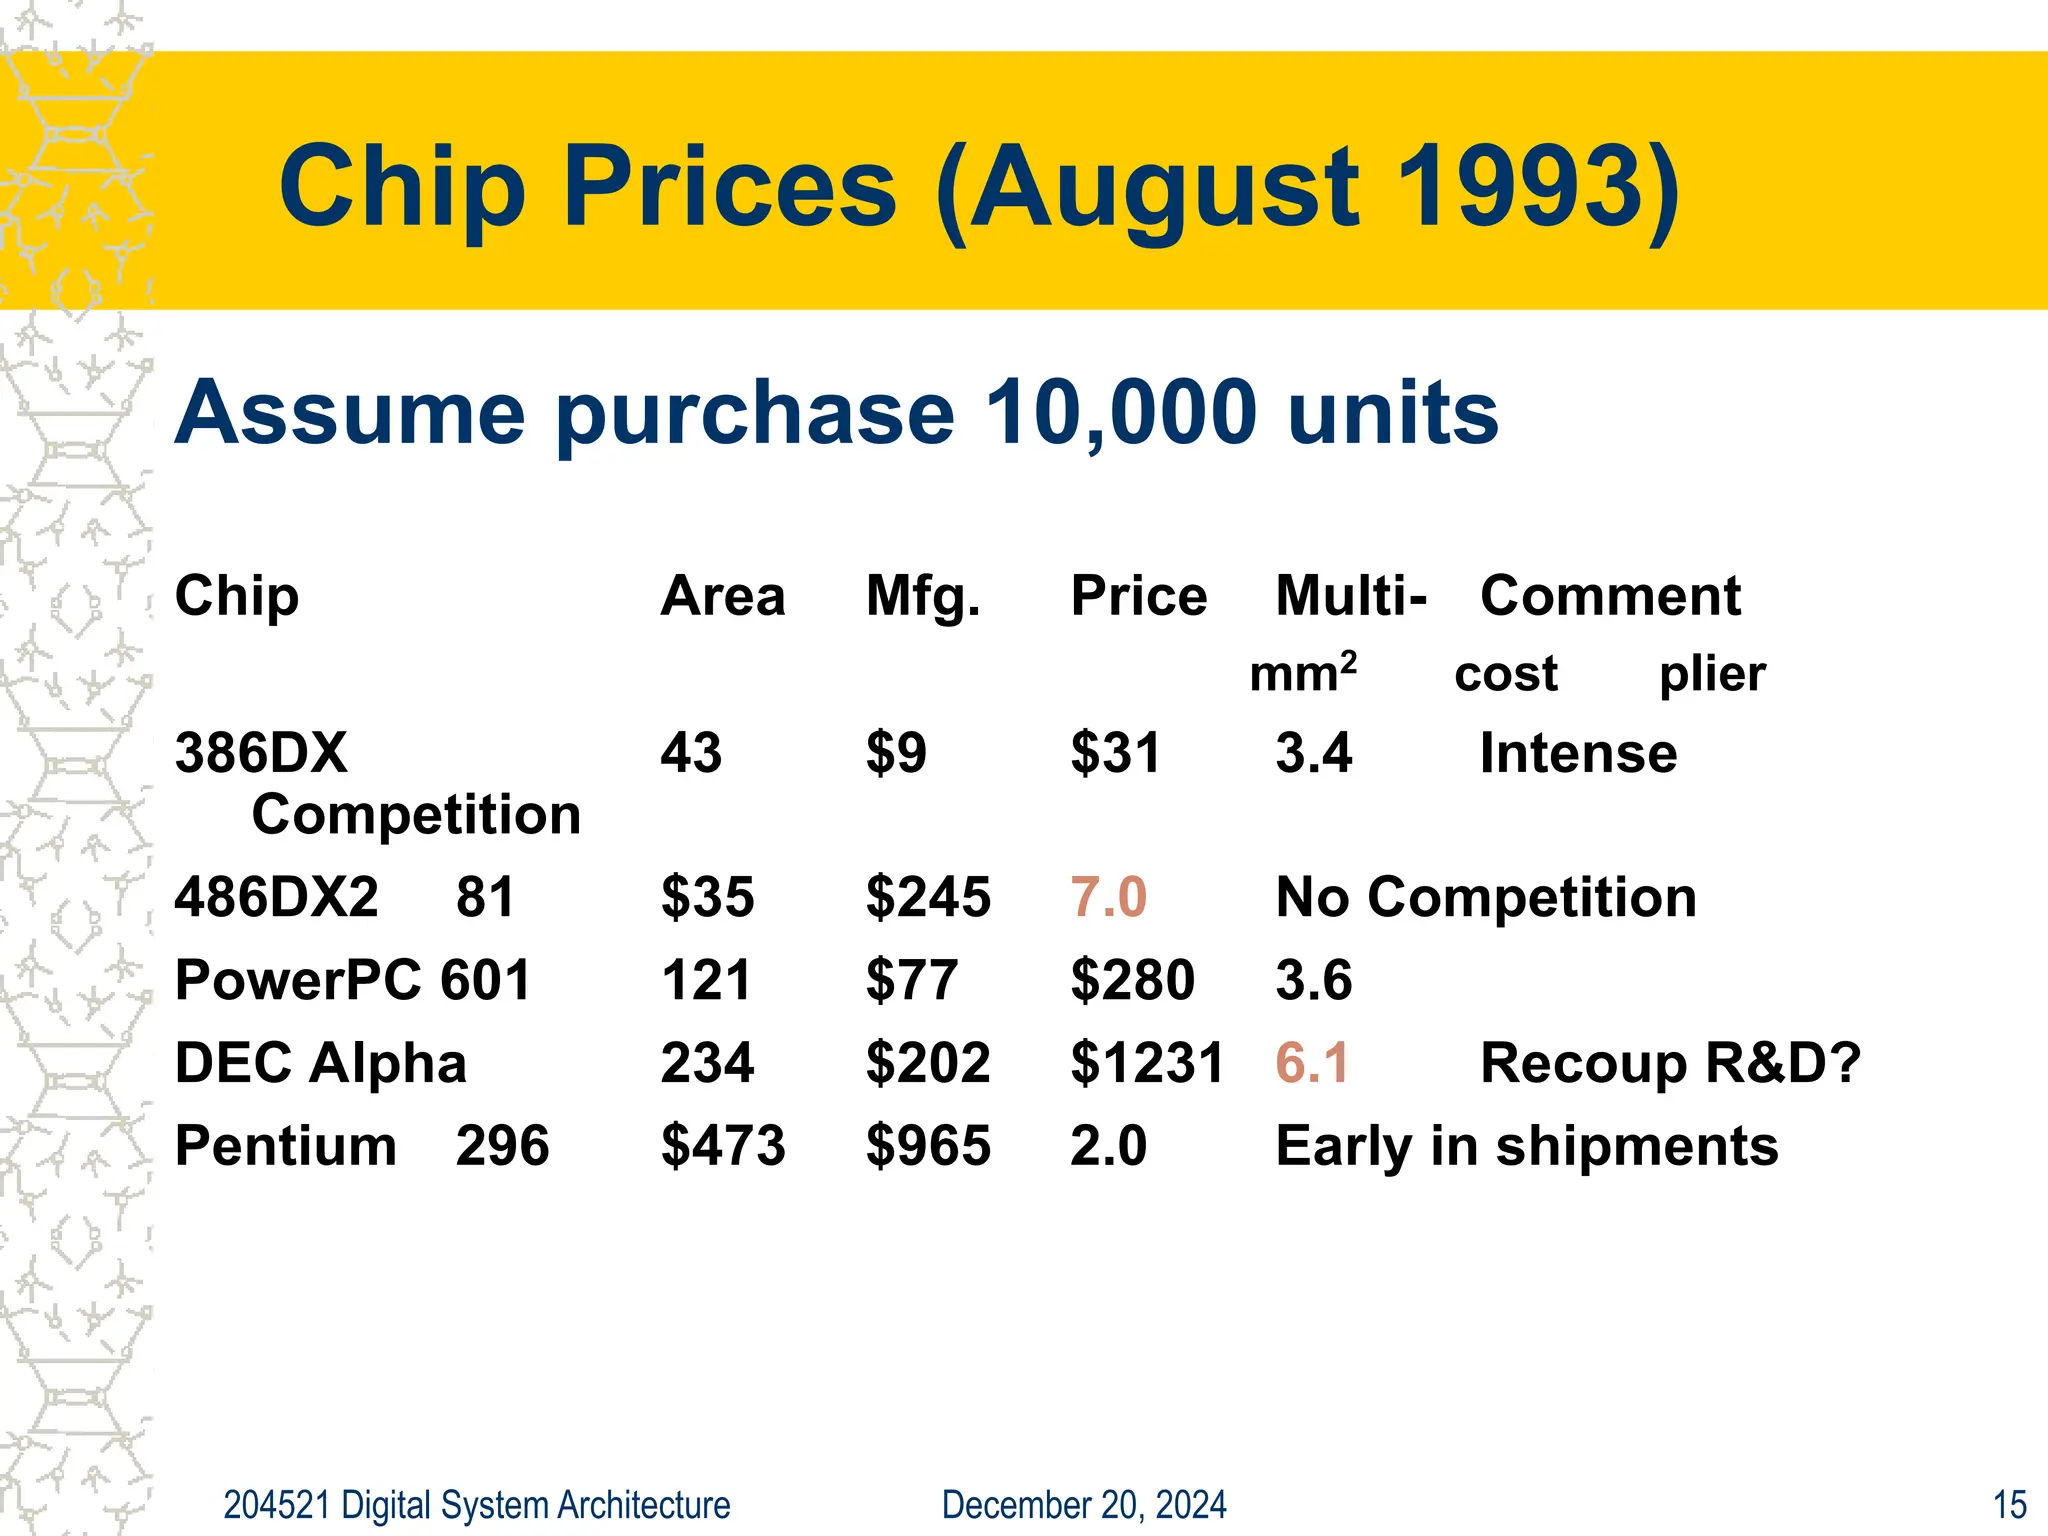
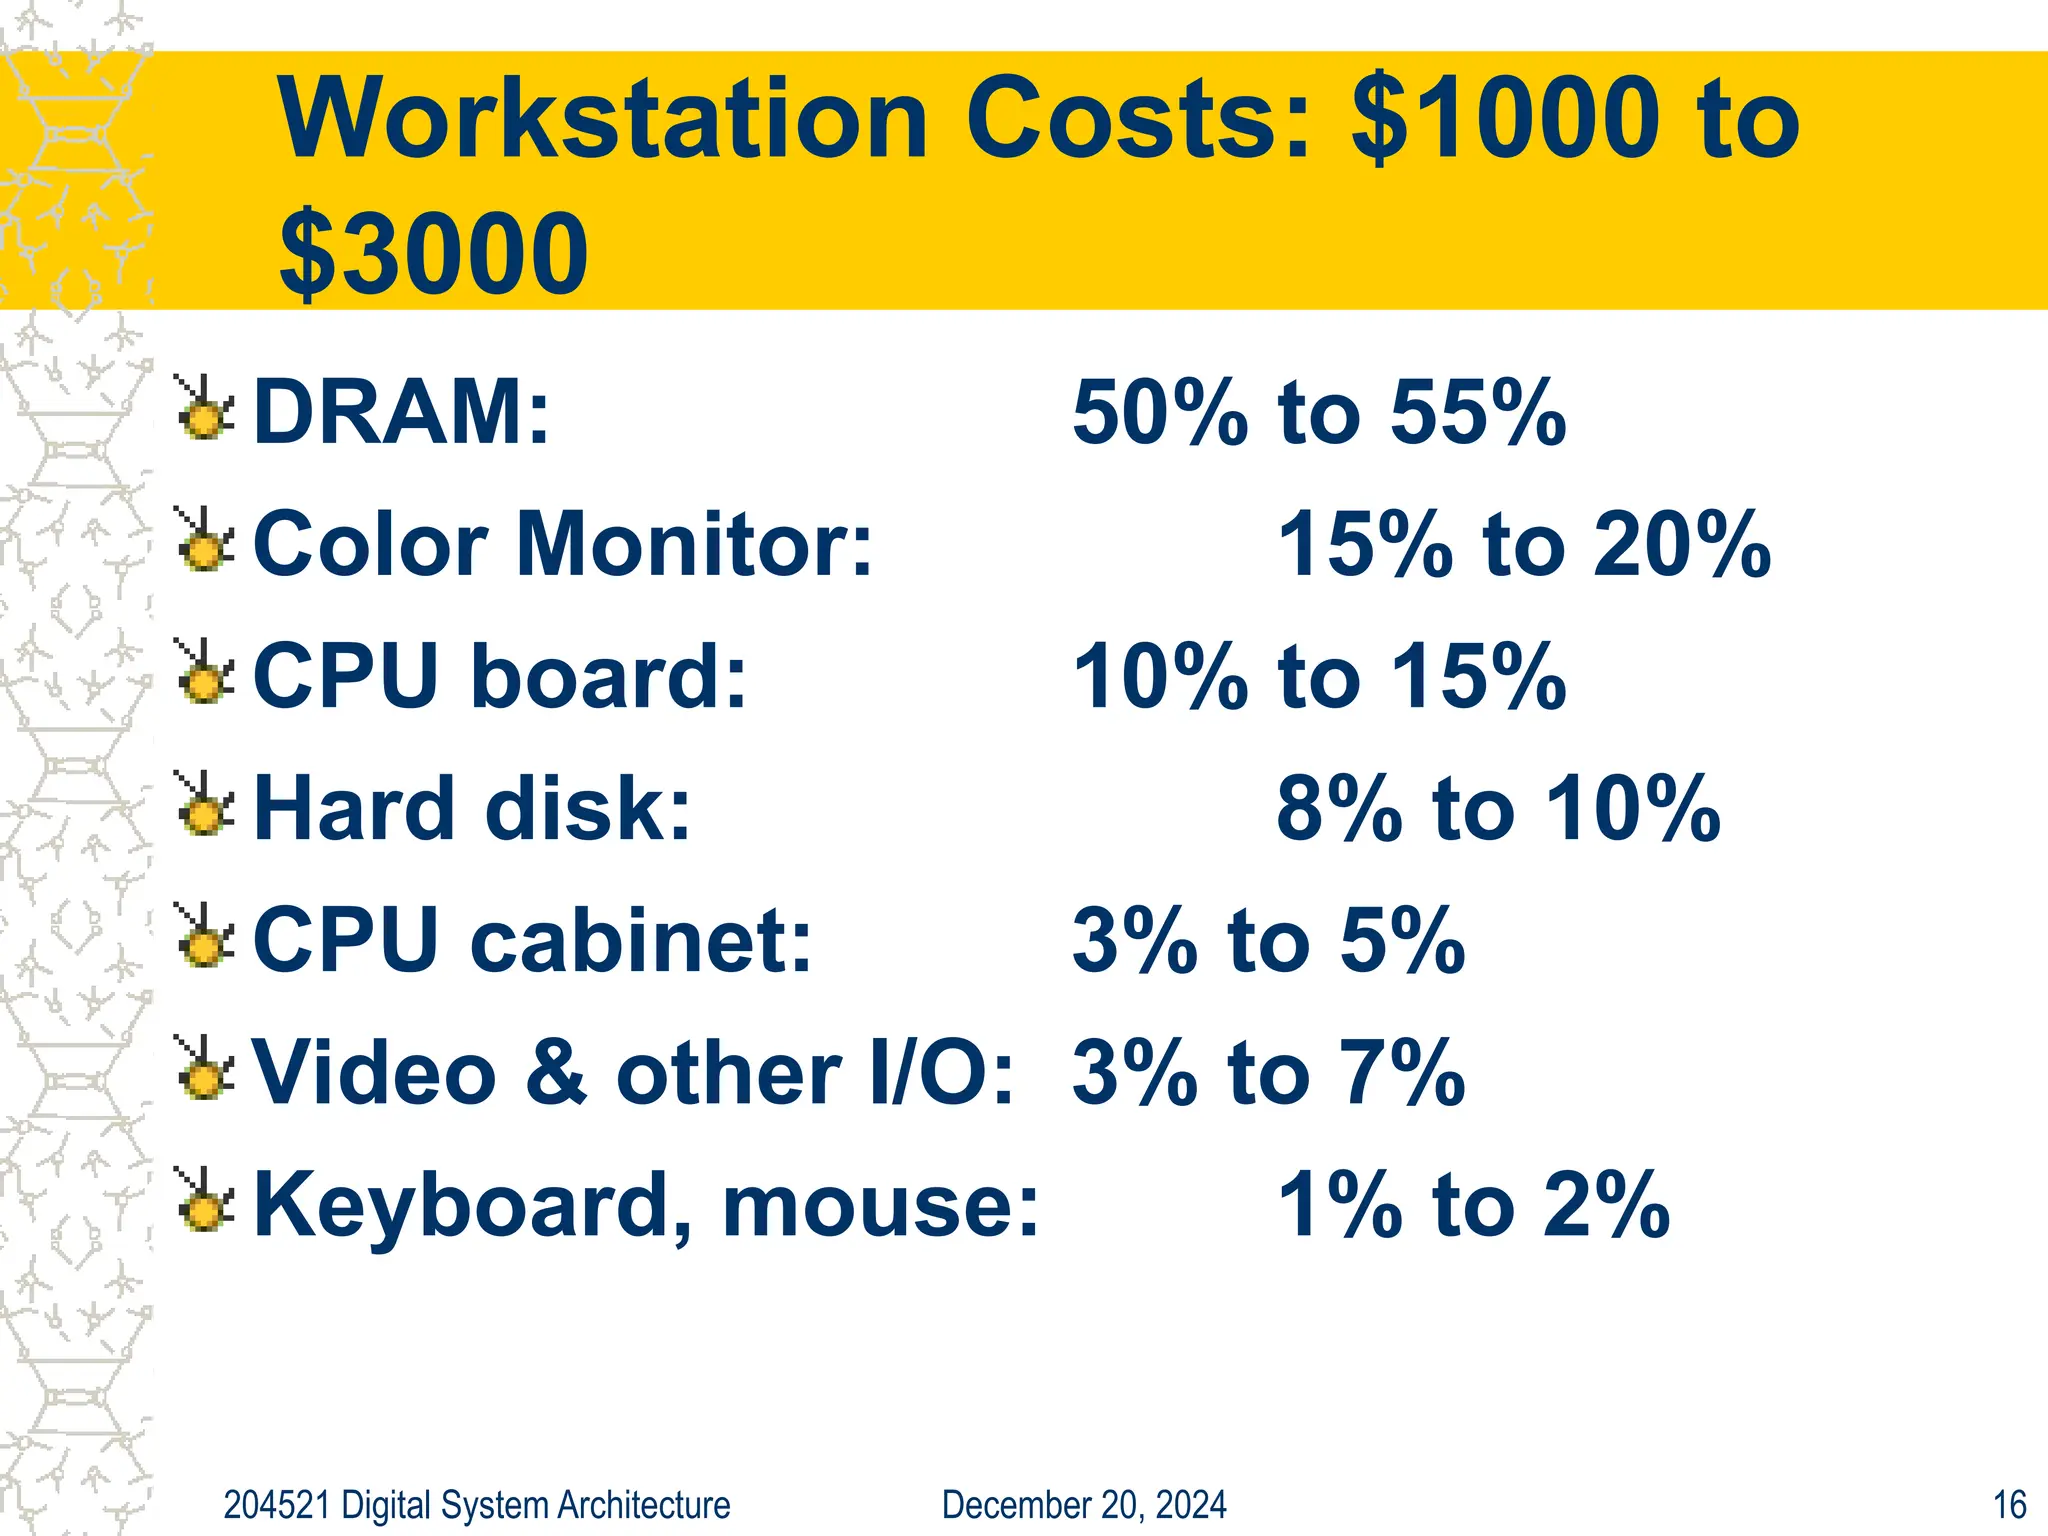
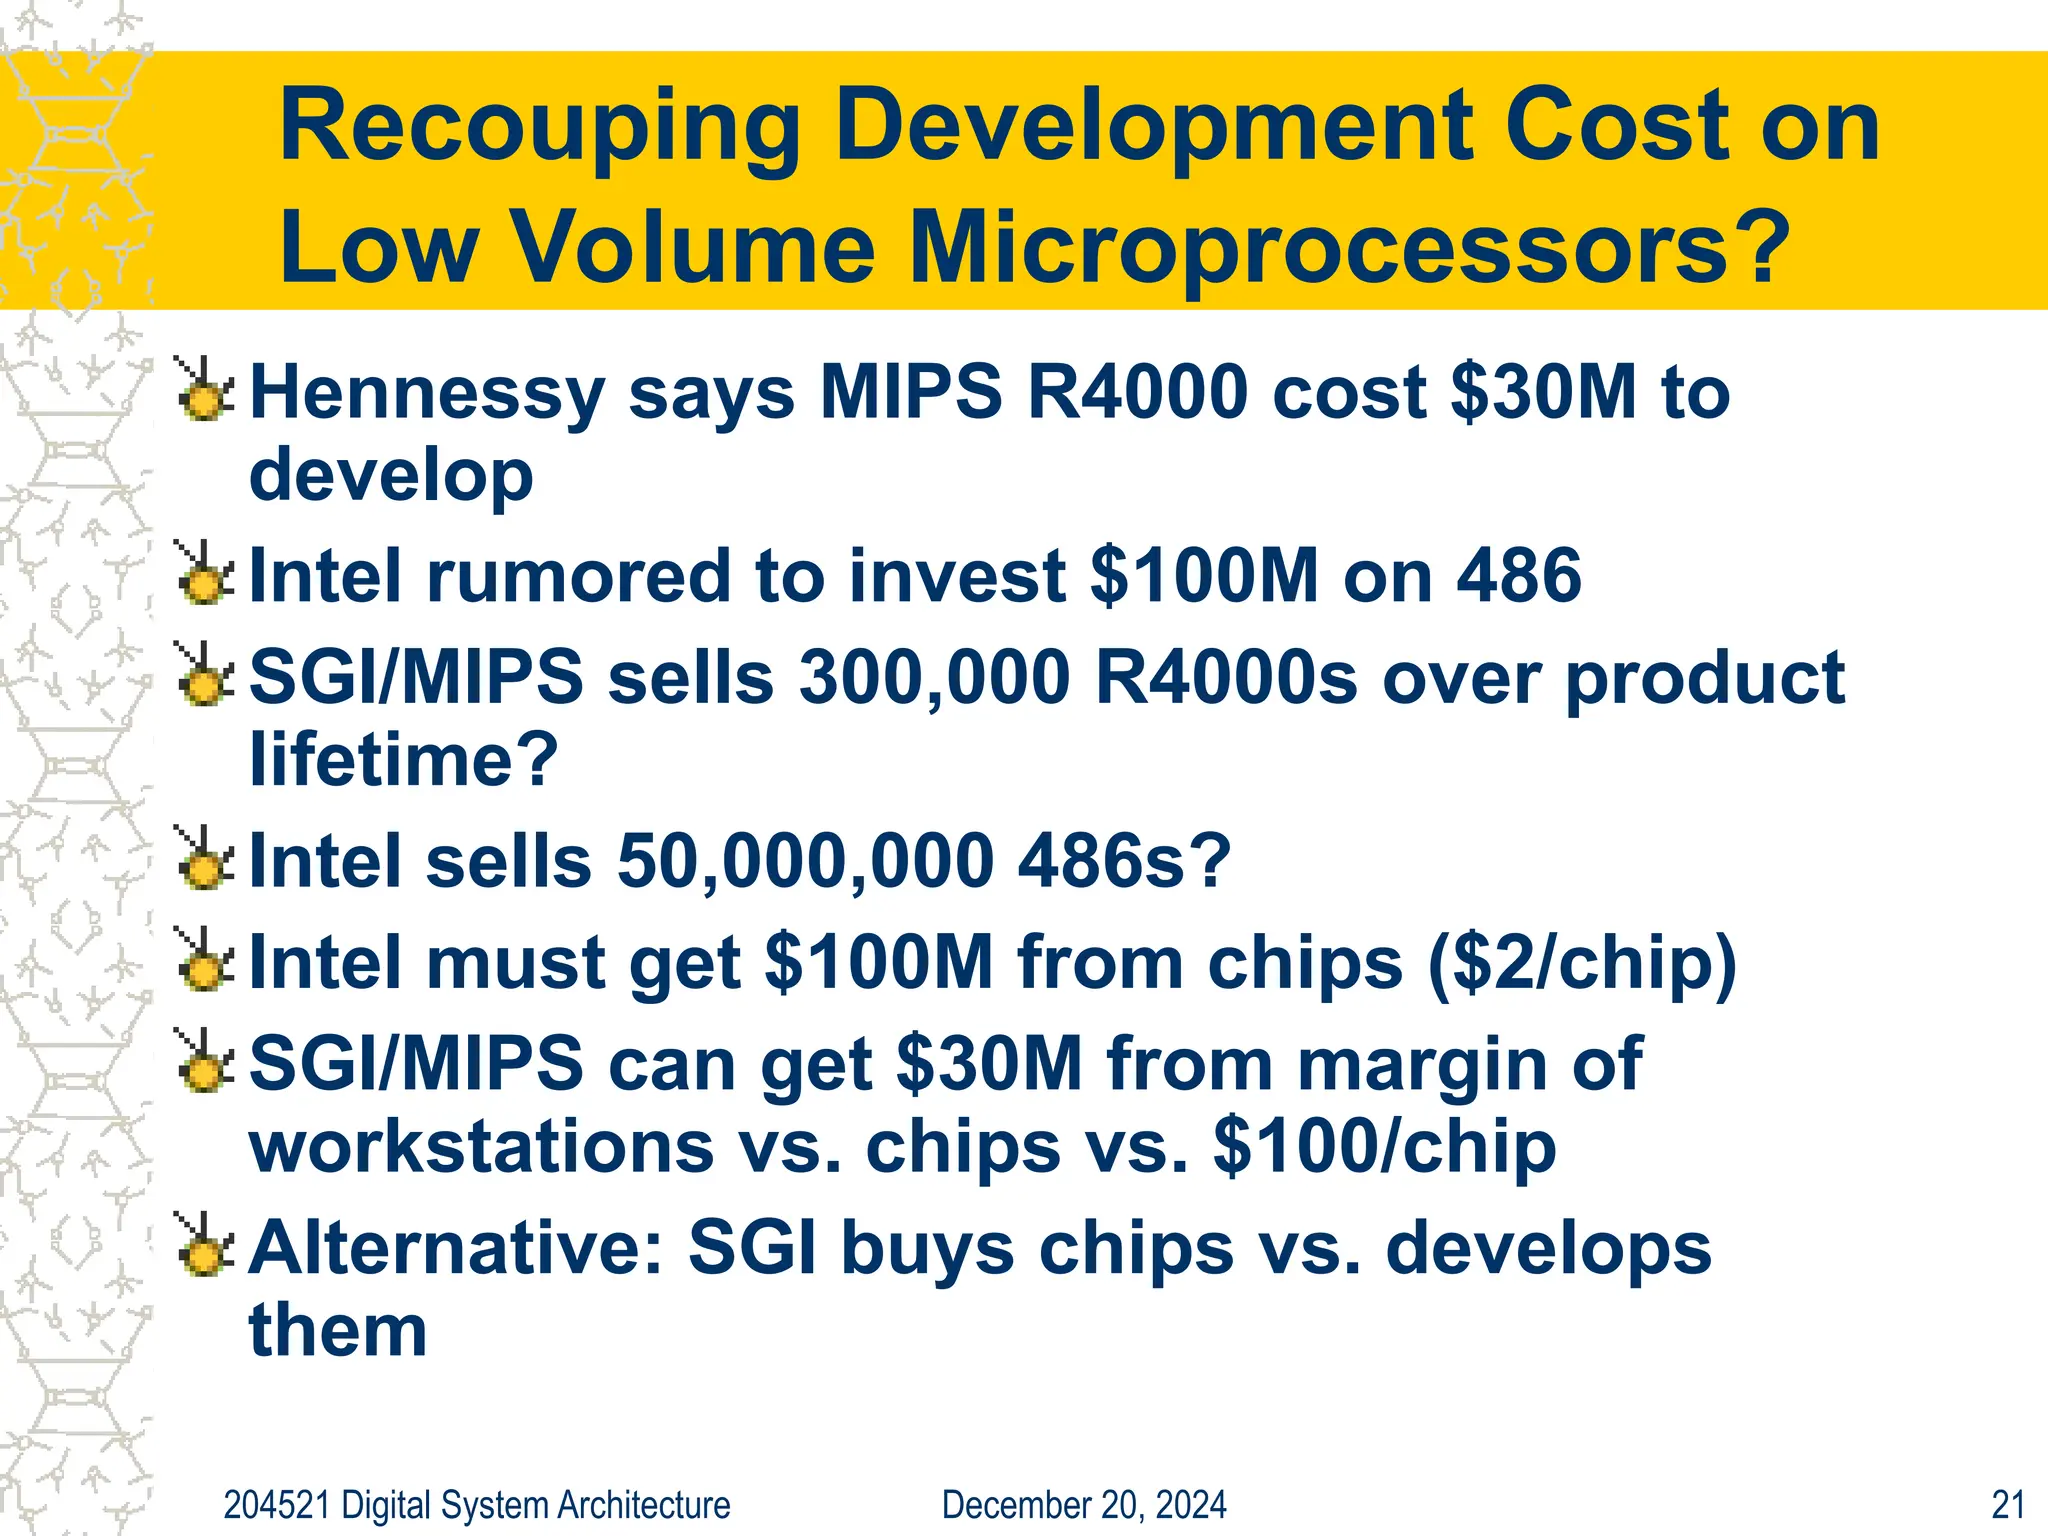
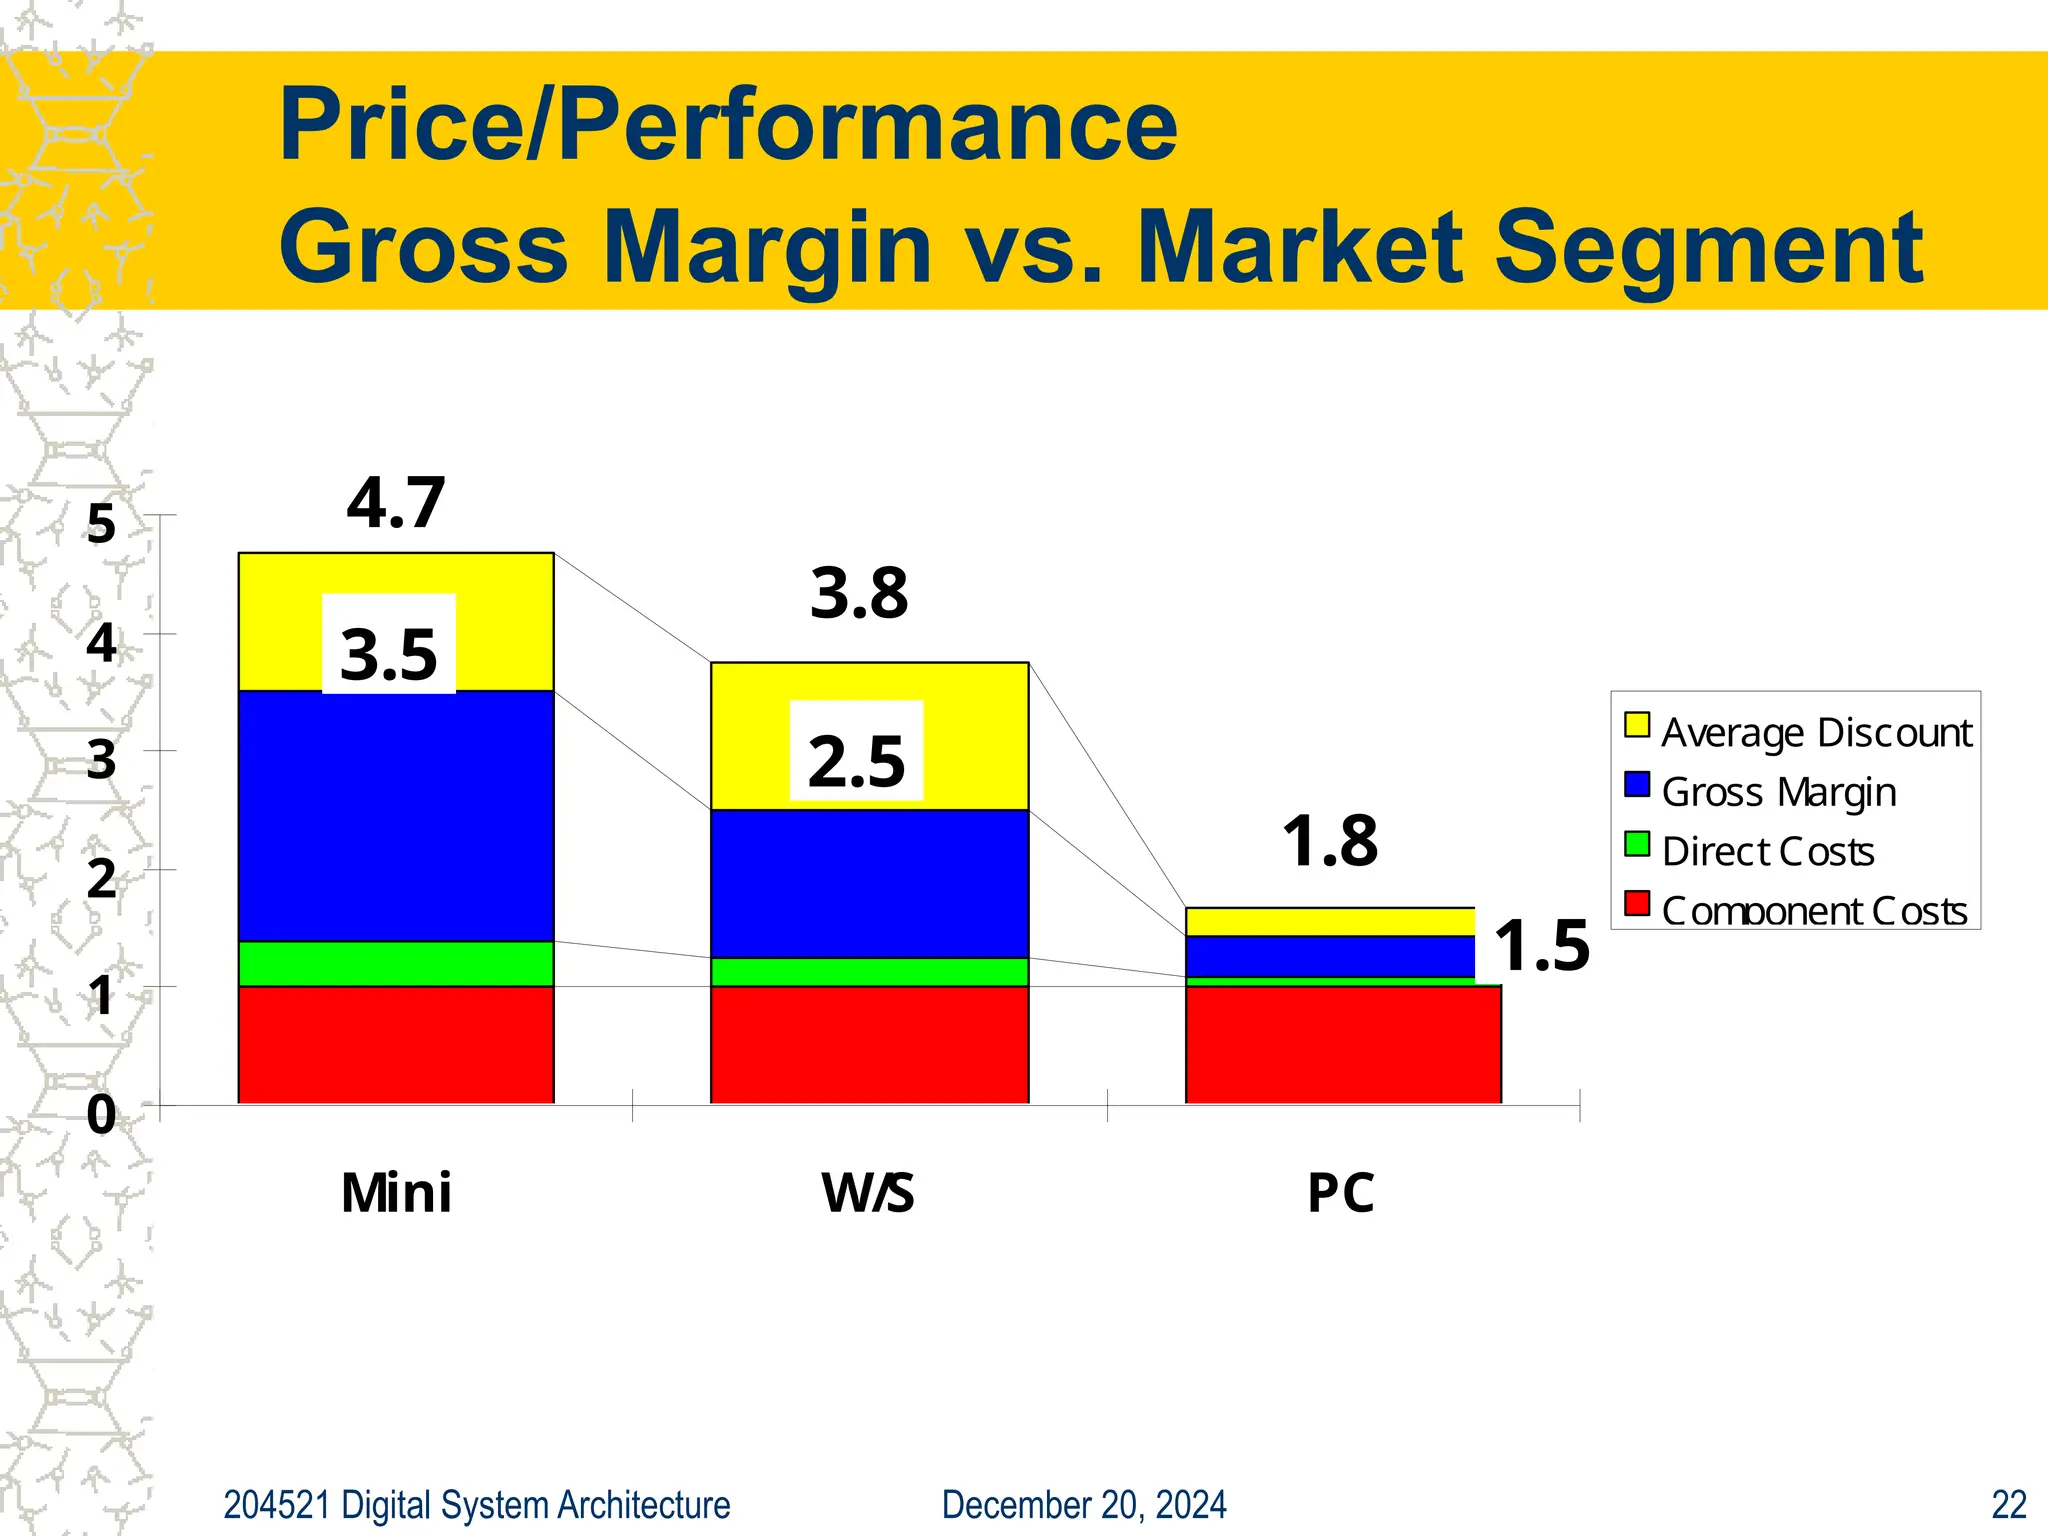
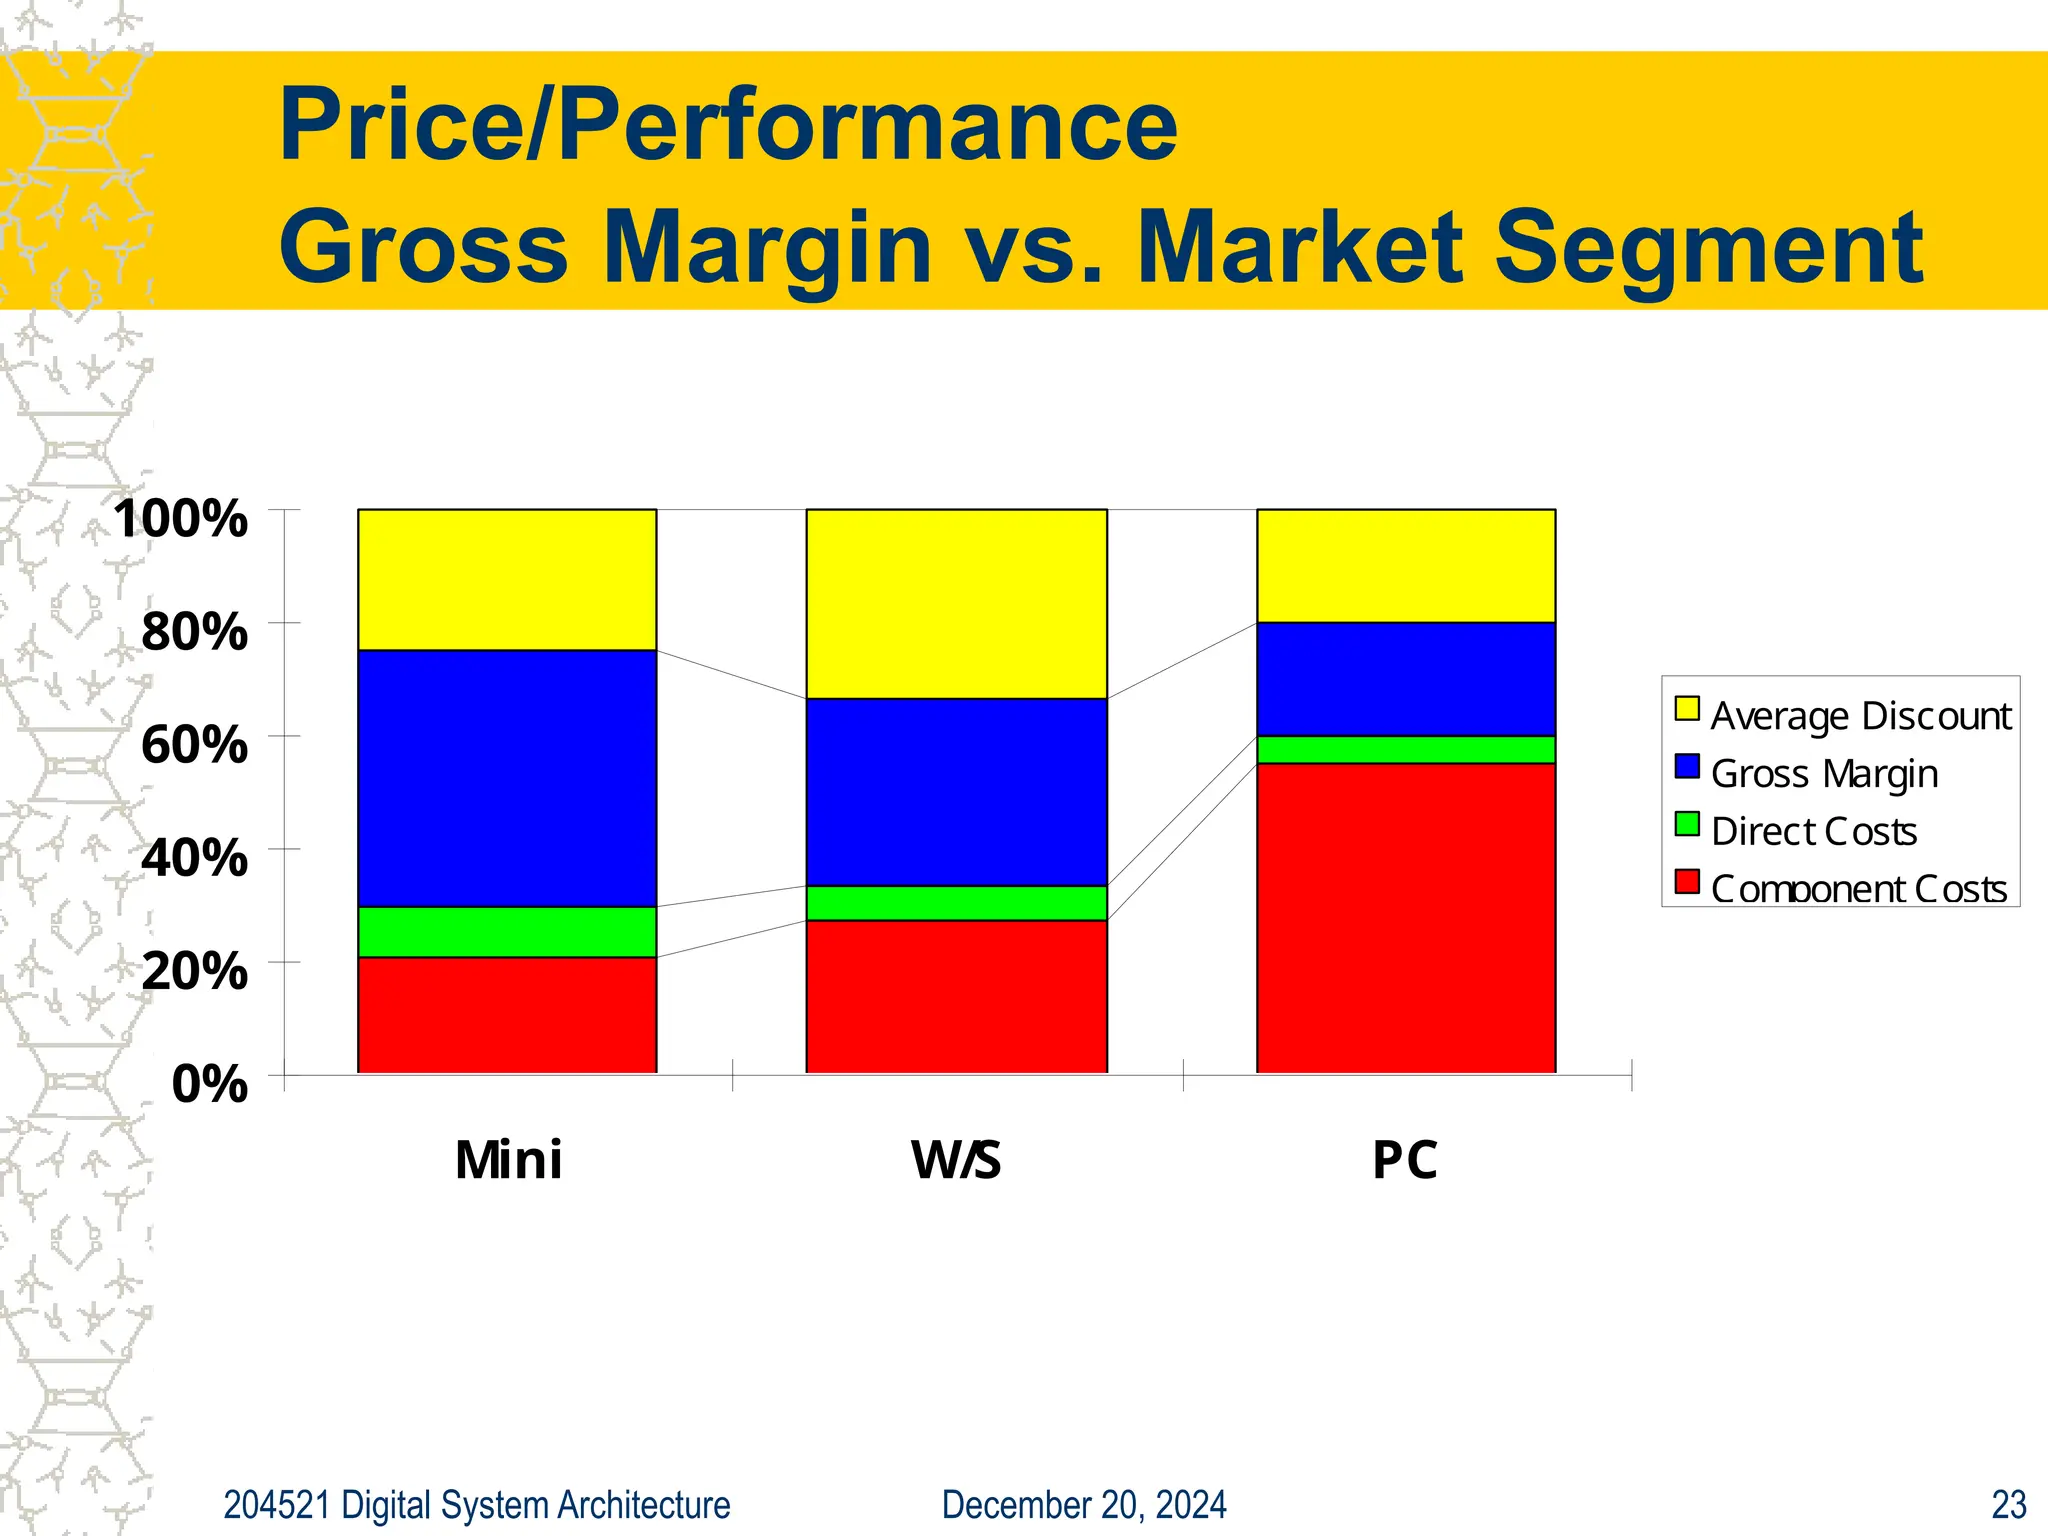
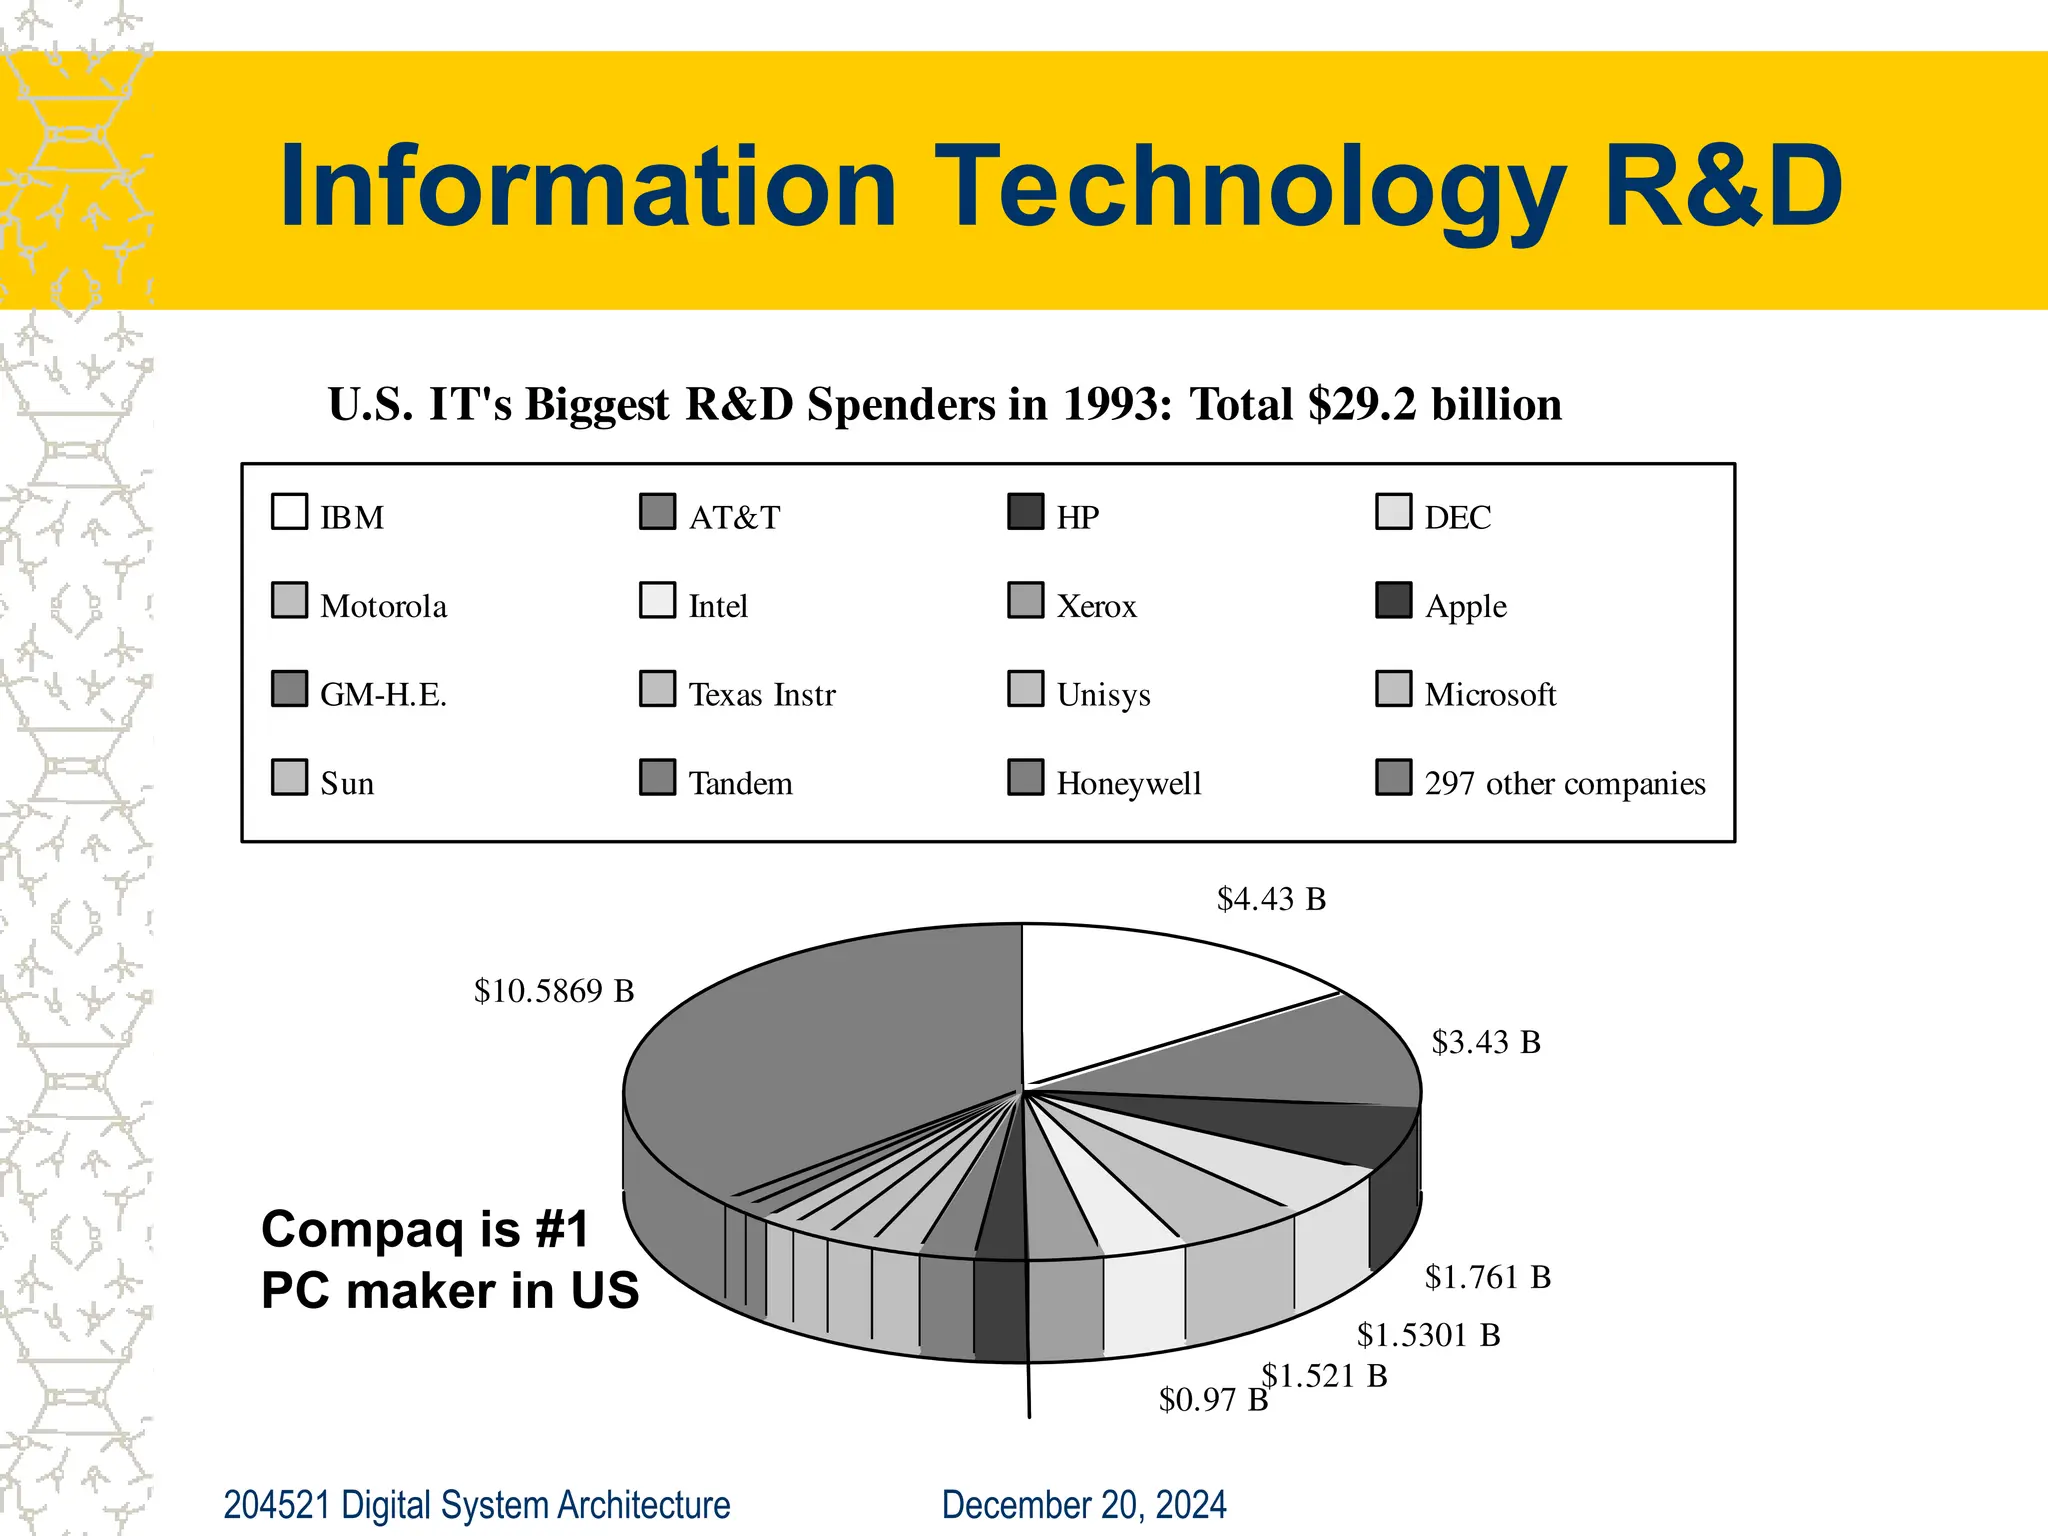
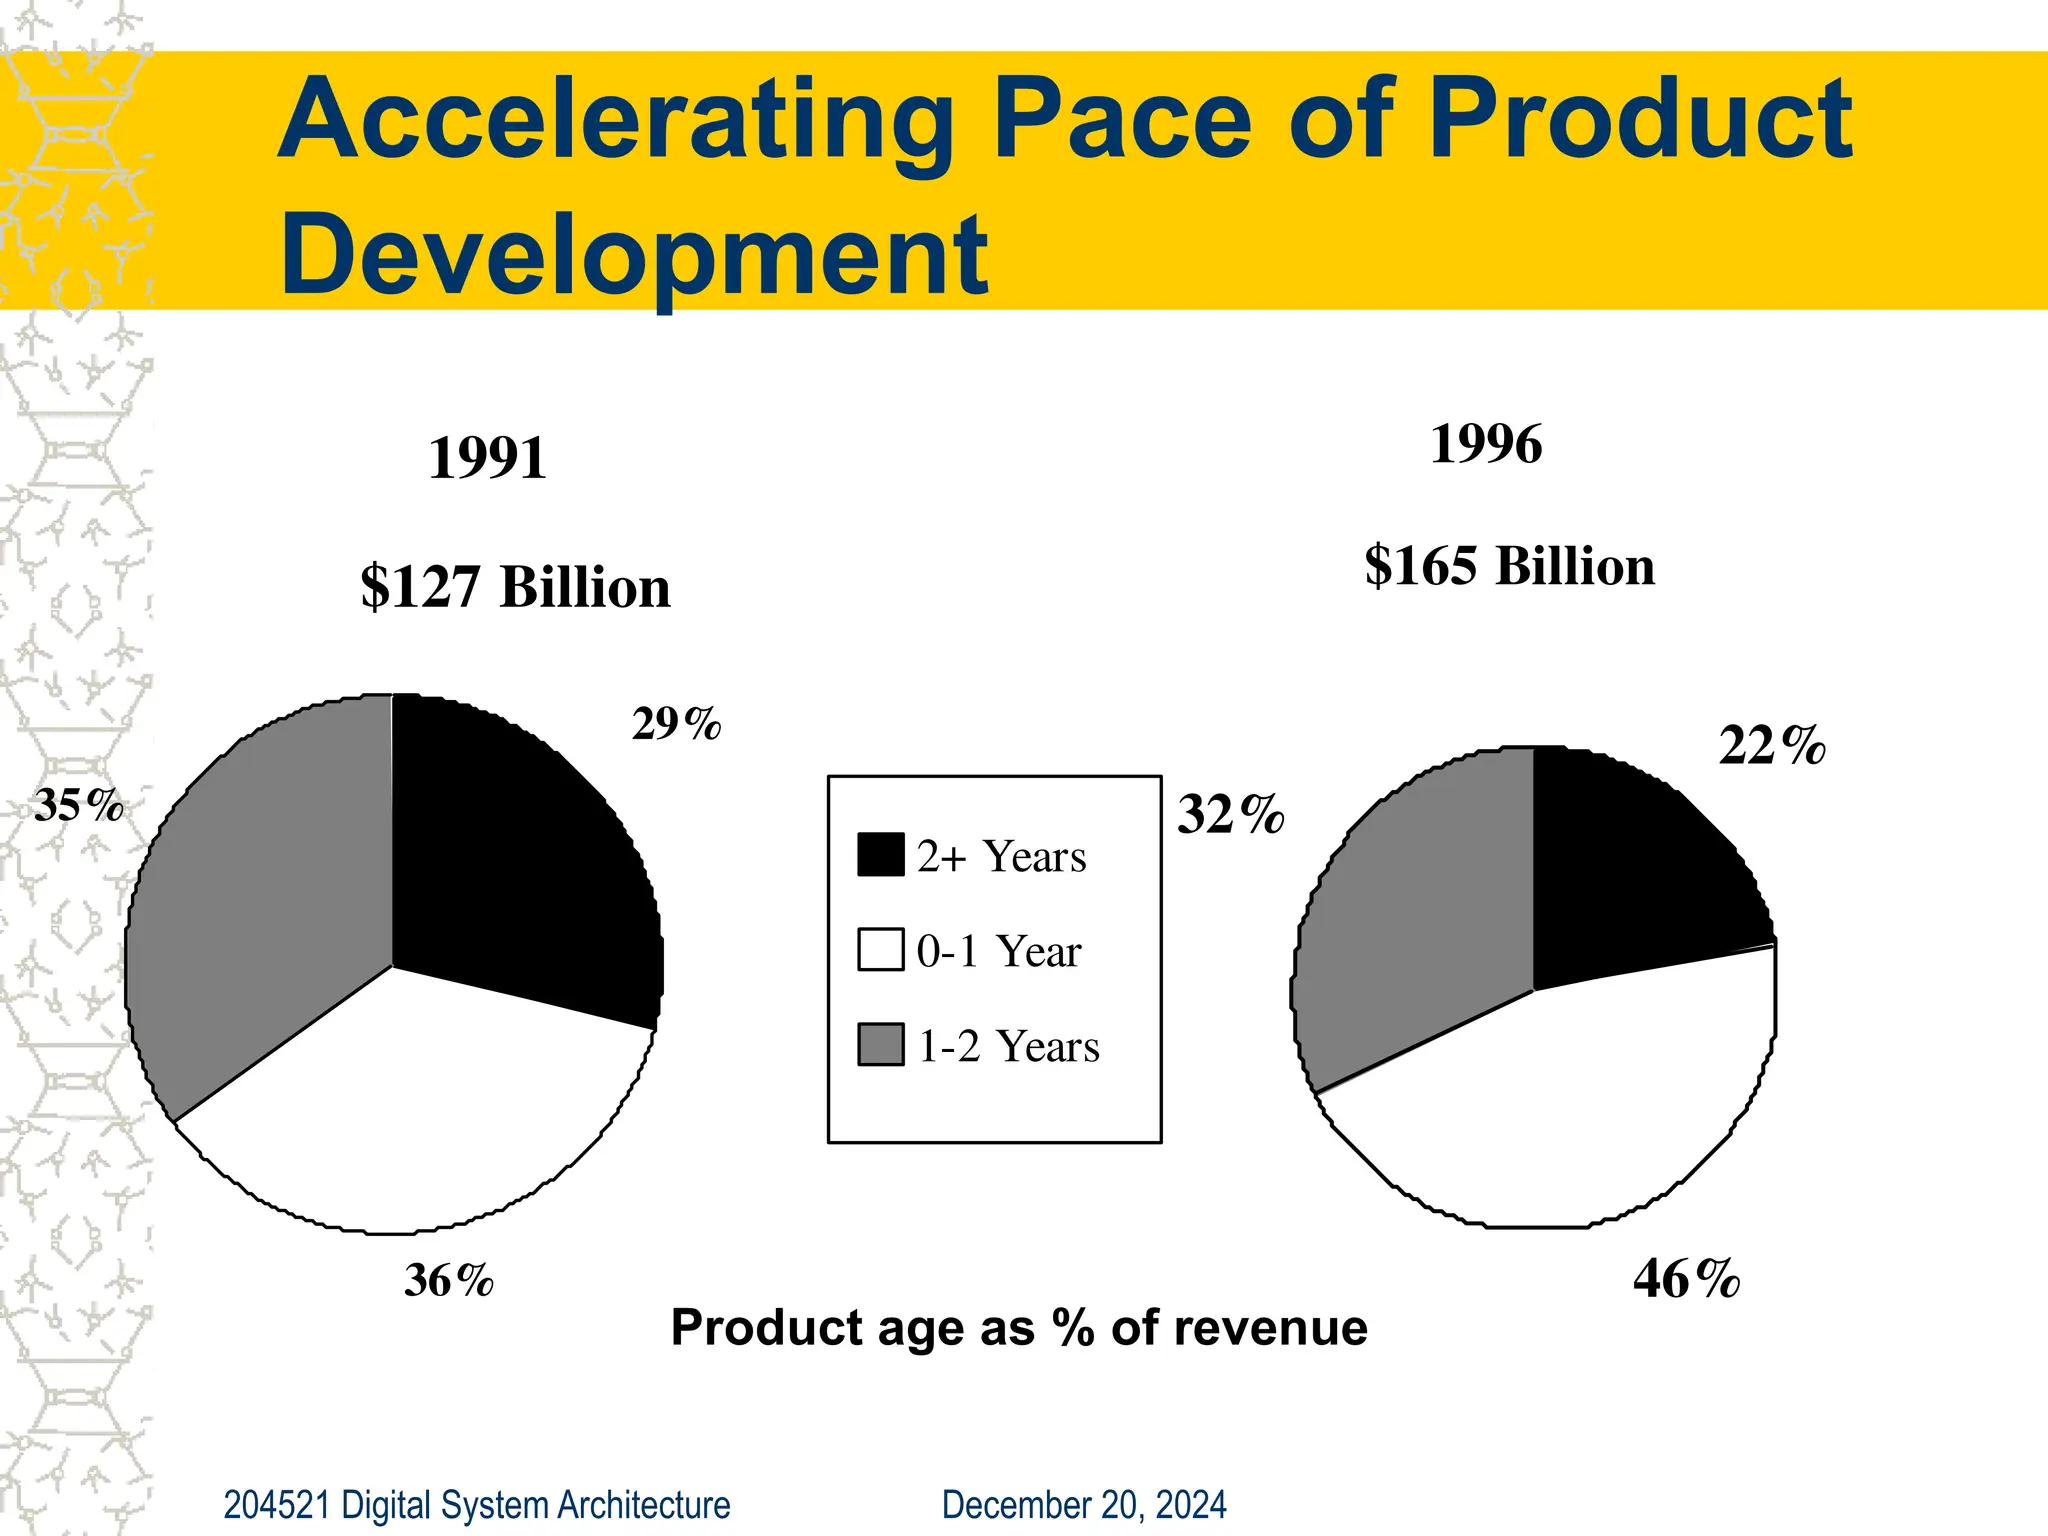
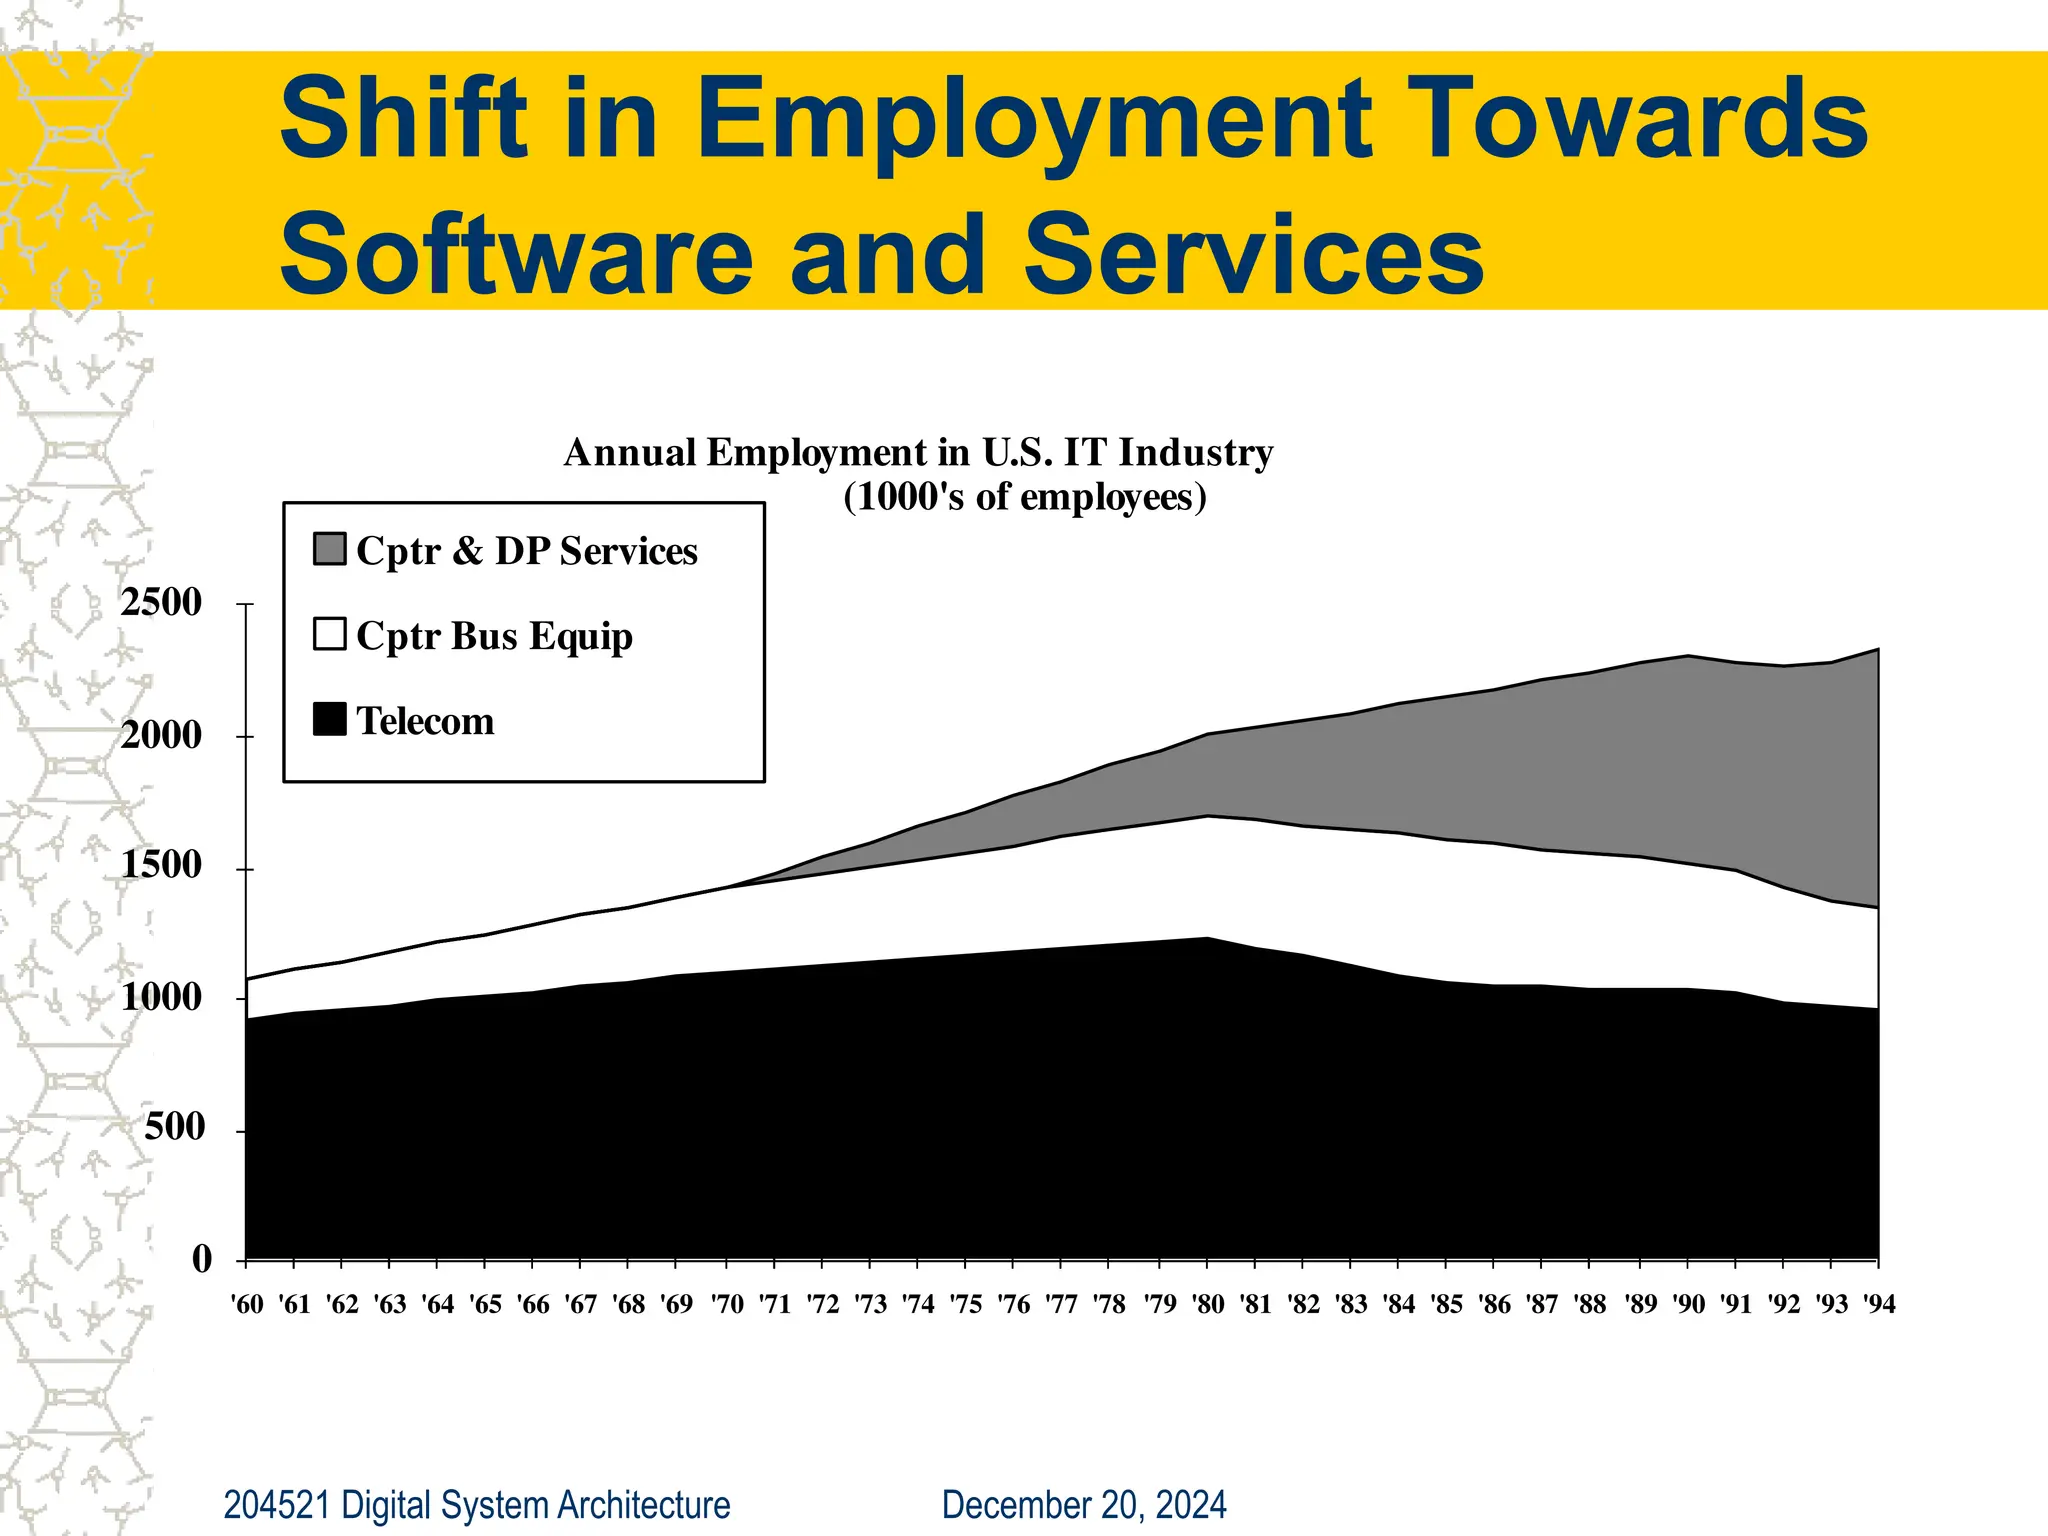
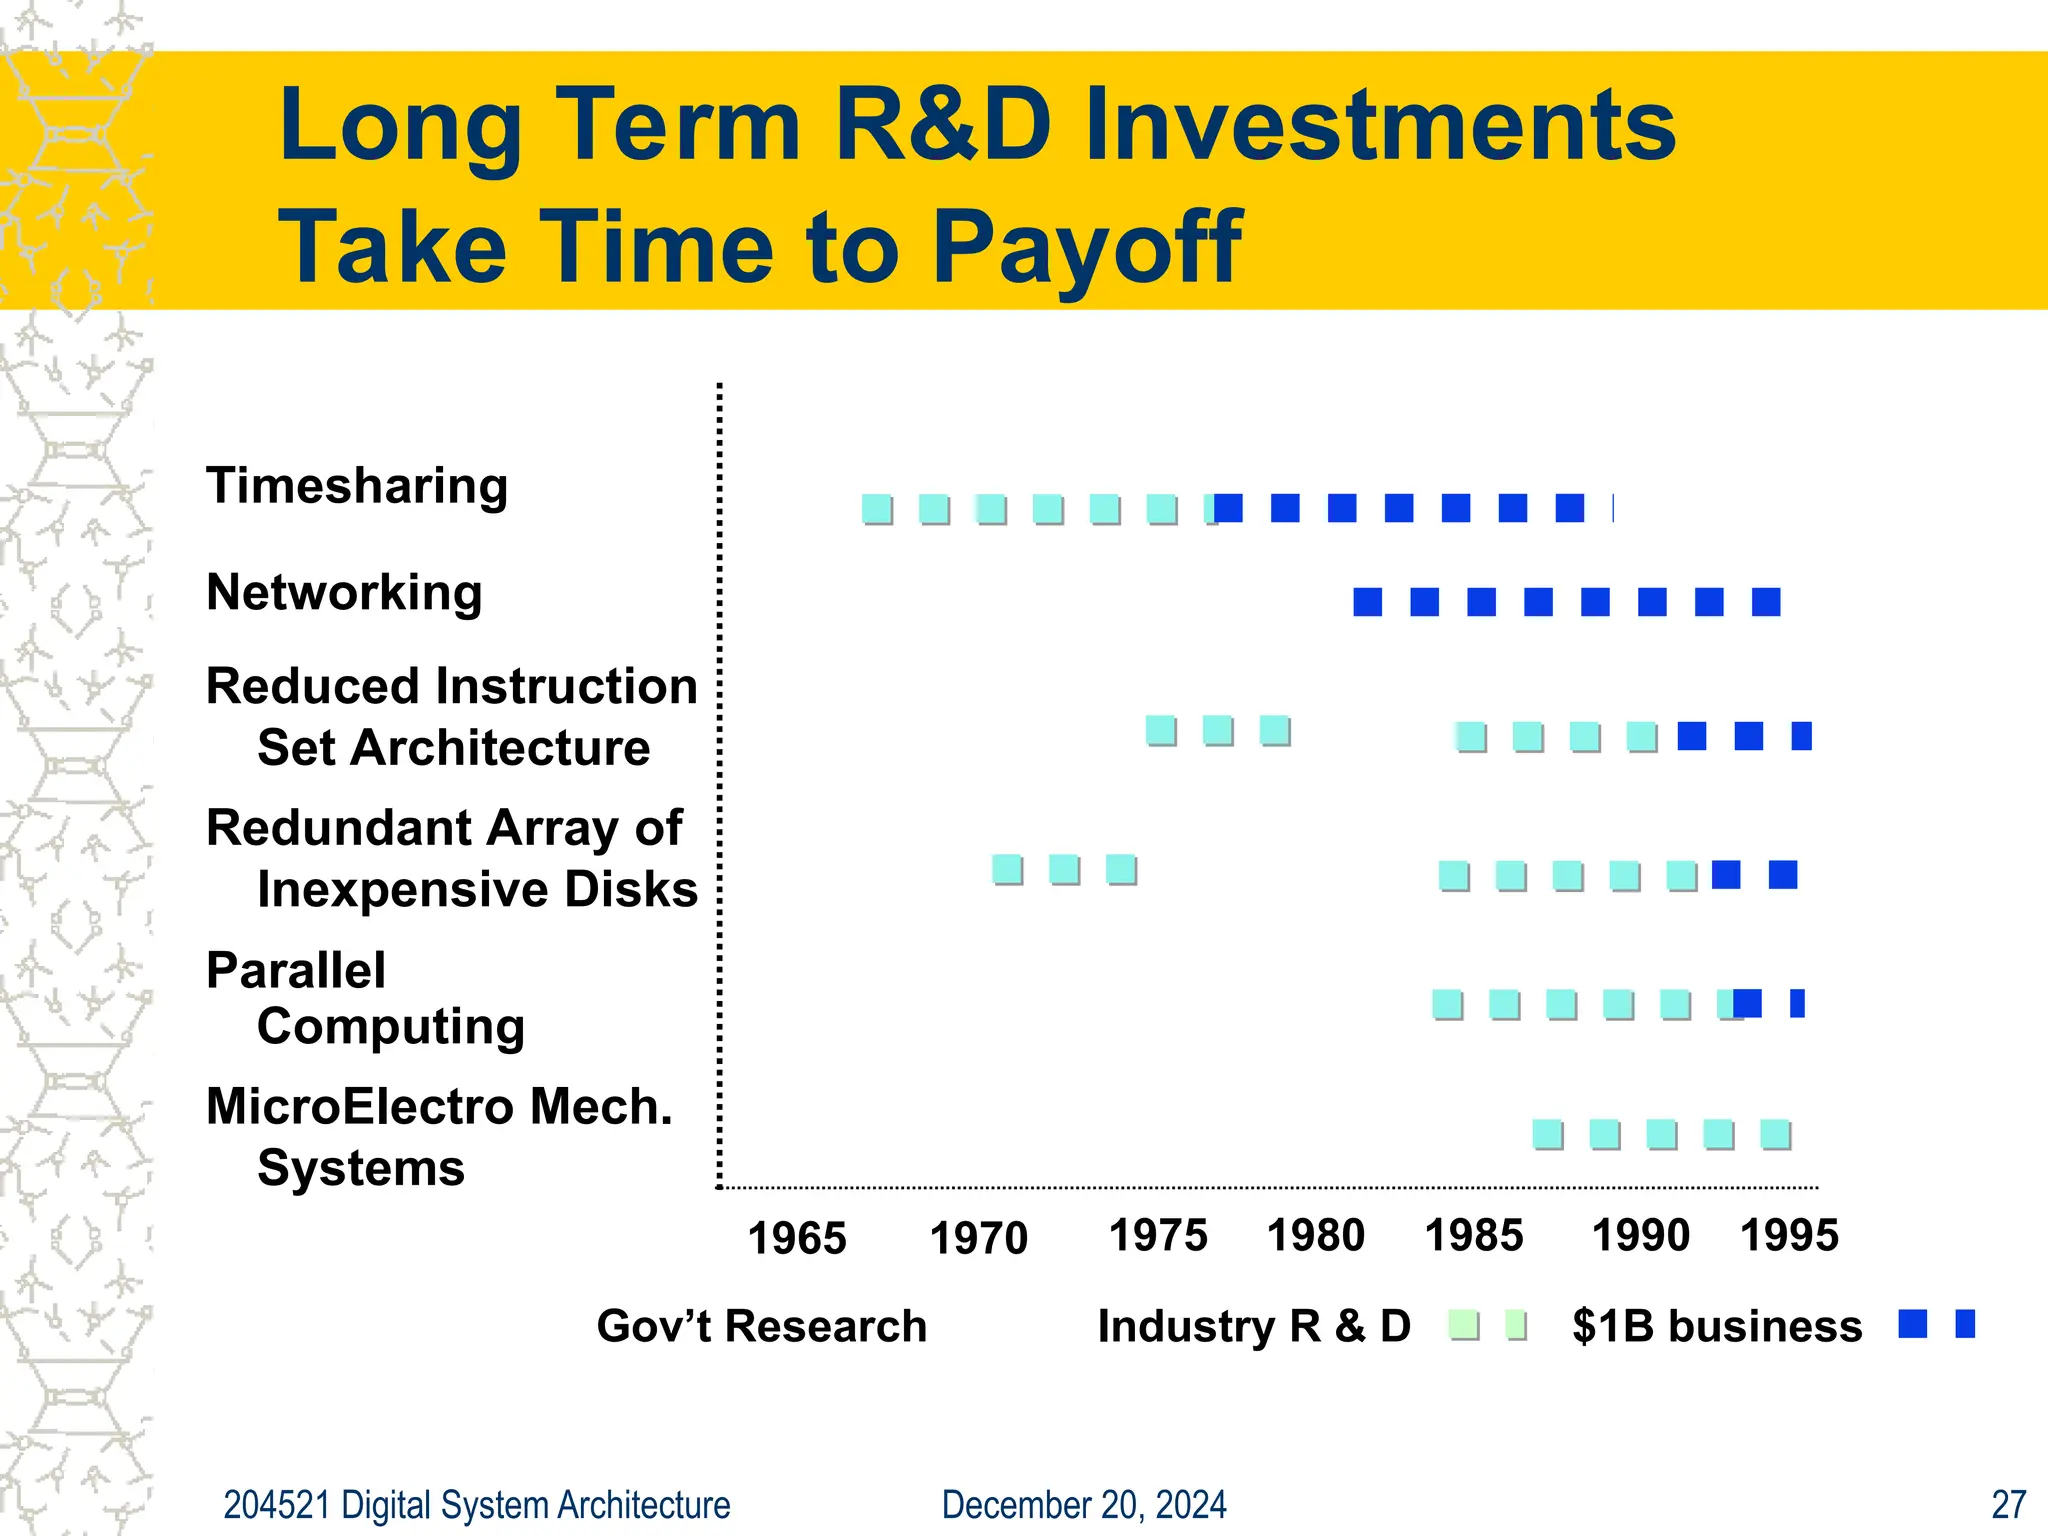
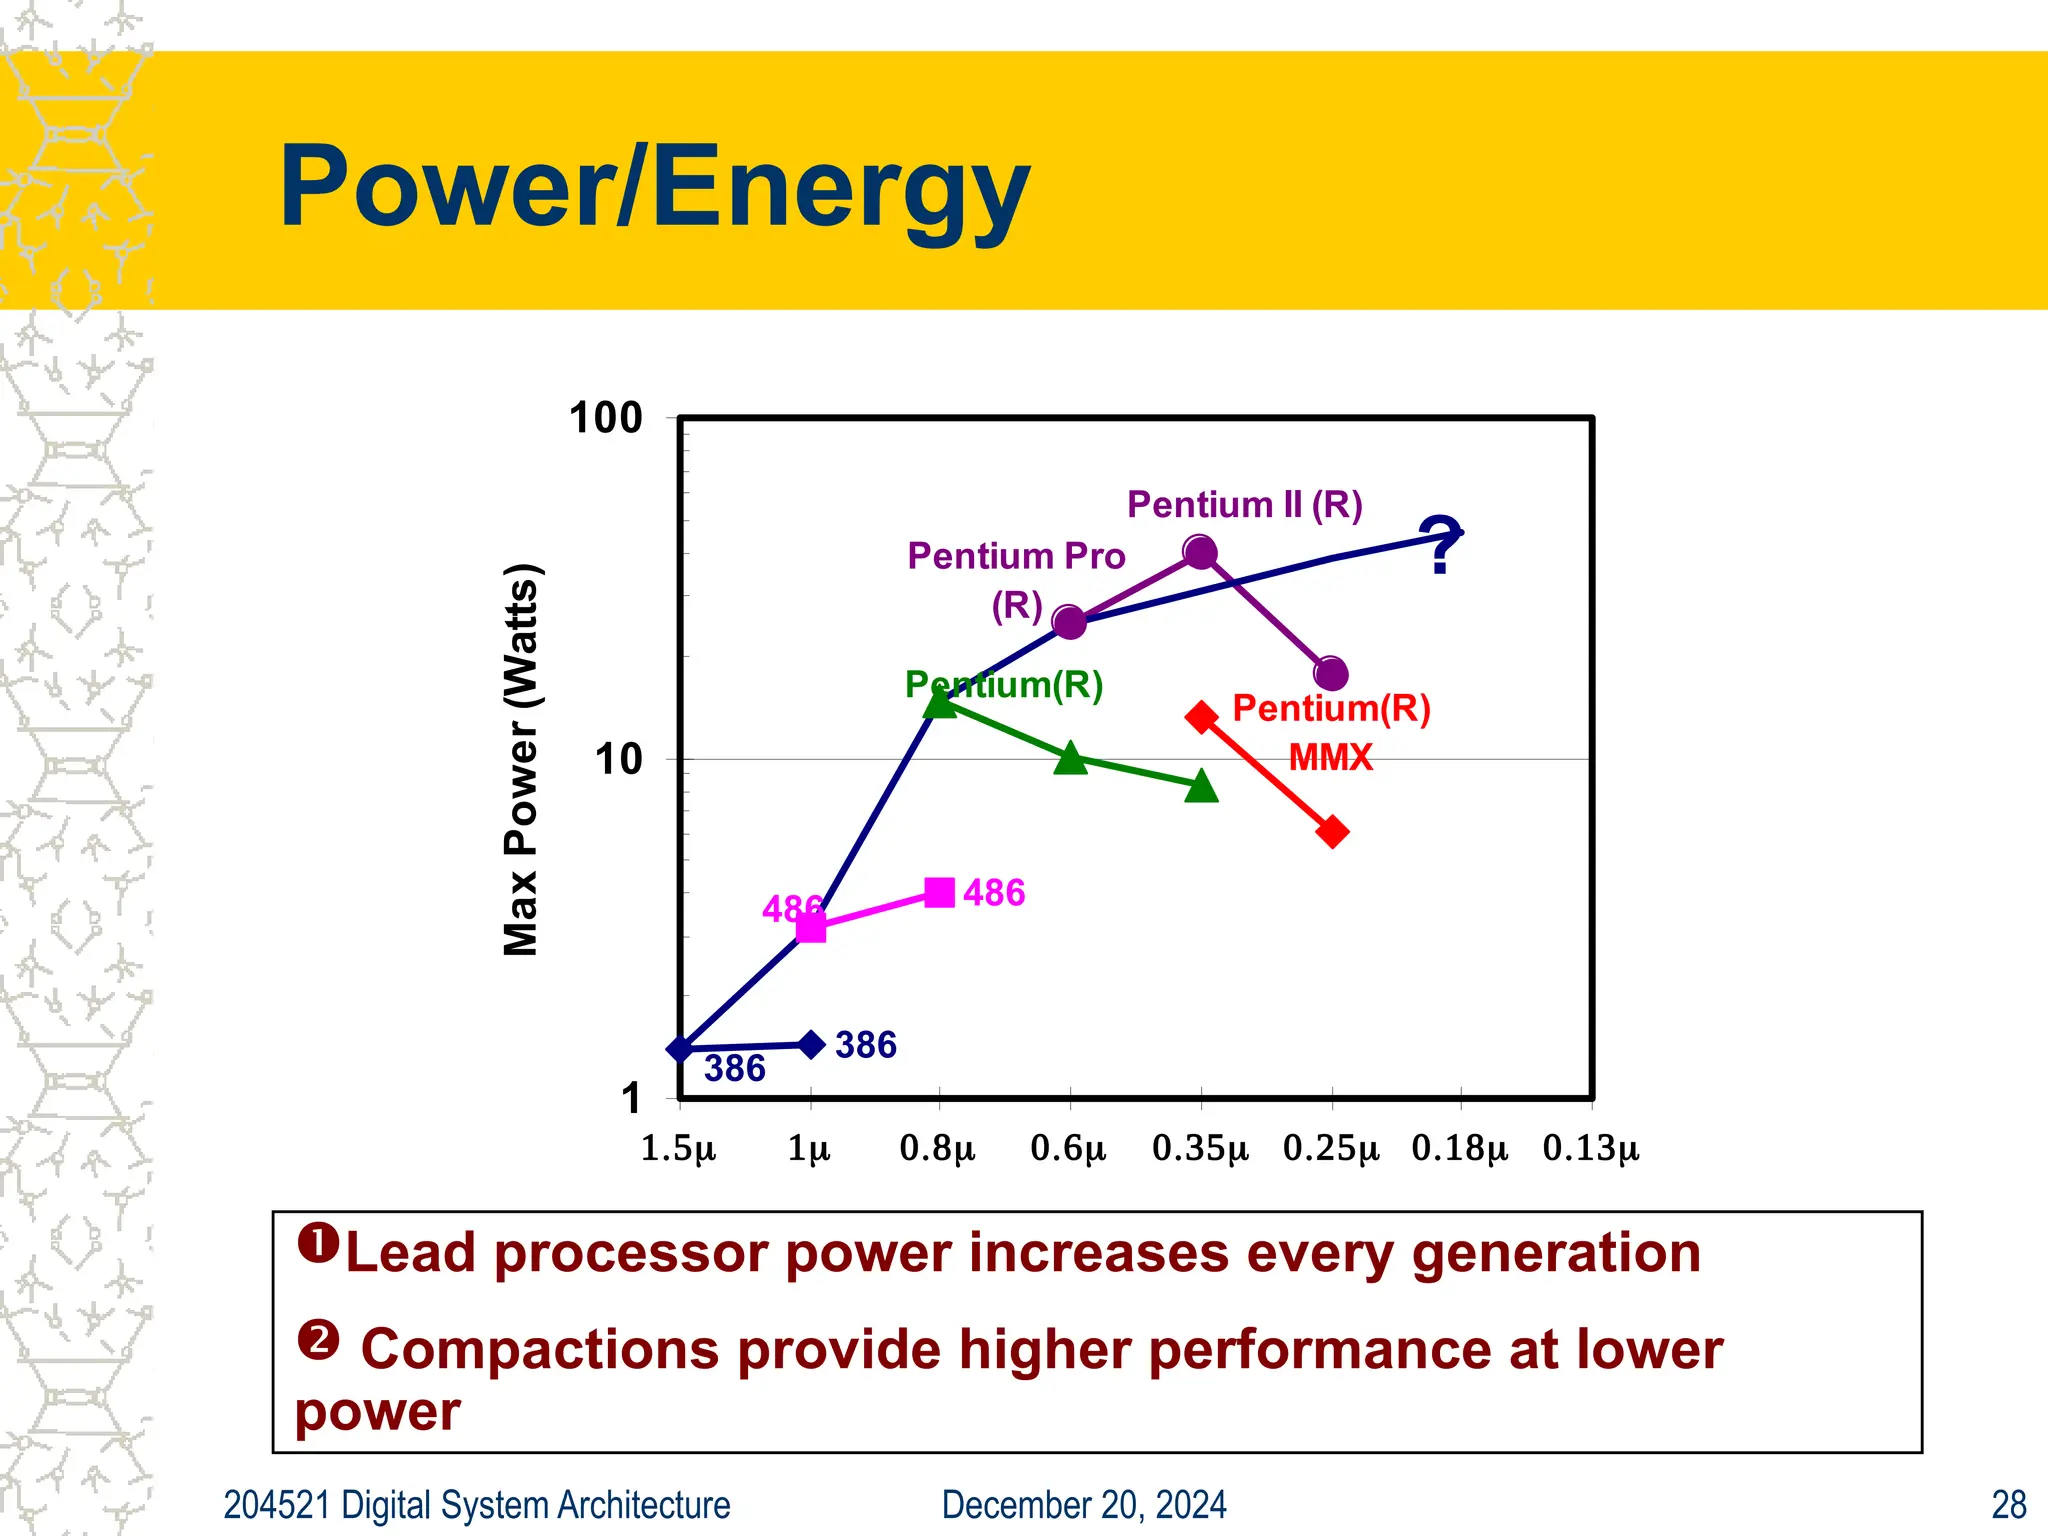
December 20, 2024
204521 Digital System Architecture
Cost, Price, and Price for
Performance
Pradondet Nilagupta
Spring 2001
(original notes from Randy Katz, UC
Berkeley)
December 20, 2024
204521 Digital System Architecture 2
Review From Last Time (1/2)
Given sales a function of performance
relative to competition, tremendous
investment in improving product as reported
by performance summary
Good products created when have:
– Good benchmarks
– Good ways to summarize performance
If benchmarks/summary inadequate, then
choice between improving product for real
programs vs. improving product to get more
sales;
December 20, 2024
204521 Digital System Architecture 3
Review From Last Time (2/2)
Execution time is the REAL measure
of computer performance!
What about cost?
December 20, 2024
204521 Digital System Architecture 4
Integrated Circuits
December 20, 2024
204521 Digital System Architecture 5
Integrated Circuits Costs (1/3)
Yield
Test
Final
cost
Packaging
cost
Testing
cost
Die
cost
IC



Yield
Die
*
Wafer
per
Dies
cost
Wafer
cost
Die 
December 20, 2024
204521 Digital System Architecture 6
Integrated Circuits Costs (2/3)
TestDie
Area
Die
*
2
Wafer_diam
*
Area
Die
m/2)
(Wafer_dia
*
wafer
Die
2
















Area
Die
*
Area)
t
Defect/Uni
1
*
Yield
Wafer
DieYield
(
December 20, 2024
204521 Digital System Architecture 7
Integrated Circuits Costs (3/3)
Defect per unit area (0.6 to 1.2), Fabrication
complexity: a (about 3)
 is a parameter that correspond to the number of
masking level (roughly 3 for CMOS)
For Advanced Processes:
Die Cost goes roughly with die area4
December 20, 2024
204521 Digital System Architecture 8
Real World Example
Chip Metal
Layer
Line
Width
Wafer
Cost
Defect
/Cm2
Area
mm2
Dies/
Wafer
Yield Die Cost
386DX 2 0.90 $900 1.0 43 360 71% $4
486DX2 3 0.80 $1200 1.0 81 181 54% $12
PowerPC 601 4 0.80 $1700 1.3 121 115 28% $53
HP PA 7100 3 0.80 $1300 1.0 196 66 27% $73
DEC Alpha 3 0.70 $1500 1.2 234 53 19% $149
Super SPARC 3 0.70 $1700 1.6 256 48 13% $272
Pentium 3 0.80 $1500 1.5 296 40 9% $417
From "Estimating IC Manufacturing Costs,”
by Linley Gwennap, Microprocessor Report, August 2, 1993, p. 15
December 20, 2024
204521 Digital System Architecture 9
Other Cost
Chip Die
Cost
pin Package
Type
Cost Test &
Assembly
Total
386DX $4 132 QFP $1 $4 $9
486DX2 $12 168 PGA $11 $12 $35
PowerPC 601 $53 304 QFP $3 $21 $77
HP PA 7100 $73 504 PGA $35 $16 $124
DEC Alpha $149 431 PGA $30 $23 $202
Super SPARC $272 293 PGA $20 $34 $326
Pentium $417 273 PGA $19 $37 $473
Yield
Die
Time
Test
Ave.
*
Cost
Test
Cost
Test
Die 
Packaging Cost: depends on pins, heat dissipation, appearance, ...
December 20, 2024
204521 Digital System Architecture
Cost/Performance
What is Relationship of Cost to Price?
Component Costs
Component Cost
List Price
15% to 33%
December 20, 2024
204521 Digital System Architecture
Cost/Performance
What is Relationship of Cost to Price?
Component Costs
Direct Costs (add 25% to 40%) recurring costs: labor, purchasing,
scrap, warranty
Component Cost
Direct Cost
List Price
15% to 33%
6% to 8%
December 20, 2024
204521 Digital System Architecture
Cost/Performance
What is Relationship of Cost to Price?
Component Costs
Direct Costs (add 25% to 40%) recurring costs: labor, purchasing,
scrap, warranty
Gross Margin (add 82% to 186%) nonrecurring costs: R&D,
marketing, sales, equipment maintenance, rental, financing cost,
pretax profits, taxes
Component Cost
Direct Cost
Gross Margin
List Price
15% to 33%
6% to 8%
34% to 39%
December 20, 2024
204521 Digital System Architecture
Cost/Performance
What is Relationship of Cost to Price?
Component Costs
Direct Costs (add 25% to 40%) recurring costs: labor, purchasing,
scrap, warranty
Gross Margin (add 82% to 186%) nonrecurring costs: R&D,
marketing, sales, equipment maintenance, rental, financing cost,
pretax profits, taxes
Average Discount to get List Price (add 33% to 66%): volume
discounts and/or retailer markup
Component
Cost
Direct Cost
Gross
Margin
Average
Discount
Avg. Selling Price
List Price
15% to 33%
6% to 8%
34% to 39%
25% to 40%
December 20, 2024
204521 Digital System Architecture
Assume purchase 10,000 units
Chip Prices (August 1993)
Chip Area Mfg. Price Multi- Comment
mm2
cost plier
386DX 43 $9 $31 3.4 Intense Competition
Intense Competition
486DX2 81 $35 $245 7.0 No Competition
No Competition
PowerPC 601 121 $77 $280 3.6
DEC Alpha 234 $202 $1231 6.1 Recoup R&D?
Pentium 296 $473 $965 2.0 Early in shipments
December 20, 2024
204521 Digital System Architecture 15
Chip Prices (August 1993)
Assume purchase 10,000 units
Chip Area Mfg. Price Multi- Comment
mm2
cost plier
386DX 43 $9 $31 3.4 Intense
Competition
486DX2 81 $35 $245 7.0 No Competition
PowerPC 601 121 $77 $280 3.6
DEC Alpha 234 $202 $1231 6.1 Recoup R&D?
Pentium 296 $473 $965 2.0 Early in shipments
December 20, 2024
204521 Digital System Architecture 16
Workstation Costs: $1000 to
$3000
DRAM: 50% to 55%
Color Monitor: 15% to 20%
CPU board: 10% to 15%
Hard disk: 8% to 10%
CPU cabinet: 3% to 5%
Video & other I/O: 3% to 7%
Keyboard, mouse: 1% to 2%
December 20, 2024
204521 Digital System Architecture
Learning Curve
Years
production costs
volume
time to introduce
new product
December 20, 2024
204521 Digital System Architecture 18
Volume vs. Cost
Rule of thumb on applying learning curve to man
ufacturing:
“When volume doubles, costs reduce 10%”
A DEC View of Computer Engineering by C. G.
Bell, J. C. Mudge, and J. E. McNamara, Digital
Press, Bedford, MA., 1978.
40 MPPs @ 200 nodes = 8,000 nodes/year
vs. 100,000 Workstations/year
2X
= (100,000/8,000) => x = 3.6
Since doubling value reduces cost by 10%, costs
reduces to (0.9)3.6
= 0.68
of the original price (about 1/3 less expensive).
December 20, 2024
204521 Digital System Architecture 19
Volume vs. Cost: PCs vs.
Workstations
1990 1992 1994 1997
PC 23,880,898 33,547,589 44,006,000 65,480,000
WS 407,624 584,544 679,320 978,585
Ratio 59 57 65 67
2x
= 65 => X = 6.0 and (0.9)6.0
= 0.53
ญ PC costs are 47% less than workstation costs for whole
market.
Single company: 20% WS market vs. 10% PC market
Ratio 29 29 32 33
2x
= 32 => X = 5.0 and (0.9)5.0
= 0.59
ญ PCs cost 41% less than workstations for single compan
y.
December 20, 2024
204521 Digital System Architecture 20
High Margins on High-End
Machines
R&D considered return on investment (ROI) ญ10%
– Every $1 R&D must generate $7 to $13 in sales
High end machines need more $ for R&D
Sell fewer high end machines
– Fewer to amortize R&D
– Much higher margins
Cost of 1 MB Memory (January 1994):
PC $40 (Mac Quadra)
WS $42 (SS-10)
Mainframe $1920 (IBM 3090)
Supercomputer $600 (M90 DRAM)
$1375 (C90 15 ns SRAM)
December 20, 2024
204521 Digital System Architecture 21
Recouping Development Cost on
Low Volume Microprocessors?
Hennessy says MIPS R4000 cost $30M to
develop
Intel rumored to invest $100M on 486
SGI/MIPS sells 300,000 R4000s over product
lifetime?
Intel sells 50,000,000 486s?
Intel must get $100M from chips ($2/chip)
SGI/MIPS can get $30M from margin of
workstations vs. chips vs. $100/chip
Alternative: SGI buys chips vs. develops
them
December 20, 2024
204521 Digital System Architecture 22
Price/Performance
Gross Margin vs. Market Segment
0
1
2
3
4
5
Mini W/S PC
Average Discount
Gross Margin
Direct Costs
Component Costs
4.7
3.8
1.8
3.5
2.5
1.5
December 20, 2024
204521 Digital System Architecture 23
Price/Performance
Gross Margin vs. Market Segment
0%
20%
40%
60%
80%
100%
Mini W/S PC
Average Discount
Gross Margin
Direct Costs
Component Costs
December 20, 2024
204521 Digital System Architecture
Information Technology R&D
U.S. IT's Biggest R&D Spenders in 1993: Total $29.2 billion
$0.97 B
$1.521 B
$1.5301 B
$10.5869 B
$1.761 B
$3.43 B
$4.43 B
IBM AT&T HP DEC
Motorola Intel Xerox Apple
GM-H.E. Texas Instr Unisys Microsoft
Sun Tandem Honeywell 297 other companies
Compaq is #1
PC maker in US
December 20, 2024
204521 Digital System Architecture
Accelerating Pace of Product
Development
1991
$127 Billion
36%
29%
35%
2+ Years
0-1 Year
1-2 Years
22%
46%
32%
1996
$165 Billion
Product age as % of revenue
December 20, 2024
204521 Digital System Architecture
Shift in Employment Towards
Software and Services
Annual Employment in U.S. IT Industry
(1000's of employees)
0
500
1000
1500
2000
2500
'60 '61 '62 '63 '64 '65 '66 '67 '68 '69 '70 '71 '72 '73 '74 '75 '76 '77 '78 '79 '80 '81 '82 '83 '84 '85 '86 '87 '88 '89 '90 '91 '92 '93 '94
Cptr & DP Services
Cptr Bus Equip
Telecom
December 20, 2024
204521 Digital System Architecture 27
Long Term R&D Investments
Take Time to Payoff
Timesharing
Networking
Redundant Array of
Inexpensive Disks
Parallel
Computing
MicroElectro Mech.
Systems
1965 1970 1975 1990
1985
1980 1995
Gov’t Research $1B business
Industry R & D
Reduced Instruction
Set Architecture
December 20, 2024
204521 Digital System Architecture 28
Power/Energy
386
386
486 486
Pentium(R)
Pentium(R)
MMX
Pentium Pro
(R)
Pentium II (R)
1
10
100
       
Max
Power
(Watts)
?
Lead processor power increases every generation
 Compactions provide higher performance at lower
power
December 20, 2024
204521 Digital System Architecture 29
Energy/Power
Power dissipation: rate at which energy is
taken from the supply (power source) and
transformed into heat
Energy dissipation for a given instruction
depends upon type of instruction (and
state of the processor)



n
1
j
j
j I
*
E
*
Time
CPU
1
P
t
E
P
December 20, 2024
204521 Digital System Architecture 30
The Energy-Flexibility Gap
Embedded Processors
SA110
0.4 MIPS/mW
ASIPs
DSPs 2 V DSP: 3 MOPS/mW
Dedicated
HW
Flexibility (Coverage)
Energy
Efficiency
MOPS/mW
(or
MIPS/mW)
0.1
1
10
100
1000
Reconfigurable
Processor/Logic
Pleiades
10-80 MOPS/mW

Cost, Price, and Price for Performance.ppt

  • 1.
    December 20, 2024 204521Digital System Architecture Cost, Price, and Price for Performance Pradondet Nilagupta Spring 2001 (original notes from Randy Katz, UC Berkeley)
  • 2.
    December 20, 2024 204521Digital System Architecture 2 Review From Last Time (1/2) Given sales a function of performance relative to competition, tremendous investment in improving product as reported by performance summary Good products created when have: – Good benchmarks – Good ways to summarize performance If benchmarks/summary inadequate, then choice between improving product for real programs vs. improving product to get more sales;
  • 3.
    December 20, 2024 204521Digital System Architecture 3 Review From Last Time (2/2) Execution time is the REAL measure of computer performance! What about cost?
  • 4.
    December 20, 2024 204521Digital System Architecture 4 Integrated Circuits
  • 5.
    December 20, 2024 204521Digital System Architecture 5 Integrated Circuits Costs (1/3) Yield Test Final cost Packaging cost Testing cost Die cost IC    Yield Die * Wafer per Dies cost Wafer cost Die 
  • 6.
    December 20, 2024 204521Digital System Architecture 6 Integrated Circuits Costs (2/3) TestDie Area Die * 2 Wafer_diam * Area Die m/2) (Wafer_dia * wafer Die 2                 Area Die * Area) t Defect/Uni 1 * Yield Wafer DieYield (
  • 7.
    December 20, 2024 204521Digital System Architecture 7 Integrated Circuits Costs (3/3) Defect per unit area (0.6 to 1.2), Fabrication complexity: a (about 3)  is a parameter that correspond to the number of masking level (roughly 3 for CMOS) For Advanced Processes: Die Cost goes roughly with die area4
  • 8.
    December 20, 2024 204521Digital System Architecture 8 Real World Example Chip Metal Layer Line Width Wafer Cost Defect /Cm2 Area mm2 Dies/ Wafer Yield Die Cost 386DX 2 0.90 $900 1.0 43 360 71% $4 486DX2 3 0.80 $1200 1.0 81 181 54% $12 PowerPC 601 4 0.80 $1700 1.3 121 115 28% $53 HP PA 7100 3 0.80 $1300 1.0 196 66 27% $73 DEC Alpha 3 0.70 $1500 1.2 234 53 19% $149 Super SPARC 3 0.70 $1700 1.6 256 48 13% $272 Pentium 3 0.80 $1500 1.5 296 40 9% $417 From "Estimating IC Manufacturing Costs,” by Linley Gwennap, Microprocessor Report, August 2, 1993, p. 15
  • 9.
    December 20, 2024 204521Digital System Architecture 9 Other Cost Chip Die Cost pin Package Type Cost Test & Assembly Total 386DX $4 132 QFP $1 $4 $9 486DX2 $12 168 PGA $11 $12 $35 PowerPC 601 $53 304 QFP $3 $21 $77 HP PA 7100 $73 504 PGA $35 $16 $124 DEC Alpha $149 431 PGA $30 $23 $202 Super SPARC $272 293 PGA $20 $34 $326 Pentium $417 273 PGA $19 $37 $473 Yield Die Time Test Ave. * Cost Test Cost Test Die  Packaging Cost: depends on pins, heat dissipation, appearance, ...
  • 10.
    December 20, 2024 204521Digital System Architecture Cost/Performance What is Relationship of Cost to Price? Component Costs Component Cost List Price 15% to 33%
  • 11.
    December 20, 2024 204521Digital System Architecture Cost/Performance What is Relationship of Cost to Price? Component Costs Direct Costs (add 25% to 40%) recurring costs: labor, purchasing, scrap, warranty Component Cost Direct Cost List Price 15% to 33% 6% to 8%
  • 12.
    December 20, 2024 204521Digital System Architecture Cost/Performance What is Relationship of Cost to Price? Component Costs Direct Costs (add 25% to 40%) recurring costs: labor, purchasing, scrap, warranty Gross Margin (add 82% to 186%) nonrecurring costs: R&D, marketing, sales, equipment maintenance, rental, financing cost, pretax profits, taxes Component Cost Direct Cost Gross Margin List Price 15% to 33% 6% to 8% 34% to 39%
  • 13.
    December 20, 2024 204521Digital System Architecture Cost/Performance What is Relationship of Cost to Price? Component Costs Direct Costs (add 25% to 40%) recurring costs: labor, purchasing, scrap, warranty Gross Margin (add 82% to 186%) nonrecurring costs: R&D, marketing, sales, equipment maintenance, rental, financing cost, pretax profits, taxes Average Discount to get List Price (add 33% to 66%): volume discounts and/or retailer markup Component Cost Direct Cost Gross Margin Average Discount Avg. Selling Price List Price 15% to 33% 6% to 8% 34% to 39% 25% to 40%
  • 14.
    December 20, 2024 204521Digital System Architecture Assume purchase 10,000 units Chip Prices (August 1993) Chip Area Mfg. Price Multi- Comment mm2 cost plier 386DX 43 $9 $31 3.4 Intense Competition Intense Competition 486DX2 81 $35 $245 7.0 No Competition No Competition PowerPC 601 121 $77 $280 3.6 DEC Alpha 234 $202 $1231 6.1 Recoup R&D? Pentium 296 $473 $965 2.0 Early in shipments
  • 15.
    December 20, 2024 204521Digital System Architecture 15 Chip Prices (August 1993) Assume purchase 10,000 units Chip Area Mfg. Price Multi- Comment mm2 cost plier 386DX 43 $9 $31 3.4 Intense Competition 486DX2 81 $35 $245 7.0 No Competition PowerPC 601 121 $77 $280 3.6 DEC Alpha 234 $202 $1231 6.1 Recoup R&D? Pentium 296 $473 $965 2.0 Early in shipments
  • 16.
    December 20, 2024 204521Digital System Architecture 16 Workstation Costs: $1000 to $3000 DRAM: 50% to 55% Color Monitor: 15% to 20% CPU board: 10% to 15% Hard disk: 8% to 10% CPU cabinet: 3% to 5% Video & other I/O: 3% to 7% Keyboard, mouse: 1% to 2%
  • 17.
    December 20, 2024 204521Digital System Architecture Learning Curve Years production costs volume time to introduce new product
  • 18.
    December 20, 2024 204521Digital System Architecture 18 Volume vs. Cost Rule of thumb on applying learning curve to man ufacturing: “When volume doubles, costs reduce 10%” A DEC View of Computer Engineering by C. G. Bell, J. C. Mudge, and J. E. McNamara, Digital Press, Bedford, MA., 1978. 40 MPPs @ 200 nodes = 8,000 nodes/year vs. 100,000 Workstations/year 2X = (100,000/8,000) => x = 3.6 Since doubling value reduces cost by 10%, costs reduces to (0.9)3.6 = 0.68 of the original price (about 1/3 less expensive).
  • 19.
    December 20, 2024 204521Digital System Architecture 19 Volume vs. Cost: PCs vs. Workstations 1990 1992 1994 1997 PC 23,880,898 33,547,589 44,006,000 65,480,000 WS 407,624 584,544 679,320 978,585 Ratio 59 57 65 67 2x = 65 => X = 6.0 and (0.9)6.0 = 0.53 ญ PC costs are 47% less than workstation costs for whole market. Single company: 20% WS market vs. 10% PC market Ratio 29 29 32 33 2x = 32 => X = 5.0 and (0.9)5.0 = 0.59 ญ PCs cost 41% less than workstations for single compan y.
  • 20.
    December 20, 2024 204521Digital System Architecture 20 High Margins on High-End Machines R&D considered return on investment (ROI) ญ10% – Every $1 R&D must generate $7 to $13 in sales High end machines need more $ for R&D Sell fewer high end machines – Fewer to amortize R&D – Much higher margins Cost of 1 MB Memory (January 1994): PC $40 (Mac Quadra) WS $42 (SS-10) Mainframe $1920 (IBM 3090) Supercomputer $600 (M90 DRAM) $1375 (C90 15 ns SRAM)
  • 21.
    December 20, 2024 204521Digital System Architecture 21 Recouping Development Cost on Low Volume Microprocessors? Hennessy says MIPS R4000 cost $30M to develop Intel rumored to invest $100M on 486 SGI/MIPS sells 300,000 R4000s over product lifetime? Intel sells 50,000,000 486s? Intel must get $100M from chips ($2/chip) SGI/MIPS can get $30M from margin of workstations vs. chips vs. $100/chip Alternative: SGI buys chips vs. develops them
  • 22.
    December 20, 2024 204521Digital System Architecture 22 Price/Performance Gross Margin vs. Market Segment 0 1 2 3 4 5 Mini W/S PC Average Discount Gross Margin Direct Costs Component Costs 4.7 3.8 1.8 3.5 2.5 1.5
  • 23.
    December 20, 2024 204521Digital System Architecture 23 Price/Performance Gross Margin vs. Market Segment 0% 20% 40% 60% 80% 100% Mini W/S PC Average Discount Gross Margin Direct Costs Component Costs
  • 24.
    December 20, 2024 204521Digital System Architecture Information Technology R&D U.S. IT's Biggest R&D Spenders in 1993: Total $29.2 billion $0.97 B $1.521 B $1.5301 B $10.5869 B $1.761 B $3.43 B $4.43 B IBM AT&T HP DEC Motorola Intel Xerox Apple GM-H.E. Texas Instr Unisys Microsoft Sun Tandem Honeywell 297 other companies Compaq is #1 PC maker in US
  • 25.
    December 20, 2024 204521Digital System Architecture Accelerating Pace of Product Development 1991 $127 Billion 36% 29% 35% 2+ Years 0-1 Year 1-2 Years 22% 46% 32% 1996 $165 Billion Product age as % of revenue
  • 26.
    December 20, 2024 204521Digital System Architecture Shift in Employment Towards Software and Services Annual Employment in U.S. IT Industry (1000's of employees) 0 500 1000 1500 2000 2500 '60 '61 '62 '63 '64 '65 '66 '67 '68 '69 '70 '71 '72 '73 '74 '75 '76 '77 '78 '79 '80 '81 '82 '83 '84 '85 '86 '87 '88 '89 '90 '91 '92 '93 '94 Cptr & DP Services Cptr Bus Equip Telecom
  • 27.
    December 20, 2024 204521Digital System Architecture 27 Long Term R&D Investments Take Time to Payoff Timesharing Networking Redundant Array of Inexpensive Disks Parallel Computing MicroElectro Mech. Systems 1965 1970 1975 1990 1985 1980 1995 Gov’t Research $1B business Industry R & D Reduced Instruction Set Architecture
  • 28.
    December 20, 2024 204521Digital System Architecture 28 Power/Energy 386 386 486 486 Pentium(R) Pentium(R) MMX Pentium Pro (R) Pentium II (R) 1 10 100         Max Power (Watts) ? Lead processor power increases every generation  Compactions provide higher performance at lower power
  • 29.
    December 20, 2024 204521Digital System Architecture 29 Energy/Power Power dissipation: rate at which energy is taken from the supply (power source) and transformed into heat Energy dissipation for a given instruction depends upon type of instruction (and state of the processor)    n 1 j j j I * E * Time CPU 1 P t E P
  • 30.
    December 20, 2024 204521Digital System Architecture 30 The Energy-Flexibility Gap Embedded Processors SA110 0.4 MIPS/mW ASIPs DSPs 2 V DSP: 3 MOPS/mW Dedicated HW Flexibility (Coverage) Energy Efficiency MOPS/mW (or MIPS/mW) 0.1 1 10 100 1000 Reconfigurable Processor/Logic Pleiades 10-80 MOPS/mW