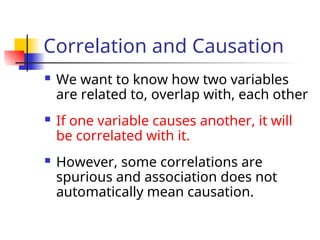
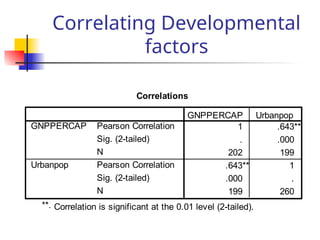
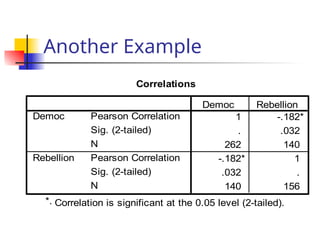
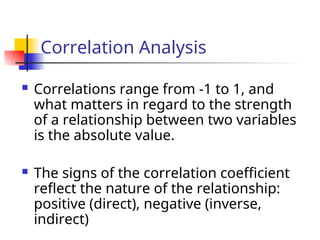
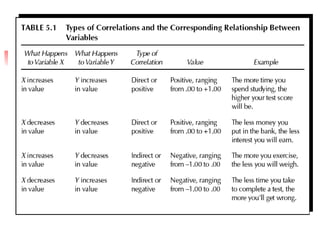
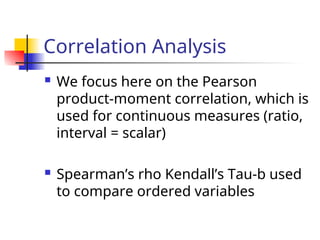
Correlation analysis measures the degree of association between two variables, indicating how changes in one variable relate to changes in another. The strength of correlations is quantified by coefficients ranging from -1 to 1, with significance levels determining the probability of random chance affecting results. However, while correlations can suggest relationships, they cannot confirm causation or capture nuances such as marginal impacts and forecasting capabilities.

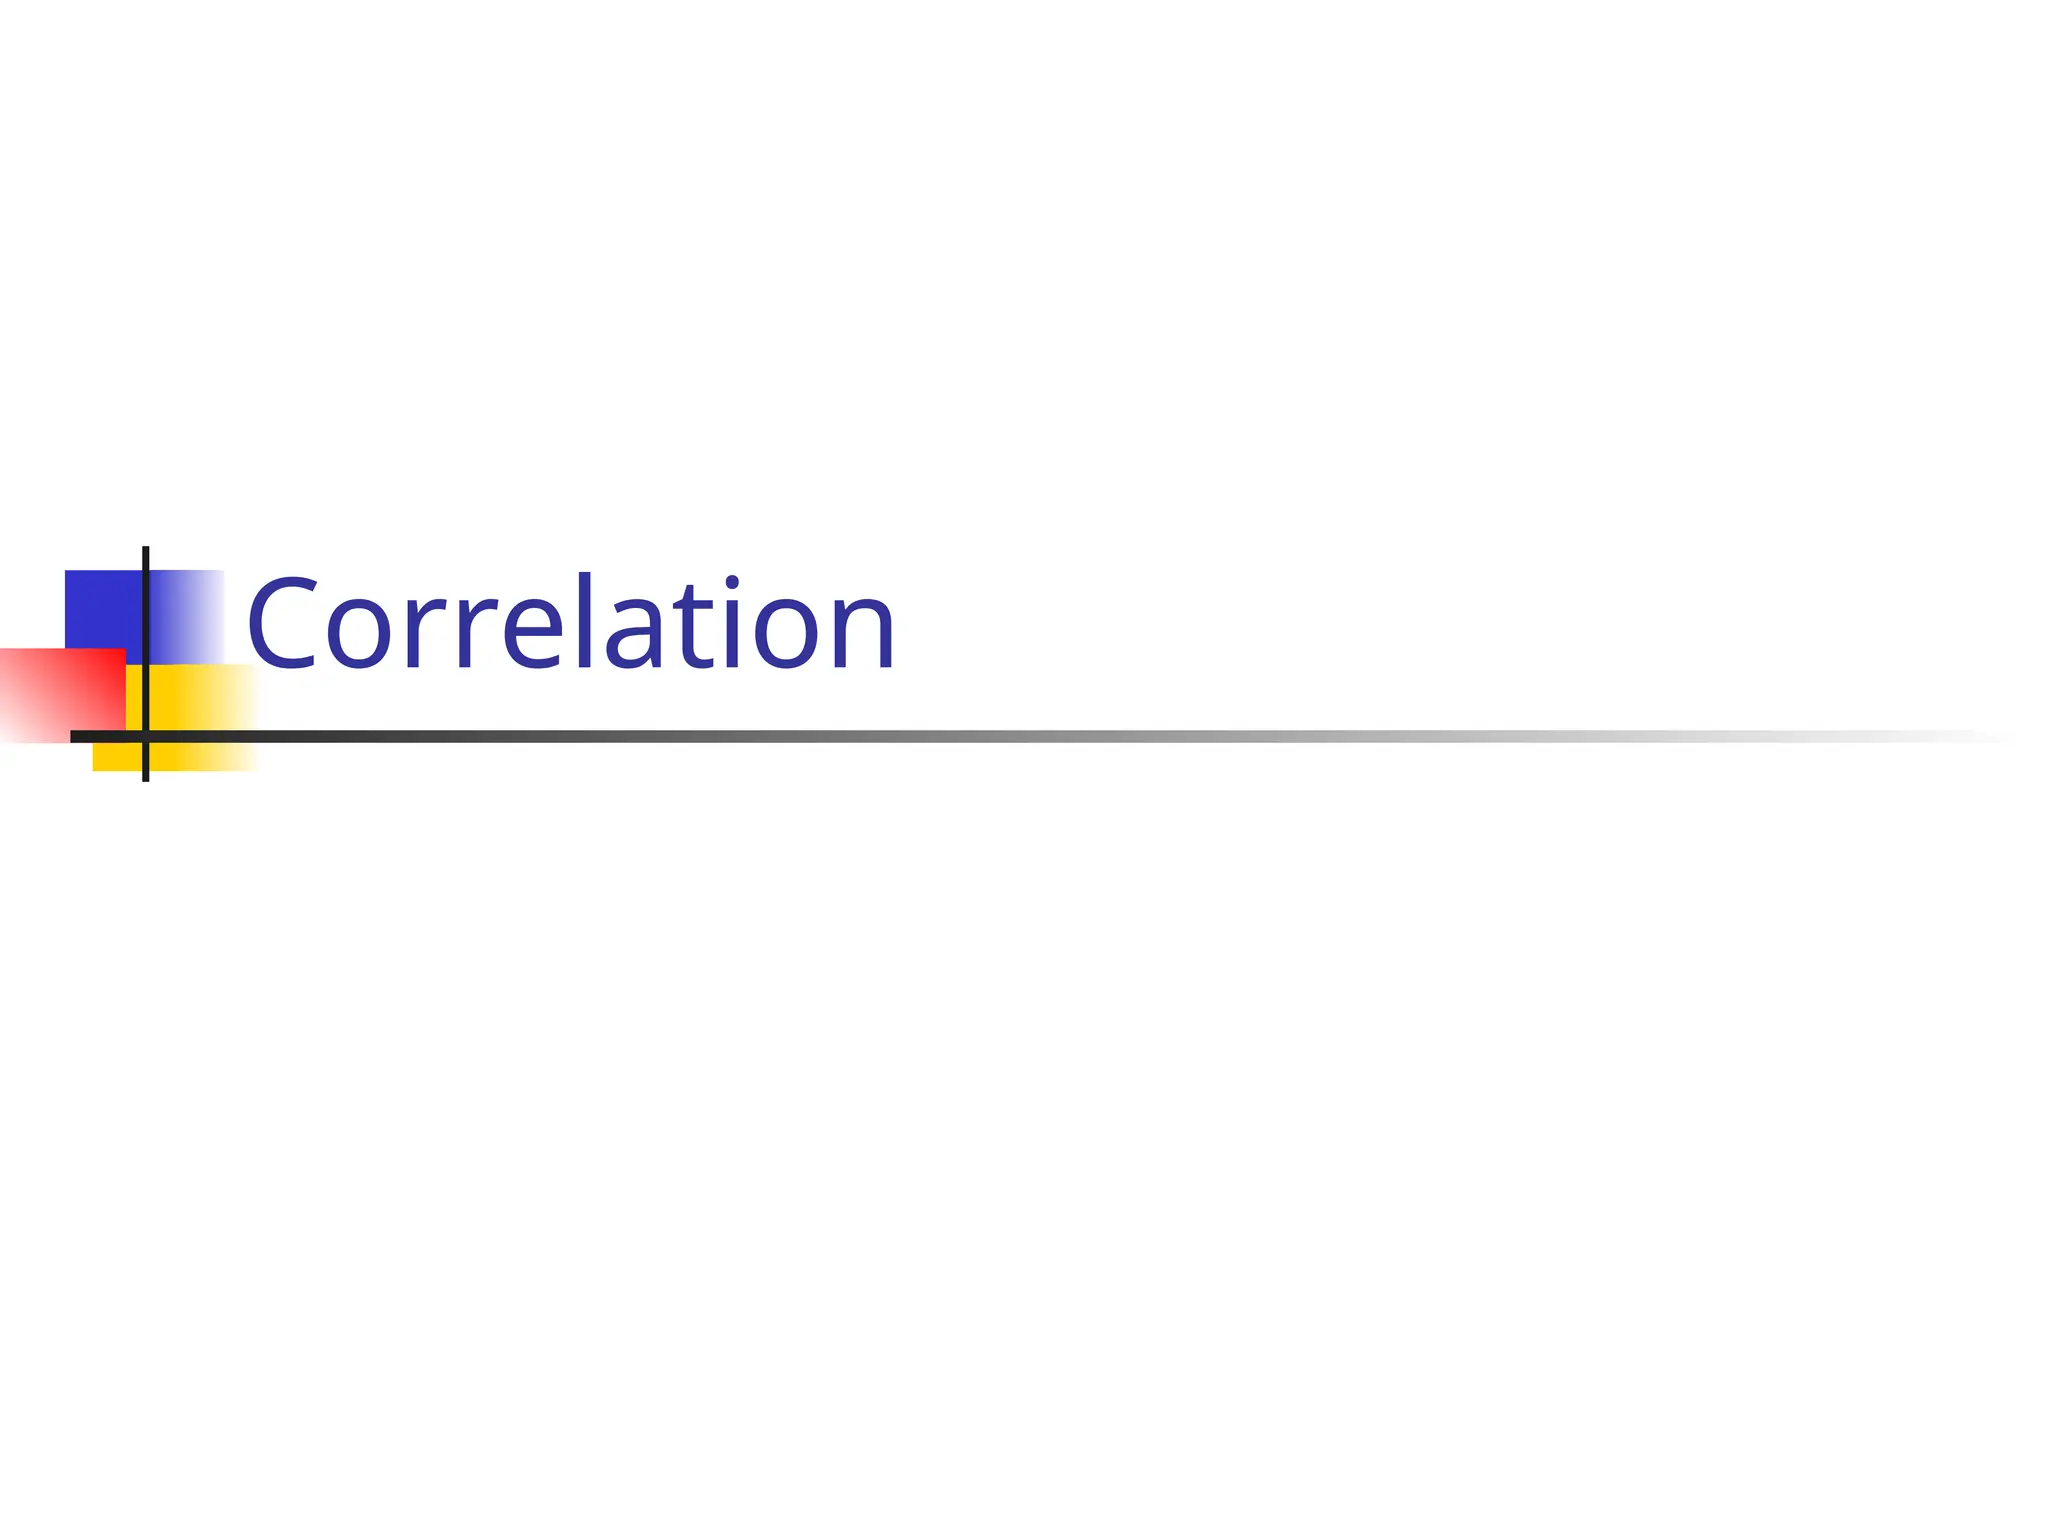
![Correlation Coefficient
]
)
(
][
)
(
[ 2
2
2
2
Y
Y
n
X
X
n
Y
X
XY
n
rxy
](https://image.slidesharecdn.com/correlation-241220102405-0a002da1/85/Correlation-test-guidances-for-beginner-12-320.jpg)