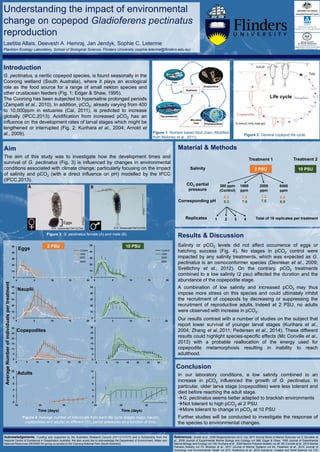
More Related Content
Similar to Copepod reproduction poster
Similar to Copepod reproduction poster (20)
Copepod reproduction poster
- 1. Understanding the impact of environmental
change on copepod Gladioferens pectinatus
reproduction
Laetitia Allais, Deevesh A. Hemraj, Jan Jendyk, Sophie C. Leterme
Plankton Ecology Laboratory, School of Biological Science, Flinders University (sophie.leterme@flinders.edu.au)
0
10
20
30
40
50
0 5 10 15 20
0
10
20
30
40
50
0 5 10 15 20
0
10
20
30
40
50
0 5 10 15 20
0
10
20
30
40
50
0 5 10 15 20
1000
2000
5000
Control
AverageNumberofindividualspertreatment
Eggs
Nauplii
Time (days)
1000
2000
5000
Control
0
5
10
15
20
25
30
0 5 10 15 20 25 30
0
5
10
15
20
25
30
0 5 10 15 20 25 30
Copepodites
0
2
4
6
8
10
20 25 30
0
2
4
6
8
10
20 25 30
Adults
Conclusion
In our laboratory conditions, a low salinity combined to an
increase in pCO2 influenced the growth of G. pectinatus. In
particular, older larva stage (copepodites) were less tolerant and
died before reaching the adult stage.
G. pectinatus seems better adapted to brackish environments
Not tolerant to high pCO2 at 2 PSU
More tolerant to change in pCO2 at 10 PSU
Further studies will be conducted to investigate the response of
the species to environmental changes.
10 PSU2 PSU
Acknowledgements. Funding was supported by the Australian Research Council (DP110101679) and a Scholarship from the
National Centre of Excellence in Desalination Australia. We also would like to acknowledge the Department of Environment, Water and
National Resources (DEWNR) for giving us access to the Coorong National Park (South Australia).
Results & Discussion
Salinity or pCO2 levels did not affect occurrence of eggs or
hatching success (Fig. 4). No stages in pCO2 control were
impacted by any salinity treatments, which was expected as G.
pectinatus is an osmoconformer species (Devreker et al., 2009;
Svetlichny et al., 2012). On the contrary, pCO2 treatments
combined to a low salinity (2 psu) affected the duration and the
abundance of the copepodite stage.
A combination of low salinity and increased pCO2 may thus
impose more stress on this species and could ultimately inhibit
the recruitment of copepods by decreasing or suppressing the
recruitment of reproductive adults. Indeed at 2 PSU, no adults
were observed with increase in pCO2.
Our results contrast with a number of studies on the subject that
report lower survival of younger larval stages (Kurihara et al.,
2004; Zhang et al.,2011; Pedersen et al., 2014). These different
results could highlight species-specific effects (Mc Conville et al.,
2013) with a probable reallocation of the energy used for
copepodite metamorphosis resulting in inability to reach
adulthood.
Introduction
G. pectinatus, a neritic copepod species, is found seasonally in the
Coorong wetland (South Australia), where it plays an ecological
role as the food source for a range of small nekton species and
other crustacean feeders (Fig. 1; Edgar & Shaw, 1995).
The Coorong has been subjected to hypersaline prolonged periods
(Zampatti et al., 2010). In addition, pCO2, already varying from 400
to 10,000ppm in estuaries (Cai, 2011), is predicted to increase
globally (IPCC,2013). Acidification from increased pCO2 has an
influence on the development rates of larval stages which might be
lengthened or interrupted (Fig. 2; Kurihara et al., 2004; Arnold et
al., 2009).
Aim
The aim of this study was to investigate how the development times and
survival of G. pectinatus (Fig. 3) is influenced by changes in environmental
conditions associated with climate change; particularly focusing on the impact
of salinity and pCO2 (with a direct influence on pH) modelled by the IPCC
(IPCC,2013).
Material & Methods
Salinity
CO2 partial
pressure
380 ppm
(Control)
1000
ppm
2000
ppm
5000
ppm
2 PSU 10 PSU
Treatment 1 Treatment 2
Replicates 1 2 3 4 Total of 16 replicates per treatment
8.2
8.2
7.6
7.9
7.2
7.6
6.6
6.9Corresponding pH
Life cycle
© www.st.nmfs.noaa.gov
Eggs
© A. Slotwinski/TAFI/UTAS © A. Slotwinski/TAFI/UTAS
Time (days)
References: Arnold et al., 2009 Biogeosciences vol 6; Cai, 2011 Annual Revie of Marine Sciences vol 3; Devreker et
al., 2009 Journal of Experimental Marine Biology and Ecology vol 368; Edgar & Shaw, 1995 Journal of Experimental
Marine Biology and Ecology vol 194; Kurihara et al., 2004 Marine Pollution Bulletin vol 49; Mc Conville et al., 2013 Marine
Pollution Bulletin vol 73; Moloney et al., 2011 Journal of Marine Systems vol 84; Pedersen et al., 2014 Journal of
Toxicology and Environmental Health vol A77; Svetlichny et al., 2012 Estuarine, Coastal and Shelf Science vol 114;
Figure 4: Average number of individuals from each life cycle stages (eggs, nauplii,
copepodites and adults) at different CO2 partial pressures as a function of time.
Figure 3: G. pectinatus female (A) and male (B).
Figure 1: Nutrient based food chain (Modified
from Moloney et al., 2011).
Figure 2: General copepod life cycle.
A B