
![6
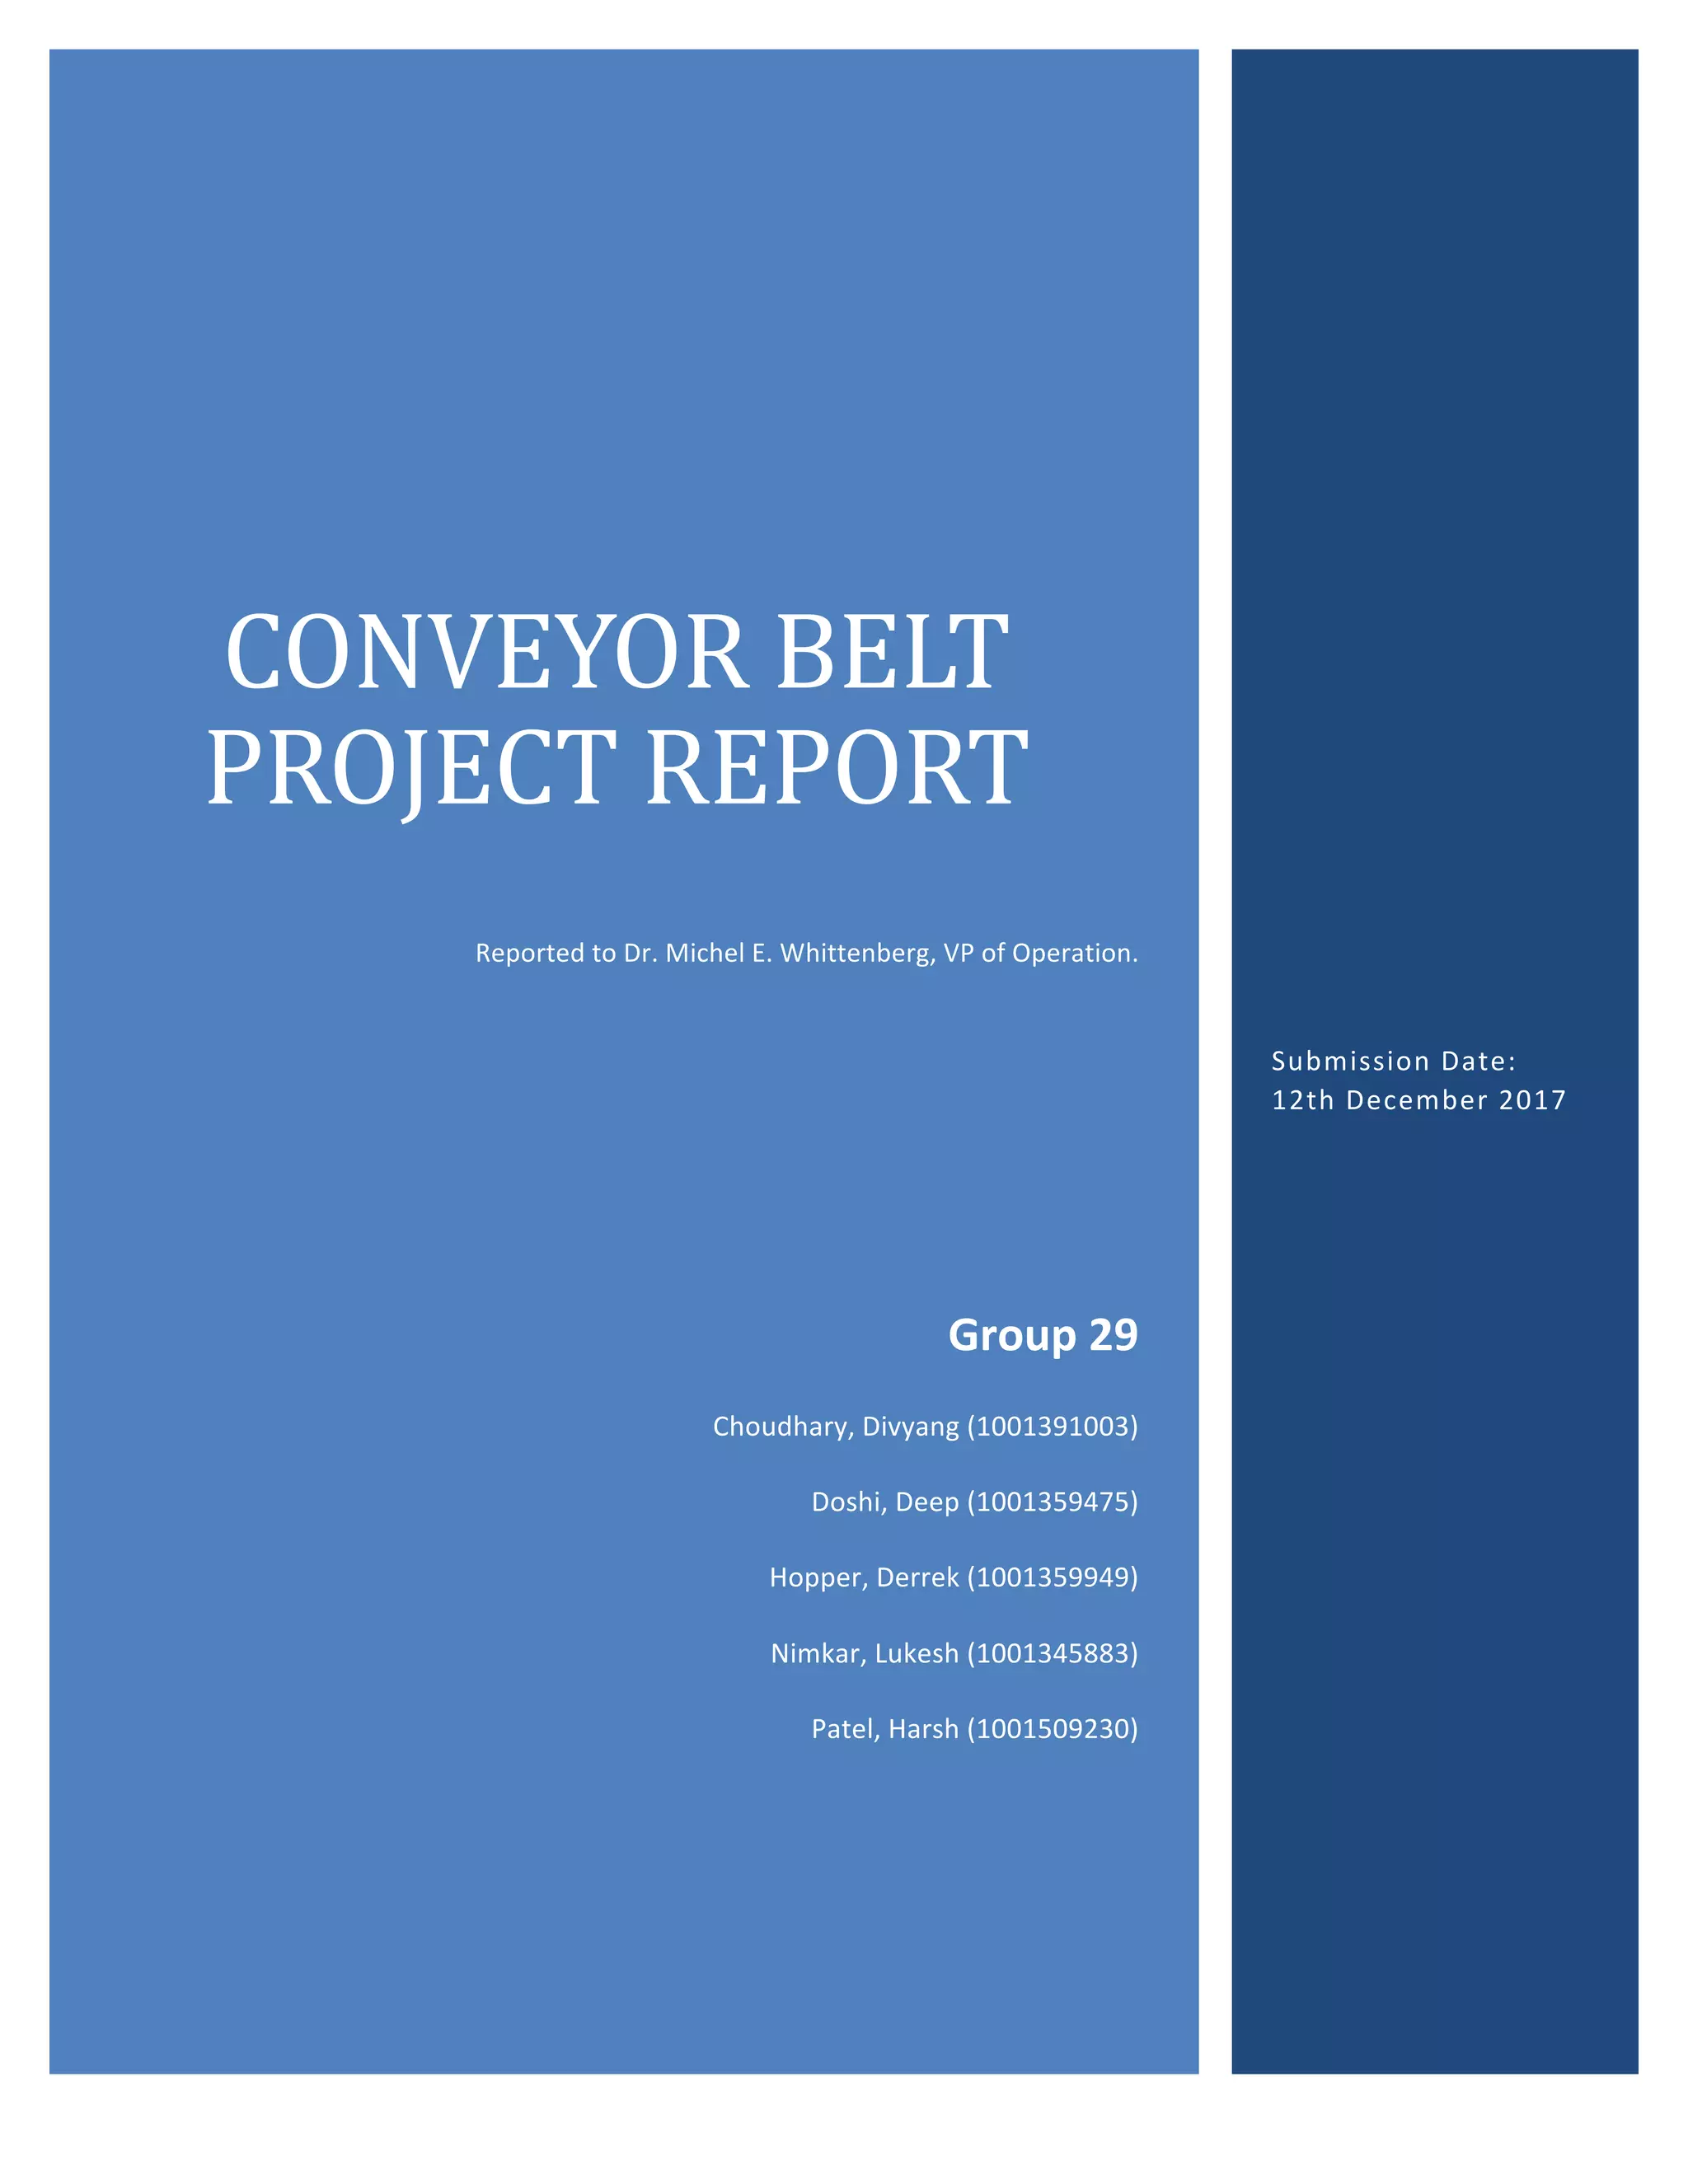
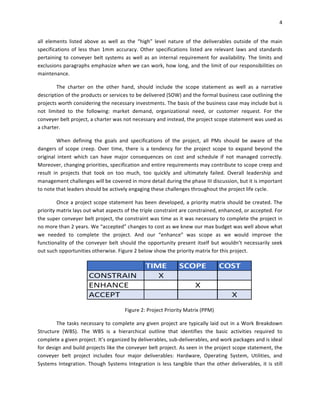
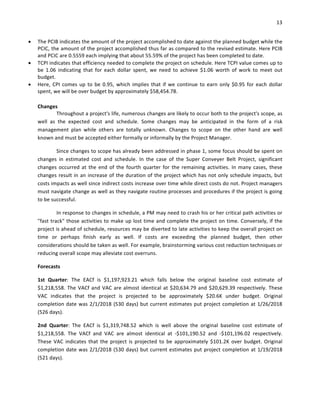
then sub-deliverables were all input into the WBS in a hierarchical way. The final coded WBS elements
contain unique numerical identifiers which allow reports to be consolidated at any level in the WBS
structure. Figure 4 below shows a coded WBS as described above.
Figure 4: Coded WBS
Having identified the goals and objectives of the program, determined priorities,
developed a WBS and OBS, and coded our activities into our chosen IS, the team was able begin the
process of developing detailed plans for the project. Throughout all phases, the PM’s ability to lead and
manage the team will be critical. Without strong leadership, scope creep, internal conflict, external
conflict, senior management priority changes, or declining morale
Phase Two: Planning
According to PMBOK, project plan is a formal, approved document used to guide both project
execution and project control. Project planning helps in several crucial activities such as establishing
directions for the project team, supporting objectives of parent organization, making allowances for
possible risks and putting control on planned work [Chapter 4 Slide 7, 2017]. In this phase of project,
level of effort is increased compared to defining phase. The planning phase of project involves five main
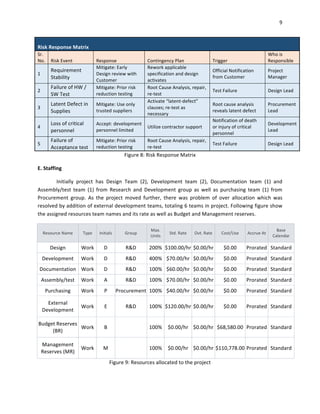
phases: Schedules, Budgets, Resources, Risks and Staffing
A. Schedules
The initial estimation for complete date of Conveyor Belt project was 530 work days, with a
delivery date of February 1, 2018. The critical path for the project was determined to be:
Architectural Design -> Hardware Specification -> Hardware Design -> Hardware Documentation ->
Integration First Phase -> Serial I/0 Drivers -> System Hard/Software Test -> Network Interface ->
Integration Acceptance Testing.](https://image.slidesharecdn.com/group29projectreport-180529075217/85/CONVEYOR-BELT-PROJECT-REPORT-7-320.jpg)

![19
References
1. Larson, Erik W., “Project Management”, 7th
edition. New York, NY: Macgraw Hill
Education [2017].
2. Lecture Notes. Presented by Dr. Michel E. Whittenberg. Found: Notes
3. Microsoft Project Tutorials. Found: Tutorials](https://image.slidesharecdn.com/group29projectreport-180529075217/85/CONVEYOR-BELT-PROJECT-REPORT-20-320.jpg)

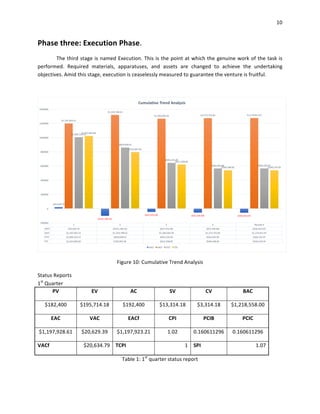
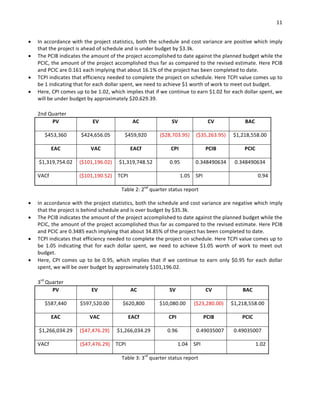
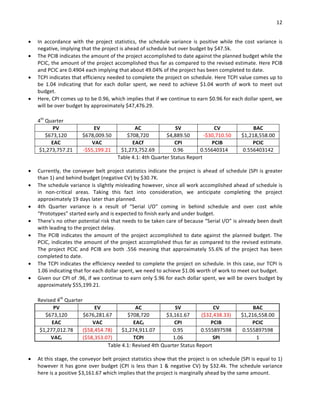
The conveyor belt project report details the status and progress of the super conveyor belt project organized into four main phases: defining, planning, executing, and closing. It includes essential information related to project goals, timelines, budgets, resource allocation, risk assessment, and variances in project execution efficiency. The report highlights specific metrics, such as cost performance index and schedule performance index, indicating the project is currently ahead of schedule and under budget.


