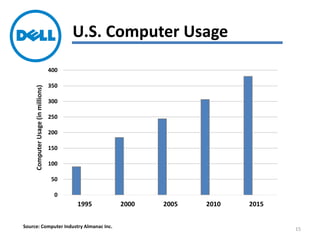
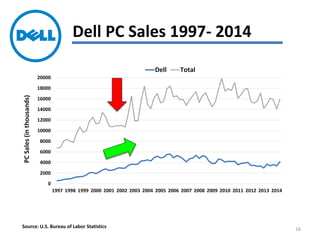
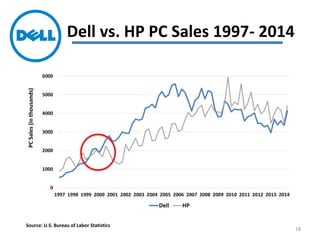
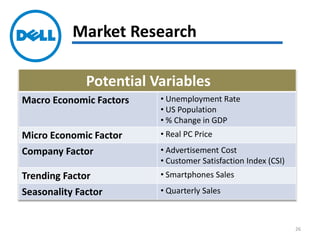
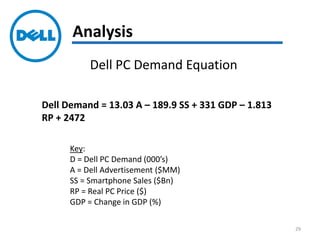
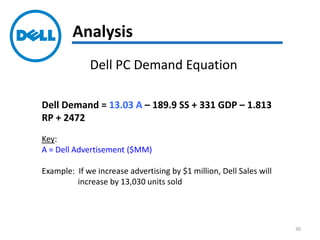
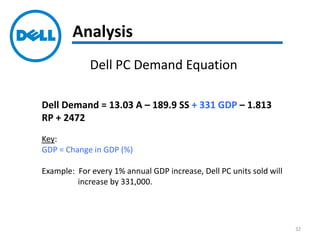
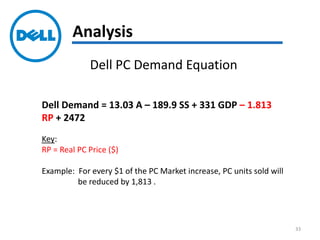
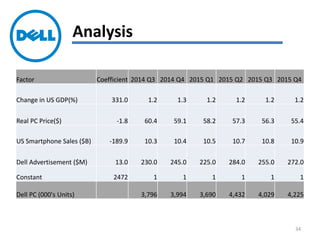
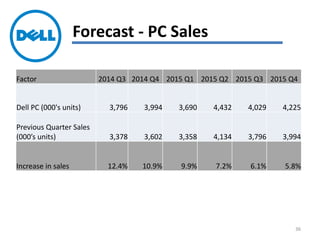
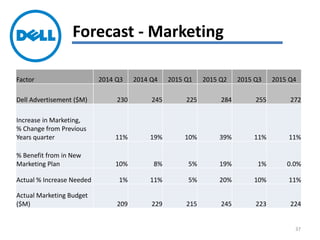
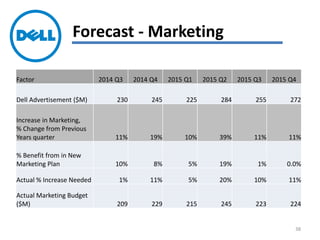
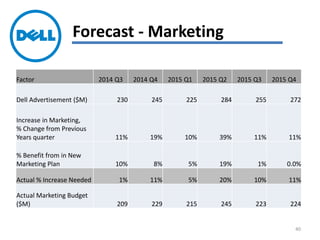
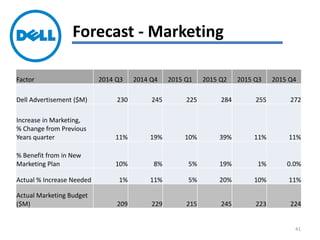
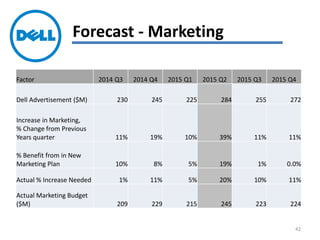
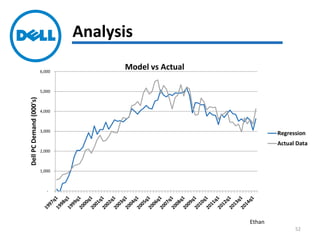
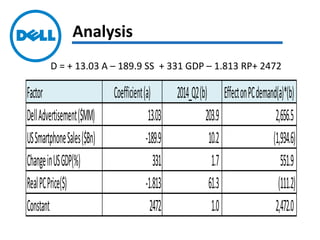
1
Demand for
Personal Computers in the U.S.
Executive Team 7
Colin Byxbee, Amber Templeton, Rachit Jauhari, Ethan Yamasaki, James
Millhiser
2
1. Introduction
2. Industry Trends
3. Data Collection
4. Analysis
5. Forecast
6. Q & A
Presentation Agenda
Colin Byxbee
3
1. Introduction
2. Industry Trends
3. Data Collection
4. Analysis
5. Forecast
6. Q & A
Presentation Agenda
Amber Templeton
4
1. Introduction
2. Industry Trends
3. Data Collection
4. Analysis
5. Forecast
6. Q & A
Presentation Agenda
Rachit Jauhari
5
1. Introduction
2. Industry Trends
3. Data Collection
4. Analysis
5. Forecast
6. Q & A
Presentation Agenda
Ethan Yamasaki
6
1. Introduction
2. Industry Trends
3. Data Collection
4. Analysis
5. Forecast
6. Q & A
Presentation Agenda
James Millhiser
7
1. Introduction
2. Industry Trends
3. Data Collection
4. Analysis
5. Forecast
6. Q & A
Presentation Agenda
8
1. Introduction
2. Industry Trends
3. Data Collection
4. Analysis
5. Forecast
6. Q & A
Presentation Agenda
Amber Templeton
9
Industry Trends
Image Source: http://www.techhive.com/article/2042351/us-states-attorneys-general-to-take-aim-at-internet-safe-
harbor-law.html 10
Demand in Market
Image 1 Source: http://www.amazon.com/Dell-Inspiron-i15RV-6143BLK-Touchscreen-Textured/dp/B00D9KP70G
Image 2 Source: http://www.thewritingnut.com/writing-tools/setting-shop-part-4-writers-computer/
Image 3 Source: http://i-deals.in/2014/03/27/flipkart-rs-3000-smartphone-attractive-discounts-dell-venue-tablets/
1990s: Internet and media applications
Early 2000s: Laptop computers
Late 2000s: Smartphones and Tablets
11
Dell in the Market
2009: Dell in
smartphone market
2010: Dell in tablet
market
Image 1 Source: http://blogdetecnologiamoderna.com/moviles/dell-lanza-en-mexico-smartphone-mini-3ix/
Image 2 Source: http://microsoft-news.com/dell-venue-8-pro-tablet-starting-299-now-available-for-order/
12
Outside Noise
Quote Source: http://www.theguardian.com/technology/2012/nov/16/dell-revenues-slump-pc-tablet-
smartphone
“Dell is looking like
the sick man of the
PC business…”
13
Dell in the Market: Outcomes
2012: Dell exits
smartphone market
Image 1 Source: http://blogdetecnologiamoderna.com/moviles/dell-lanza-en-mexico-smartphone-mini-3ix/
Image 2 Source: http://www.dell.com/learn/us/en/19/campaigns/laptops-tablets-coming-soon
Coming Soon: The Dell Venue 8
7000 Series Android™ Tablet
14
U.S. Computer Usage
0
50
100
150
200
250
300
350
400
1995 2000 2005 2010 2015
ComputerUsage(inmillions)
Source: Computer Industry Almanac Inc. 15
Dell PC Sales 1997- 2014
0
2000
4000
6000
8000
10000
12000
14000
16000
18000
20000
1997 1998 1999 2000 2001 2002 2003 2004 2005 2006 2007 2008 2009 2010 2011 2012 2013 2014
Dell Total
PCSales(inthousands)
Source: U.S. Bureau of Labor Statistics 16
Made-to-Order PCs
Image Source: http://whitestoneresults.com/pay-per-click-setup-and-management/ 17
Dell vs. HP PC Sales 1997- 2014
0
1000
2000
3000
4000
5000
6000
1997 1998 1999 2000 2001 2002 2003 2004 2005 2006 2007 2008 2009 2010 2011 2012 2013 2014
Dell HP
PCSales(inthousands)
Source: U.S. Bureau of Labor Statistics
18
Our Strategy
Image Source: http://www.underconsideration.com/brandnew/archives/a_dell-
icate_redesign.php#.VIc7X7l0yM8
19
1. Introduction
2. Industry Trends
3. Data Collection
4. Analysis
5. Forecast
6. Q & A
Presentation Agenda
Rachit Jauhari
20
Market Research
Scan the Market
Survey
Broad Research
68 Quantifiable Variables
17 Variables used in Regression
Final Equation
21
Market Research
Scan the Market
Survey
Broad Research
68 Quantifiable Variables
17 Variables used in Regression
Final Equation
22
Market Research
Scan the Market
Survey
Broad Research
68 Quantifiable Variables
17 Variables used in Regression
Final Equation
23
Market Research
Scan the Market
Survey
Broad Research
68 Quantifiable Variables
17 Variables used in Regression
Final Equation
24
Market Research
Scan the Market
Survey
Broad Research
68 Quantifiable Variables
17 Variables used in Regression
Final Equation
25
Market Research
Potential Variables
Macro Economic Factors • Unemployment Rate
• US Population
• % Change in GDP
Micro Economic Factor • Real PC Price
Company Factor • Advertisement Cost
• Customer Satisfaction Index (CSI)
Trending Factor • Smartphones Sales
Seasonality Factor • Quarterly Sales
26
Market Research
Scan the Market
Survey
Broad Research
68 Quantifiable Variables
17 Variables used in Regression
Final Equation
27
1. Introduction
2. Industry Trends
3. Data Collection
4. Analysis
5. Forecast
6. Q & A
Presentation Agenda
Ethan Yamasaki
28
Analysis
Dell Demand = 13.03 A – 189.9 SS + 331 GDP – 1.813
RP + 2472
Key:
D = Dell PC Demand (000’s)
A = Dell Advertisement ($MM)
SS = Smartphone Sales ($Bn)
RP = Real PC Price ($)
GDP = Change in GDP (%)
Dell PC Demand Equation
29
Analysis
Dell Demand = 13.03 A – 189.9 SS + 331 GDP – 1.813
RP + 2472
Key:
A = Dell Advertisement ($MM)
Example: If we increase advertising by $1 million, Dell Sales will
increase by 13,030 units sold
Dell PC Demand Equation
30
Analysis
Dell Demand = 13.03 A – 189.9 SS + 331 GDP – 1.813
RP + 2472
Key:
SS = Smartphone Sales ($B)
Example: If Smartphone sales are increase by $1 billion, Dell
demand falls 189,900 units.
Dell PC Demand Equation
31
Analysis
Dell Demand = 13.03 A – 189.9 SS + 331 GDP – 1.813
RP + 2472
Key:
GDP = Change in GDP (%)
Example: For every 1% annual GDP increase, Dell PC units sold will
increase by 331,000.
Dell PC Demand Equation
32
Analysis
Dell Demand = 13.03 A – 189.9 SS + 331 GDP – 1.813
RP + 2472
Key:
RP = Real PC Price ($)
Example: For every $1 of the PC Market increase, PC units sold will
be reduced by 1,813 .
Dell PC Demand Equation
33
Analysis
Factor Coefficient 2014 Q3 2014 Q4 2015 Q1 2015 Q2 2015 Q3 2015 Q4
Change in US GDP(%) 331.0 1.2 1.3 1.2 1.2 1.2 1.2
Real PC Price($) -1.8 60.4 59.1 58.2 57.3 56.3 55.4
US Smartphone Sales ($B) -189.9 10.3 10.4 10.5 10.7 10.8 10.9
Dell Advertisement ($M) 13.0 230.0 245.0 225.0 284.0 255.0 272.0
Constant 2472 1 1 1 1 1 1
Dell PC (000's Units) 3,796 3,994 3,690 4,432 4,029 4,225
34
1. Introduction
2. Industry Trends
3. Data Collection
4. Analysis
5. Forecast
6. Q & A
Presentation Agenda
James Millhiser
35
Forecast - PC Sales
Factor 2014 Q3 2014 Q4 2015 Q1 2015 Q2 2015 Q3 2015 Q4
Dell PC (000's units) 3,796 3,994 3,690 4,432 4,029 4,225
Previous Quarter Sales
(000’s units) 3,378 3,602 3,358 4,134 3,796 3,994
Increase in sales 12.4% 10.9% 9.9% 7.2% 6.1% 5.8%
36
Forecast - Marketing
Factor 2014 Q3 2014 Q4 2015 Q1 2015 Q2 2015 Q3 2015 Q4
Dell Advertisement ($M) 230 245 225 284 255 272
Increase in Marketing,
% Change from Previous
Years quarter 11% 19% 10% 39% 11% 11%
% Benefit from in New
Marketing Plan 10% 8% 5% 19% 1% 0.0%
Actual % Increase Needed 1% 11% 5% 20% 10% 11%
Actual Marketing Budget
($M) 209 229 215 245 223 224
37
Forecast - Marketing
Factor 2014 Q3 2014 Q4 2015 Q1 2015 Q2 2015 Q3 2015 Q4
Dell Advertisement ($M) 230 245 225 284 255 272
Increase in Marketing,
% Change from Previous
Years quarter 11% 19% 10% 39% 11% 11%
% Benefit from in New
Marketing Plan 10% 8% 5% 19% 1% 0.0%
Actual % Increase Needed 1% 11% 5% 20% 10% 11%
Actual Marketing Budget
($M) 209 229 215 245 223 224
38
Forecast - Marketing
Factor 2014 Q3 2014 Q4 2015 Q1 2015 Q2 2015 Q3 2015 Q4
Dell Advertisement ($M) 230 245 225 284 255 272
Increase in Marketing,
% Change from Previous
Years quarter 11% 19% 10% 39% 11% 11%
% Benefit from in New
Marketing Plan 10% 8% 5% 19% 1% 0.0%
Actual % Increase Needed 1% 11% 5% 20% 10% 11%
Actual Marketing Budget
($M) 209 229 215 245 223 224
39
Forecast - Marketing
Factor 2014 Q3 2014 Q4 2015 Q1 2015 Q2 2015 Q3 2015 Q4
Dell Advertisement ($M) 230 245 225 284 255 272
Increase in Marketing,
% Change from Previous
Years quarter 11% 19% 10% 39% 11% 11%
% Benefit from in New
Marketing Plan 10% 8% 5% 19% 1% 0.0%
Actual % Increase Needed 1% 11% 5% 20% 10% 11%
Actual Marketing Budget
($M) 209 229 215 245 223 224
40
Forecast - Marketing
Factor 2014 Q3 2014 Q4 2015 Q1 2015 Q2 2015 Q3 2015 Q4
Dell Advertisement ($M) 230 245 225 284 255 272
Increase in Marketing,
% Change from Previous
Years quarter 11% 19% 10% 39% 11% 11%
% Benefit from in New
Marketing Plan 10% 8% 5% 19% 1% 0.0%
Actual % Increase Needed 1% 11% 5% 20% 10% 11%
Actual Marketing Budget
($M) 209 229 215 245 223 224
41
Forecast - Marketing
Factor 2014 Q3 2014 Q4 2015 Q1 2015 Q2 2015 Q3 2015 Q4
Dell Advertisement ($M) 230 245 225 284 255 272
Increase in Marketing,
% Change from Previous
Years quarter 11% 19% 10% 39% 11% 11%
% Benefit from in New
Marketing Plan 10% 8% 5% 19% 1% 0.0%
Actual % Increase Needed 1% 11% 5% 20% 10% 11%
Actual Marketing Budget
($M) 209 229 215 245 223 224
42
• Smartphone
• Windows 10
• Dell has come back home
• New Dell, new business
Marketing Strategy
43
• Smartphone
• Windows 10
• Dell has come back home
• New Dell, new business
Marketing Strategy
Source: PC World
44
45
Source List
46
Quantifiable Variables
Net sales Purchased in-
process research
& development
expenses
Special charges -
executive bonus
Research &
development
expenses
Selling, general &
administrative
expenses
Restructuring
costs
Cost of sales Gross margin Special charges -
restructuring costs
Total operating
expenses
Operating income
(loss)
Gain on non-
current
investments
Gain from sales of
investments
Unrealized gain
(loss) on
convertible
securities
Interest & dividend
income
Interest income Interest expense Gain on sales of
short term
investments, net
Other expense,
net
Other income
(expense), net
Interest & other
income (expense),
net
Interest & other
income (expense),
net
Other
income/(expense),
net
Other income
(expense), net
Income (loss)
before provision
for income taxes
Provision for
(benefit from)
income taxes
Income (loss)
before accounting
change
Cumulative effect
of accounting
change, net
Net income (loss) Weighted average
shares outstanding
– basic
Weighted average
shares outstanding
– diluted
Year-end shares
outstanding
Earnings (loss) per
share - continuing
operations – basic
Earnings (loss) per
share - accounting
change – basic
Net earnings (loss)
per share - basic
Earnings (loss) per
share - continuing
operations –
diluted
Earnings (loss) per
share - accounting
change - diluted
Net earnings (loss)
per share - diluted
Cash dividends
declared per
common share
Apple CSI
Personal
Computers CSI
Acer CSI Dell CSI Toshiba CSI HP CSI
IBM CSI Compac CSI PC $ Price CPI All PC $ Price
Revised
Dell Sales Dell Share HP/Compac Sales HP Share % US Desktop
Sales
Dell Revenue Total U.S. Sale % US Notebook
Sales
Total % Sales
Interest in
US Smartphones
Sales
US Population Unemployment
Rate
Unemployment
Number
Real GDP Dell Advertising
Apple Advertising HP Advertising Toshiba
Advertising 47
Data Collection Sources
48
Variables Used
PC Price CPI All Real PC Price Dell Numbers
Dell Share HP/ Compaq
Sales
HP Share Total US
Computers
US Population Real GDP % Change in
GDP
Quarter wise
Sales of Dell
Customer
Satisfaction
Index
Unemployed
Population in
US
Unemployed
rate In US
Dell
Advertising
Smartphones
49
Market Research
Brand Name
Recognition
Acquisitions Direct Business Model
of Dell
Advent of
Smartphones
Relationship with
Suppliers
Leadership on Web Enterprise Customers Global Market
Penetration
Great Recession Economic Downturn in
2001
Interest Expense Acquisition of HP and
COMPAC
Income Tax Importance of I/T to
the Industry
Globalization of the
Industry
PC shipments
Operating Income Inventory Gross Margin Windows 8 effect
Advertising Strategy Information Systems
at Dell
Electronic Data
Interchange(EDI)
Business Vision
Total Households Total Households with
a computer (%)
Total Households with
desktop or laptop
computer (%)
Total households with
handheld computer
(%)
U.S. Computer and
software store sales in
the U.S
Households With a
Computer and Internet
Use at home
Households With a
Computer and Internet
Use
Dell's net revenue
Apple Inc
Form10q,10k
Hewlett-Packard Co
Form 10q,10k
PC CSI HP CSI
IBM CSI Compac CSI Acer CSI Toshiba CSI
Technology Trends Apple CSI % US Desktop Sales % US Notebook Sale
50
Analysis
Ethan
Model Summary
S R-sq R-sq(adj) R-sq(pred)
531.448 85.23% 84.32% 82.68%
Coefficients
Term Coef SE Coef T-Value P-Value VIF
Constant 2472 438 5.65 0.000
US Smartphone Sales ($Bn) -189.9 26.8 -7.08 0.000 2.00
Dell Advertisement ($MM) 13.03 2.37 5.50 0.000 4.12
Change in US GDP(%) 331.0 97.7 3.39 0.001 1.26
Real PC Price($) -1.813 0.187 -9.70 0.000 2.43
Regression Equation
Dell PC Demand(Thd) = 2472 - 189.9 US Smartphone Sales ($Bn)
+ 13.03 Dell Advertisement ($MM)
+ 331.0 Change in US GDP(%) - 1.813 Real PC Price($)
Regression Model Statistic
51
Analysis
Ethan
-
1,000
2,000
3,000
4,000
5,000
6,000
DellPCDemand(000's)
Model vs Actual
Regression
Actual Data
52
Analysis
Factor Coefficient(a) 2014_Q2(b) EffectonPCdemand(a)*(b)
DellAdvertisement($MM) 13.03 203.9 2,656.5
USSmartphoneSales($Bn) -189.9 10.2 (1,934.6)
ChangeinUSGDP(%) 331 1.7 551.9
RealPCPrice($) -1.813 61.3 (111.2)
Constant 2472 1.0 2,472.0
D = + 13.03 A – 189.9 SS + 331 GDP – 1.813 RP+ 2472

Consumer Demand Analysis and Forecast for Dell

  • 1.
  • 2.
    Demand for Personal Computersin the U.S. Executive Team 7 Colin Byxbee, Amber Templeton, Rachit Jauhari, Ethan Yamasaki, James Millhiser 2
  • 3.
    1. Introduction 2. IndustryTrends 3. Data Collection 4. Analysis 5. Forecast 6. Q & A Presentation Agenda Colin Byxbee 3
  • 4.
    1. Introduction 2. IndustryTrends 3. Data Collection 4. Analysis 5. Forecast 6. Q & A Presentation Agenda Amber Templeton 4
  • 5.
    1. Introduction 2. IndustryTrends 3. Data Collection 4. Analysis 5. Forecast 6. Q & A Presentation Agenda Rachit Jauhari 5
  • 6.
    1. Introduction 2. IndustryTrends 3. Data Collection 4. Analysis 5. Forecast 6. Q & A Presentation Agenda Ethan Yamasaki 6
  • 7.
    1. Introduction 2. IndustryTrends 3. Data Collection 4. Analysis 5. Forecast 6. Q & A Presentation Agenda James Millhiser 7
  • 8.
    1. Introduction 2. IndustryTrends 3. Data Collection 4. Analysis 5. Forecast 6. Q & A Presentation Agenda 8
  • 9.
    1. Introduction 2. IndustryTrends 3. Data Collection 4. Analysis 5. Forecast 6. Q & A Presentation Agenda Amber Templeton 9
  • 10.
    Industry Trends Image Source:http://www.techhive.com/article/2042351/us-states-attorneys-general-to-take-aim-at-internet-safe- harbor-law.html 10
  • 11.
    Demand in Market Image1 Source: http://www.amazon.com/Dell-Inspiron-i15RV-6143BLK-Touchscreen-Textured/dp/B00D9KP70G Image 2 Source: http://www.thewritingnut.com/writing-tools/setting-shop-part-4-writers-computer/ Image 3 Source: http://i-deals.in/2014/03/27/flipkart-rs-3000-smartphone-attractive-discounts-dell-venue-tablets/ 1990s: Internet and media applications Early 2000s: Laptop computers Late 2000s: Smartphones and Tablets 11
  • 12.
    Dell in theMarket 2009: Dell in smartphone market 2010: Dell in tablet market Image 1 Source: http://blogdetecnologiamoderna.com/moviles/dell-lanza-en-mexico-smartphone-mini-3ix/ Image 2 Source: http://microsoft-news.com/dell-venue-8-pro-tablet-starting-299-now-available-for-order/ 12
  • 13.
    Outside Noise Quote Source:http://www.theguardian.com/technology/2012/nov/16/dell-revenues-slump-pc-tablet- smartphone “Dell is looking like the sick man of the PC business…” 13
  • 14.
    Dell in theMarket: Outcomes 2012: Dell exits smartphone market Image 1 Source: http://blogdetecnologiamoderna.com/moviles/dell-lanza-en-mexico-smartphone-mini-3ix/ Image 2 Source: http://www.dell.com/learn/us/en/19/campaigns/laptops-tablets-coming-soon Coming Soon: The Dell Venue 8 7000 Series Android™ Tablet 14
  • 15.
    U.S. Computer Usage 0 50 100 150 200 250 300 350 400 19952000 2005 2010 2015 ComputerUsage(inmillions) Source: Computer Industry Almanac Inc. 15
  • 16.
    Dell PC Sales1997- 2014 0 2000 4000 6000 8000 10000 12000 14000 16000 18000 20000 1997 1998 1999 2000 2001 2002 2003 2004 2005 2006 2007 2008 2009 2010 2011 2012 2013 2014 Dell Total PCSales(inthousands) Source: U.S. Bureau of Labor Statistics 16
  • 17.
    Made-to-Order PCs Image Source:http://whitestoneresults.com/pay-per-click-setup-and-management/ 17
  • 18.
    Dell vs. HPPC Sales 1997- 2014 0 1000 2000 3000 4000 5000 6000 1997 1998 1999 2000 2001 2002 2003 2004 2005 2006 2007 2008 2009 2010 2011 2012 2013 2014 Dell HP PCSales(inthousands) Source: U.S. Bureau of Labor Statistics 18
  • 19.
    Our Strategy Image Source:http://www.underconsideration.com/brandnew/archives/a_dell- icate_redesign.php#.VIc7X7l0yM8 19
  • 20.
    1. Introduction 2. IndustryTrends 3. Data Collection 4. Analysis 5. Forecast 6. Q & A Presentation Agenda Rachit Jauhari 20
  • 21.
    Market Research Scan theMarket Survey Broad Research 68 Quantifiable Variables 17 Variables used in Regression Final Equation 21
  • 22.
    Market Research Scan theMarket Survey Broad Research 68 Quantifiable Variables 17 Variables used in Regression Final Equation 22
  • 23.
    Market Research Scan theMarket Survey Broad Research 68 Quantifiable Variables 17 Variables used in Regression Final Equation 23
  • 24.
    Market Research Scan theMarket Survey Broad Research 68 Quantifiable Variables 17 Variables used in Regression Final Equation 24
  • 25.
    Market Research Scan theMarket Survey Broad Research 68 Quantifiable Variables 17 Variables used in Regression Final Equation 25
  • 26.
    Market Research Potential Variables MacroEconomic Factors • Unemployment Rate • US Population • % Change in GDP Micro Economic Factor • Real PC Price Company Factor • Advertisement Cost • Customer Satisfaction Index (CSI) Trending Factor • Smartphones Sales Seasonality Factor • Quarterly Sales 26
  • 27.
    Market Research Scan theMarket Survey Broad Research 68 Quantifiable Variables 17 Variables used in Regression Final Equation 27
  • 28.
    1. Introduction 2. IndustryTrends 3. Data Collection 4. Analysis 5. Forecast 6. Q & A Presentation Agenda Ethan Yamasaki 28
  • 29.
    Analysis Dell Demand =13.03 A – 189.9 SS + 331 GDP – 1.813 RP + 2472 Key: D = Dell PC Demand (000’s) A = Dell Advertisement ($MM) SS = Smartphone Sales ($Bn) RP = Real PC Price ($) GDP = Change in GDP (%) Dell PC Demand Equation 29
  • 30.
    Analysis Dell Demand =13.03 A – 189.9 SS + 331 GDP – 1.813 RP + 2472 Key: A = Dell Advertisement ($MM) Example: If we increase advertising by $1 million, Dell Sales will increase by 13,030 units sold Dell PC Demand Equation 30
  • 31.
    Analysis Dell Demand =13.03 A – 189.9 SS + 331 GDP – 1.813 RP + 2472 Key: SS = Smartphone Sales ($B) Example: If Smartphone sales are increase by $1 billion, Dell demand falls 189,900 units. Dell PC Demand Equation 31
  • 32.
    Analysis Dell Demand =13.03 A – 189.9 SS + 331 GDP – 1.813 RP + 2472 Key: GDP = Change in GDP (%) Example: For every 1% annual GDP increase, Dell PC units sold will increase by 331,000. Dell PC Demand Equation 32
  • 33.
    Analysis Dell Demand =13.03 A – 189.9 SS + 331 GDP – 1.813 RP + 2472 Key: RP = Real PC Price ($) Example: For every $1 of the PC Market increase, PC units sold will be reduced by 1,813 . Dell PC Demand Equation 33
  • 34.
    Analysis Factor Coefficient 2014Q3 2014 Q4 2015 Q1 2015 Q2 2015 Q3 2015 Q4 Change in US GDP(%) 331.0 1.2 1.3 1.2 1.2 1.2 1.2 Real PC Price($) -1.8 60.4 59.1 58.2 57.3 56.3 55.4 US Smartphone Sales ($B) -189.9 10.3 10.4 10.5 10.7 10.8 10.9 Dell Advertisement ($M) 13.0 230.0 245.0 225.0 284.0 255.0 272.0 Constant 2472 1 1 1 1 1 1 Dell PC (000's Units) 3,796 3,994 3,690 4,432 4,029 4,225 34
  • 35.
    1. Introduction 2. IndustryTrends 3. Data Collection 4. Analysis 5. Forecast 6. Q & A Presentation Agenda James Millhiser 35
  • 36.
    Forecast - PCSales Factor 2014 Q3 2014 Q4 2015 Q1 2015 Q2 2015 Q3 2015 Q4 Dell PC (000's units) 3,796 3,994 3,690 4,432 4,029 4,225 Previous Quarter Sales (000’s units) 3,378 3,602 3,358 4,134 3,796 3,994 Increase in sales 12.4% 10.9% 9.9% 7.2% 6.1% 5.8% 36
  • 37.
    Forecast - Marketing Factor2014 Q3 2014 Q4 2015 Q1 2015 Q2 2015 Q3 2015 Q4 Dell Advertisement ($M) 230 245 225 284 255 272 Increase in Marketing, % Change from Previous Years quarter 11% 19% 10% 39% 11% 11% % Benefit from in New Marketing Plan 10% 8% 5% 19% 1% 0.0% Actual % Increase Needed 1% 11% 5% 20% 10% 11% Actual Marketing Budget ($M) 209 229 215 245 223 224 37
  • 38.
    Forecast - Marketing Factor2014 Q3 2014 Q4 2015 Q1 2015 Q2 2015 Q3 2015 Q4 Dell Advertisement ($M) 230 245 225 284 255 272 Increase in Marketing, % Change from Previous Years quarter 11% 19% 10% 39% 11% 11% % Benefit from in New Marketing Plan 10% 8% 5% 19% 1% 0.0% Actual % Increase Needed 1% 11% 5% 20% 10% 11% Actual Marketing Budget ($M) 209 229 215 245 223 224 38
  • 39.
    Forecast - Marketing Factor2014 Q3 2014 Q4 2015 Q1 2015 Q2 2015 Q3 2015 Q4 Dell Advertisement ($M) 230 245 225 284 255 272 Increase in Marketing, % Change from Previous Years quarter 11% 19% 10% 39% 11% 11% % Benefit from in New Marketing Plan 10% 8% 5% 19% 1% 0.0% Actual % Increase Needed 1% 11% 5% 20% 10% 11% Actual Marketing Budget ($M) 209 229 215 245 223 224 39
  • 40.
    Forecast - Marketing Factor2014 Q3 2014 Q4 2015 Q1 2015 Q2 2015 Q3 2015 Q4 Dell Advertisement ($M) 230 245 225 284 255 272 Increase in Marketing, % Change from Previous Years quarter 11% 19% 10% 39% 11% 11% % Benefit from in New Marketing Plan 10% 8% 5% 19% 1% 0.0% Actual % Increase Needed 1% 11% 5% 20% 10% 11% Actual Marketing Budget ($M) 209 229 215 245 223 224 40
  • 41.
    Forecast - Marketing Factor2014 Q3 2014 Q4 2015 Q1 2015 Q2 2015 Q3 2015 Q4 Dell Advertisement ($M) 230 245 225 284 255 272 Increase in Marketing, % Change from Previous Years quarter 11% 19% 10% 39% 11% 11% % Benefit from in New Marketing Plan 10% 8% 5% 19% 1% 0.0% Actual % Increase Needed 1% 11% 5% 20% 10% 11% Actual Marketing Budget ($M) 209 229 215 245 223 224 41
  • 42.
    Forecast - Marketing Factor2014 Q3 2014 Q4 2015 Q1 2015 Q2 2015 Q3 2015 Q4 Dell Advertisement ($M) 230 245 225 284 255 272 Increase in Marketing, % Change from Previous Years quarter 11% 19% 10% 39% 11% 11% % Benefit from in New Marketing Plan 10% 8% 5% 19% 1% 0.0% Actual % Increase Needed 1% 11% 5% 20% 10% 11% Actual Marketing Budget ($M) 209 229 215 245 223 224 42
  • 43.
    • Smartphone • Windows10 • Dell has come back home • New Dell, new business Marketing Strategy 43
  • 44.
    • Smartphone • Windows10 • Dell has come back home • New Dell, new business Marketing Strategy Source: PC World 44
  • 45.
  • 46.
  • 47.
    Quantifiable Variables Net salesPurchased in- process research & development expenses Special charges - executive bonus Research & development expenses Selling, general & administrative expenses Restructuring costs Cost of sales Gross margin Special charges - restructuring costs Total operating expenses Operating income (loss) Gain on non- current investments Gain from sales of investments Unrealized gain (loss) on convertible securities Interest & dividend income Interest income Interest expense Gain on sales of short term investments, net Other expense, net Other income (expense), net Interest & other income (expense), net Interest & other income (expense), net Other income/(expense), net Other income (expense), net Income (loss) before provision for income taxes Provision for (benefit from) income taxes Income (loss) before accounting change Cumulative effect of accounting change, net Net income (loss) Weighted average shares outstanding – basic Weighted average shares outstanding – diluted Year-end shares outstanding Earnings (loss) per share - continuing operations – basic Earnings (loss) per share - accounting change – basic Net earnings (loss) per share - basic Earnings (loss) per share - continuing operations – diluted Earnings (loss) per share - accounting change - diluted Net earnings (loss) per share - diluted Cash dividends declared per common share Apple CSI Personal Computers CSI Acer CSI Dell CSI Toshiba CSI HP CSI IBM CSI Compac CSI PC $ Price CPI All PC $ Price Revised Dell Sales Dell Share HP/Compac Sales HP Share % US Desktop Sales Dell Revenue Total U.S. Sale % US Notebook Sales Total % Sales Interest in US Smartphones Sales US Population Unemployment Rate Unemployment Number Real GDP Dell Advertising Apple Advertising HP Advertising Toshiba Advertising 47
  • 48.
  • 49.
    Variables Used PC PriceCPI All Real PC Price Dell Numbers Dell Share HP/ Compaq Sales HP Share Total US Computers US Population Real GDP % Change in GDP Quarter wise Sales of Dell Customer Satisfaction Index Unemployed Population in US Unemployed rate In US Dell Advertising Smartphones 49
  • 50.
    Market Research Brand Name Recognition AcquisitionsDirect Business Model of Dell Advent of Smartphones Relationship with Suppliers Leadership on Web Enterprise Customers Global Market Penetration Great Recession Economic Downturn in 2001 Interest Expense Acquisition of HP and COMPAC Income Tax Importance of I/T to the Industry Globalization of the Industry PC shipments Operating Income Inventory Gross Margin Windows 8 effect Advertising Strategy Information Systems at Dell Electronic Data Interchange(EDI) Business Vision Total Households Total Households with a computer (%) Total Households with desktop or laptop computer (%) Total households with handheld computer (%) U.S. Computer and software store sales in the U.S Households With a Computer and Internet Use at home Households With a Computer and Internet Use Dell's net revenue Apple Inc Form10q,10k Hewlett-Packard Co Form 10q,10k PC CSI HP CSI IBM CSI Compac CSI Acer CSI Toshiba CSI Technology Trends Apple CSI % US Desktop Sales % US Notebook Sale 50
  • 51.
    Analysis Ethan Model Summary S R-sqR-sq(adj) R-sq(pred) 531.448 85.23% 84.32% 82.68% Coefficients Term Coef SE Coef T-Value P-Value VIF Constant 2472 438 5.65 0.000 US Smartphone Sales ($Bn) -189.9 26.8 -7.08 0.000 2.00 Dell Advertisement ($MM) 13.03 2.37 5.50 0.000 4.12 Change in US GDP(%) 331.0 97.7 3.39 0.001 1.26 Real PC Price($) -1.813 0.187 -9.70 0.000 2.43 Regression Equation Dell PC Demand(Thd) = 2472 - 189.9 US Smartphone Sales ($Bn) + 13.03 Dell Advertisement ($MM) + 331.0 Change in US GDP(%) - 1.813 Real PC Price($) Regression Model Statistic 51
  • 52.
  • 53.
    Analysis Factor Coefficient(a) 2014_Q2(b)EffectonPCdemand(a)*(b) DellAdvertisement($MM) 13.03 203.9 2,656.5 USSmartphoneSales($Bn) -189.9 10.2 (1,934.6) ChangeinUSGDP(%) 331 1.7 551.9 RealPCPrice($) -1.813 61.3 (111.2) Constant 2472 1.0 2,472.0 D = + 13.03 A – 189.9 SS + 331 GDP – 1.813 RP+ 2472

Editor's Notes

  • #3 Allow slide to remain for a bit until audience can review and get names
  • #11 -Thank you, Colin -I will now discuss with you the trends in the PC market and where we were, where we are now, and where we are headed
  • #12 - In the 1990s, the Internet and new multimedia applications were the driving forces for the industry -At this time, competition among PC makers was rather high in order to keep up with demand, which drove PC prices downward as they began to saturate the market -In the early 2000s, the demand for laptop computers began to drive the computer market -In the late 2000s, other devices, such as smartphones and tablets, gained popularity and offered competition in the PC market -They offer similar features as PCs, such as the Internet and applications, however, they are smaller, which makes them more portable, and many times, more interactive than PCs -This provokes the notion that smartphones and tablets could be considered to be replacements for PCs, as many tablets have keyboard hook-ups, and for some individuals, the Internet capability on a smartphone may be sufficient to fulfill their computing needs -This is something our company should take into account and this will be discussed further by my colleagues later in our presentation
  • #16 -This graph represents the number of computers that have been in use in the United States over a 20-year timeframe. -As you can see, computer usage in the United States has steadily increased, and it is projected to continue to increase in 2015. -This is good news for our industry because while there may be an influx of competing technologies, demand for computer usage should continue to rise overall
  • #17 -This graph displays Dell’s overall PC sales in comparison to the total U.S. PC sales from 1997 to 2014 -As you can see, between the years of 2000 and 2001, overall PC sales in the U.S. declined -However, during this timeframe, Dell continued to increase its market share and make a profit -Although the market was saturated at this time, we were able to excel in large part due to our efficient production and distribution system and the rise in Internet usage and online shopping -As you know, our company was revolutionary to the computer industry when we entered the market due to the fact our PCs were made-to-order -Therefore, an increase in Internet usage and online shopping was beneficial for our company
  • #18 -Dell was revolutionary to the computer industry because its PCs were the first to be made-to-order; they were developed after receiving the customers’ orders, instead of being built according to forecasted demand. -Additionally, Dell’s PCs were shipped directly from Dell to the consumer, eliminating distributors entirely. -This direct sales approach was extremely beneficial, as it allowed us to differentiate ourselves with its competitors and allow for greater flexibility in pricing. -Furthermore, we had fewer returns from customers because customers were able to order precisely what they wanted
  • #19 -This graph displays Dell’s PC sales in comparison to HP’s PC sales for the same timeframe: 1997 to 2014 in order to provide a reference with one of our main competitors -As you can see, in comparison to HP, our growth was much greater until around 2009, when HP surpassed our sales and has continued this trend through present time -With increased competition, Dell no longer provides the lowest cost for PCs -Demand for high-end PCs is now increasing, so our company may want to focus on this segment of the market in our future
  • #20 -We need to continue to be the innovative brand we have been since our inception in order to drive demand and surpass our competitors once again -Now, I will turn our presentation over to my colleague Rachit, who will explain our market research.
  • #47 -Good afternoon, thank you, Colin for your kind introduction -The computer industry has changed a great deal over the years as technology advances and the advent of the Internet have greatly affected the demand for PCs