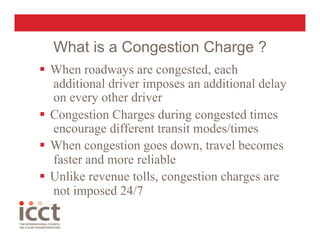
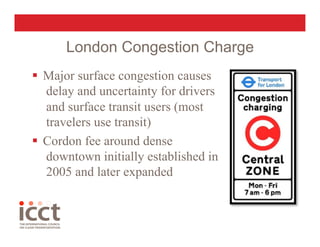
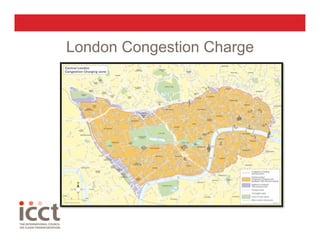
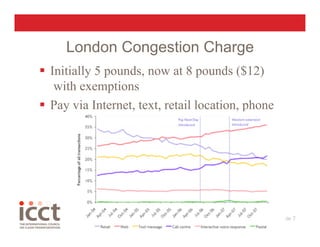
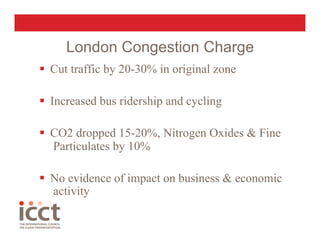
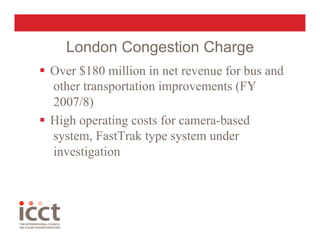
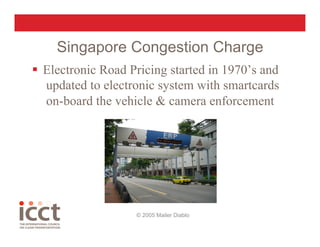
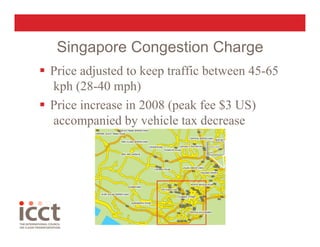
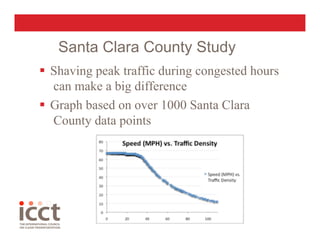
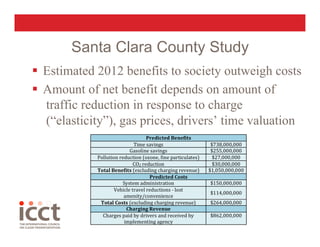
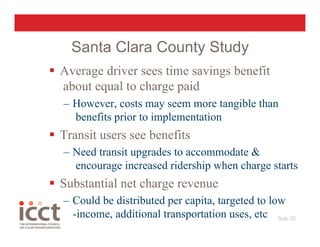
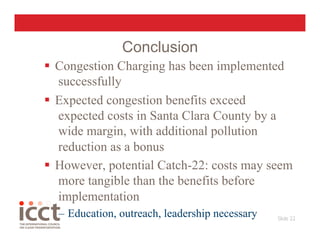
2. International Council on Clean Transportation
Goal of the ICCT is to dramatically reduce conventional pollutant and greenhouse
gas emissions from all transportation sources in order to improve air quality and
human health, and mitigate climate change.
Promotes best practices and
comprehensive solutions to:
Improve vehicle emissions and efficiency
Increase fuel quality and sustainability
of alternative fuels
Reduce pollution from the in-use fleet, and
Curtail emissions from international
goods movement.
The Council is made up of leading
regulators and experts from around
the world.
Slide 2
www.theicct.org
3. Congestion Charging Topics
What is congestion charging?
Two international examples: London and
Singapore
ICCT-sponsored Santa Clara County,
California study
4. What is a Congestion Charge ?
When roadways are congested, each
additional driver imposes an additional delay
on every other driver
Congestion Charges during congested times
encourage different transit modes/times
When congestion goes down, travel becomes
faster and more reliable
Unlike revenue tolls, congestion charges are
not imposed 24/7
5. London Congestion Charge
Major surface congestion causes
delay and uncertainty for drivers
and surface transit users (most
travelers use transit)
Cordon fee around dense
downtown initially established in
2005 and later expanded
7. London Congestion Charge
Initially 5 pounds, now at 8 pounds ($12)
with exemptions
Pay via Internet, text, retail location, phone
Slide 7
8. London Congestion Charge
Cut traffic by 20-30% in original zone
Increased bus ridership and cycling
CO2 dropped 15-20%, Nitrogen Oxides & Fine
Particulates by 10%
No evidence of impact on business & economic
activity
9. London Congestion Charge
Over $180 million in net revenue for bus and
other transportation improvements (FY
2007/8)
High operating costs for camera-based
system, FastTrak type system under
investigation
11. Singapore Congestion Charge
Price adjusted to keep traffic between 45-65
kph (28-40 mph)
Price increase in 2008 (peak fee $3 US)
accompanied by vehicle tax decrease
12. Singapore Congestion Charge
Transit share increased from 40% then to
60% now
Traffic decreased 31% in first ten years
despite 77% increase in vehicle ownership
13. What about California ?
Worst traffic in US – large city (San Jose area)
and very large city (LA area) categories
Congestion typically dips during recession,
then rebounds (red=worst, green=best)
source: Valley Transportation Authority “2008 Monitoring and
Conformance Report”
14. Santa Clara County Study
ICCT sponsored congestion charging study
for Santa Clara County - investigate
feasibility in area with diffuse development
patterns rather than compact urban core
Lead model development by consultant
Charles Komanoff
Feasibility-type study, not implementation
-type study
15. Santa Clara County Study
Pricing levels (per mile) set at different levels
for different weekday times
Off-peak, weekend travel not charged
Freeways & major arterials would be tolled
Average per trip charge during congestion
hours: $1.73
16. Santa Clara County Study
Shaving peak traffic during congested hours
can make a big difference
Graph based on over 1000 Santa Clara
County data points
17. Santa Clara County Study
Estimated 2012 benefits to society outweigh costs
Amount of net benefit depends on amount of
traffic reduction in response to charge
(“elasticity”), gas prices, drivers’ time valuation
18. Santa Clara County Study
Decreased travel time is largest projected
benefit, followed by gasoline savings
Pollution reductions are added benefit
Reduced crash costs anticipated but not
determined
Based on 2012 (assuming congestion growth
just under 1% per year)
19. Santa Clara County Study
System administration and “lost amenity” are
largest costs (lost amenity is due to a trip that
the driver decided not to take due to charge)
Congestion Charge payments/revenue are
both a cost and a benefit – substantial
revenue after paying system costs
– Need to invest in transit to encourage switching
– Can use for transportation purposes, target low
-income, and/or rebate
20. Santa Clara County Study
Average driver sees time savings benefit
about equal to charge paid
– However, costs may seem more tangible than
benefits prior to implementation
Transit users see benefits
– Need transit upgrades to accommodate &
encourage increased ridership when charge starts
Substantial net charge revenue
– Could be distributed per capita, targeted to low
-income, additional transportation uses, etc Slide 20
21. Privacy Options
Anonymous cash accounts
Smart card option would not need to collect
data on vehicle or driver (except for evaders)
“Firewalls” on data usage
Prompt data deletion
22. Conclusion
Congestion Charging has been implemented
successfully
Expected congestion benefits exceed
expected costs in Santa Clara County by a
wide margin, with additional pollution
reduction as a bonus
However, potential Catch-22: costs may seem
more tangible than the benefits before
implementation
– Education, outreach, leadership necessary Slide 22
23. Contact Information
Ed Pike, P.E.
ed@theicct.org
(415) 202-5753
www.theicct.org
Congestion charging paper:
http://www.theicct.org/programs
/climate_change/congestion_charging_paper_
25. Area-wide charging technology
examples
– European area-wide charging examples
• 7500 miles of highway in Germany using GPS for
truck tolls
• 1800 miles in Austria & Czech Republic using
overhead gantries & transponders for truck tolls
Slide 25
27. Bay Bridge vehicle tolls
Base toll of $5
Increased by $1 weekday on-peak, decreased
by $1 weekday off-peak
New carpools toll for $2.50 (half of base toll)
Implemented July 1
Revenue Toll not Congestion Charge, but
with a partial congestion component
Slide 27