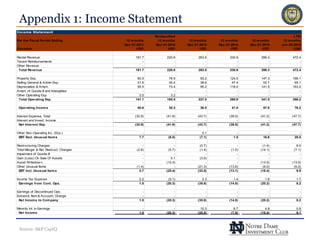
Source: Google Images
Company Buy Recommendation: CyrusOne, Inc.
Symbol: CONE
Analysts:
Carl Schiro Tom O’Connell
cschiro@nd.edu toconne2@nd.edu
Company Overview
Sources: S&P CapIQ, CONE FY 2016 10-K
Background
Revenue Breakdown
Basics of Real Estate Valuation
• CyrusOne is headquartered in Carrollton,
TX and operates 33 data center facilities
across the United States, United Kingdom,
and Singapore
• Between 2001 and 2010, the company was
strictly a regional player, largely
constrained in Texas
• After converting the company into a REIT
in 2013, CONE’s stock price has increased
163%, among the best of any publicly
traded REIT.
Background on Data Centers
Sources: S&P CapIQ, Oracle Corporation FY 2016 10-K
Key Terms
• Data Centers highly specialized buildings
which house large scale storage and server
facilities that power the internet and
corporate world.
• Data Centers have an abundance of power
supply as well as infrastructure to prevent
the servers from being taken offline.
• They also are connected to large scale fiber
optic networks to supply the appropriate
bandwidth for internet connection.
• Full scale and modern data centers can cost
over 1,200$ a month/sq foot.
• Enterprise Data Center: Centers which serve
the needs of Corporate IT centers/departments and
large scale internet enterprises. These facilities are
more exposed to competition than network dense
data centers.
• Megawatt (MW): A scale of energy/power
consumption. Equivalent to 1 Million Watts. Data
Centers use power consumption to scale usage.
Large scale facilities can use up to 40 MW which
would be enough to power 40,000 homes.
• Turn Key: Data center fully built out and ready to
be utilized immediately
• Powered Shell Center: A data center which has
tenants supply hardware
• Network Dense Data Center: A data center
which acts as a key hub and switch for internet as
well as server connectivity. Network dense data
centers are extremely rare, hard to replicate and
exhibit major pricing power. Considered to be the
data center equivalent of high productivity malls
• Interconnection: The act of multiple tenants of
data centers also serving as key internet connection
hubs as well as storage facilities for their clients
Industry Overview
Critical Components
Sources: S&P CapIQ, Oracle Corporation FY 2016 10-K
Continued
• High Speed Fiber Optic Connection: Data
Centers require major infrastructure to ensure
high speed and availably when requesting data
• Complex Power Systems: In order to
prevent shut down from power loss or
overheating, centers have numerous fail safe
systems to ensure they never go offline
• AC Systems: Servers, especially when in close
proximity to each other, run at very high
temperatures. Powerful AC units ensure
hardware stability and prevent overheating
• Telecommunication: High speed fiber optic
network cabling directly to the data center ensures
maximum connection speed from remote and
nearby locations
• Specialized Building: Raised flooring for
cabling, electrical wiring/failsafe infrastructure.
Also directly connected with fiber optic lines
• High Security/Data Backup: Data centers
contain millions of GBs of critical data which is
necessary to protect. Security measures similar to
that of a power plant are common among data
centers. Data backup is critical in the case of
potential natural disaster or catastrophic data loss
• Fireproofing: Due to the high temperature the
hardware operates at and gives off, there is an
inherent risk of fire. Elaborate fire protection
systems as well as fire proofing are critical to
datacenters
• Processing Power: Data Centers often are used
as both major internet connection switches as well
as remote storage. Data Centers need the processing
power to support both simultaneously
Components
Strategic Positioning
Source: CONE FY 2016 10-K
Strong Customer Base Massively Modular Construction Models
Strategically Located Portfolio
• Have domestic properties in 6 out of the
top 10 largest U.S cities by population and
5 out of the top 10 for Fortune 500 HQs
• Acquisition of Cervalis in NY Metropolitan
area (4 Data Centers) gives company huge
access to Wall Street
• Acquisition of CME Group in Chicago adds
more than 428,000 SF and a facility that
processed over 3.5 billion transactions in
2015
• Proprietary design principles allow CONE
to efficiently stage construction on large
scale and deliver critical power and
colocation SF (CSF) in a time frame that is
among industry best
• Recent Build-to-Market Powered Shell
facility has decreased from 8 to 6 months,
and New Data Hall has decreased from 16
to 12 weeks
• Allows cost of delivery to be less than
$6.5M per MW, below industry levels of
$7M per MW
Growth Strategy
Source: Wall street Journal, Forbes
Increase Revenue from Existing Customers
• Many existing customers still have
infrastructure needs that have not been
outsourced, which will require more space
• Over 50% of current revenue growth is from
existing customers
• Utilization rate is 86% across portfolio;
expected to increase to 95% within 2 years
• Lease escalators up 2-3% over next two years
(85% signed in last period have them)
• Can grow to of 3.5x current size with existing
development of existing powered shell &
land
• Planning on expanding into Northern
Virginia, Dallas, and Pacific Northwest (all
locations characterized as “mature growth” by
Stifel) among others in 2016 & beyond
• Recent Development Yields- San Antonio 1:
18%, Carrollton: 16%, Phoenix 1 & 2: 15%,
Houston 2: 18%, Northern Virginia: 15%
• Further expansion into Phoenix and Chicago
met with recent skepticism; however, all
100% preleased
Attracting and Retaining New Customers
• Increased complexity of managing Data
Centers are beginning to be recognized by
companies, so more will begin to outsource
needs
• Currently, Fortune 1000 customers spend
$270 million on needs, however; management
says this number could increase to $2.7 billion
in near future
• 97% service ticket satisfaction rate; 95% of
customers recommend CONE to others
New Customers
Expanding into New Markets
Growing Interconnection & Power Business
• Interconnection revenue was up 56% in Q1 2016
and 83% of all contracts signed in period
included interconnection product
• 11,000+ cross connects included in portfolio,
which is a 350% increase from 2012
• Interconnection only accounts for 6% total
revenue for CONE compared to 13% for COR
and 16% for DLR, showing room for significant
growth
• All of the new customers who took metered
power contracts had 7% admin fee included,
which will boost power reimbursement line
Risks
Reduction in Business Lease Termination
Building OwnershipElectric Power/Cooling Capabilities
• Significant portion of customers are in
industries that experience volatility,
specifically information technology (29% of
revenue), financial services (21% of
revenue), and energy (20% of revenue)
• If any customer becomes a debtor under
U.S Bankruptcy Code, laws may limit
company’s ability to terminate contract or
recover any amounts owed to us under
agreements with specific tenant
• Power and cooling systems are difficult and
expensive to upgrade
• Failure to timely upgrade or add additional
infrastructure could result in decreased
occupancy rates or density within current
facilities
• Even if successful in implementing
changes, CONE may not be able to pass on
additional costs to customers
• Significant portion of customer leases that
expire this year are on month-to-month
basis, and many of them contain early
termination provisions
• As of December 31, 2015, leases
representing 24%, 16%, and 24% of the
annualized rent portfolio will expire during
2016, 2017, and 2018, and an additional 1%
of the annualized rent for portfolio were
month-to-month leases
• Cyrus One does not own all of their
buildings, which leaves them as a risk for
altering revenue growth.
• 16 buildings are not own that account for
700,000 NRSF, 24% of total portfolio, and
33% of total revenue
Industry Overview
Source: S&P CapIQ
Cloud Computing Demand Competitors
EPS Growth (Historical and Expectd)
Digital Realty Trust (DLR)
• Digital Realty was the first public Data Center REIT
(’04).
• Owns a diverse portfolio with a large presence in
network dense areas—which prove to be some of the
most valuable and lucrative areas for Data Centers
• Recent earnings took a dip in mid-2015
• They are evenly spread across NY, VA, Dallas,
London, and San Fran. Average Cost of Capital
• Cloud computing accounted for 50% of
MW signed in 2016
Increase in Data
Competitors
CoreSite Reality (COR)
• Formed in 2001 with an IPO in 2010, CoreSite is a major
provider for cloud based storage as well as other server
needs for tech companies.
• Tom Ray, CEO, announced plans to retire at the end of
September ’16, and market doesn’t anticipate CoreSite’s
main strategy to change.
• Current NAV/share is 60.50$.
DuPont Fabros (DFT)
• IPO in 2007, DuPont typically handles large scale
customers on wholesale scale.
• Current market strategy of dealing with wholesale
leasing is well built for the current market that Data
Center REITs are currently operating in.
• Also is also currently operating at a NAV premium and
is using this as a method to approve internal
development (around 10% of portfolio)
Discounted Cash Flow
9
DCF model
$ in millions 2012 2013 2014 2015 2016E 2017E 2018E 2019E 2020E
Total Revenue $220.8 $263.5 $330.9 $399.3 $554.6 $623.3 $735.0 $815.5 $899.7
Revenue Growth 21.5% 19.3% 25.6% 20.7% 38.9% 12.4% 17.9% 11.0% 10.3%
Expenses
Property Operating Expenses 76.0 88.4 124.5 148.7 199.3 229.4 284.5 313.9 343.2
Sales and Marketing 9.7 9.9 12.8 12.1 18.7 15.6 16.0 16.5 17.0
General and Administrative 20.7 26.5 34.6 46.6 64.7 85.4 106.7 116.3 128.7
Depreciation and Amortization 73.4 89.9 118.0 141.5 174.5 189.8 224.1 244.2 270.2
Other Expenses 24.7 4.8 1.0 27.6 3.8 2.0 4.0 3.8 3.9
Operating Expenses 204.5 219.5 290.9 376.5 461.0 522.2 635.2 694.6 763.0
Operating Income 16.3 44.0 40.0 22.8 93.6 101.1 99.8 120.9 136.7
NOI 144.8 175.1 206.4 250.6 355.3 393.9 450.5 501.6 556.5
Margin 65.6% 66.5% 62.4% 62.8% 64.1% 63.2% 61.3% 61.5% 61.9%
Stock based comp 10.0 10.0 10.0 12.0 14.0 14.0 18.0 18.0 18.0
Adjusted EBITDA 99.7 143.9 168.0 176.3 282.1 304.9 341.8 383.0 424.9
Margin 45.2% 54.6% 50.8% 44.2% 50.9% 48.9% 46.5% 47.0% 47.2%
Interest Expense (38) (40) (40) (41) (54) (66) (67) (69) (70)
Net income -21.7 4.0 0.0 -18.2 39.6 35.1 32.8 51.9 66.7
Add: D&A 73.4 89.9 118.0 141.5 174.5 189.8 224.1 244.2 270.2
Less: CAPEX (205.0) (205.0) (205.0) (205.0) (205.0) (205.0) (205.0) (205.0) (205.0)
Free cash flow -153.3 -111.1 -87.0 -81.7 9.1 19.9 51.8 91.0 131.9
Growth -27.5% -21.7% -6.1% -111.2% 117.7% 160.3% 75.6% 44.9%
Unlevered Free Cash Flow
WACC 6.52%
Discount Period 1 2 3 4 5
Discount Factor 0.94 0.88 0.83 0.78 0.73
Present Value of Free Cash Flow $8.6 $17.5 $42.9 $70.7 $96.2
Comparable Analysis
10
CONE DuPont DLR COR
NominalNOI 355.29 NominalNOI 364 NominalNOI 1,355 NominalNOI $249
NominalCapRate 7.00% NominalCapRate 7.80% NominalCapRate 7.00% NominalCapRate 7.40%
CapexReserve 18.40% CapexReserve 20.00% CapexReserve 17.70% CapexReserve 17.50%
EconomicCapRate 5.71% EconomicCapRate 6.20% EconomicCapRate 5.70% EconomicCapRate 6.10%
OperatingRealEstateValue $5,075.64 OperatingRealEstateValue 4699 OperatingRealEstateValue 19,473 OperatingRealEstateValue 3,379
OperatingRealEstate $5,075.64 OperatingRealEstate OperatingRealEstate $19,473 OperatingRealEstate $3,379
Development $380.00 Development $217 Development $867 Development $316
Other $87.70 Other $224 Other $1,698 Other $41
TotalAssets $5,543.34 TotalAssets $5,139 TotalAssets $22,039 TotalAssets 3,737
Debt-MarketValue $945.90 Debt-MarketValue $1,251 Debt-MarketValue $6,760 Debt-MarketValue 508
Other $428.10 Other $175 Other $667 Other 175
PreferredStock-MarketValue $0.00 PreferredStock-MarketValue $227 PreferredStock-MarketValue $1,445 PreferredStock-MarketValue 121
TotalLiabilities $1,374.00 TotalLiabilities $1,653 TotalLiabilities $8,871 TotalLiabilities 804
NAV 4,169 NAV 3,486 NAV 13,167 NAV 2,932
DilutedShareCount 72.2 DilutedShareCount 90.2 DilutedShareCount 165 DilutedShareCount 48.5
NAV/share $57.75 NAV/share $38.75 NAV/share $80 NAV/share 60.5
MarketSharePrice 48.33 MarketSharePrice $42.36 MarketSharePrice $96.84 MarketSharePrice $76.95
Premium/Discount 19.49% Premium/Discount 9.32% Premium/Discount 21.05% Premium/Discount 27.19%
Catalysts and Portfolio Strategy
Upside Recommendation
Downside
• Strong Strategic Positioning in Market with
extremely high growth rate in future
• Growing Interconnection & Power
Reimbursement Revenue lines will provide
substantial growth in near future
• Continued Patterns of Acquisition of
Existing/New Customers and Further
Development
CyrusOne, a stock that has experienced
significant growth over the last five years, will
continue to do so in the coming years. Their
strong position in a market with two
exponential demand drivers bodes well for the
company. Currently, they are the only Data
Center REIT trading at a discount to NAV, so
value remains to be seen in their current share
price. Therefore, I recommend the Notre Dame
Investment Club purchase a stake in CONE at
a final implied share price of $55.50.• New Supply Begins to outrun demand in
Data Center REIT Industry
• Potential of growing Churn Rate with
customers experiencing increases in Lease
Rate
• Failure to continue to grow Market Share
as rates as high as the past
NAV/Share 57.75$ 75%
DCF 48.35$ 25%
Target Price 55.40$ 100%
Final Implied Price
Appendix 1: Income Statement
Source: S&P CapIQ
Income Statement
For the Fiscal Period Ending 12 months
Dec-31-2011
Reclassified
12 months
Dec-31-2012
12 months
Dec-31-2013
12 months
Dec-31-2014
12 months
Dec-31-2015
LTM
12 months
Jun-30-2016
Currency USD USD USD USD USD USD
Rental Revenue 181.7 220.8 263.5 330.9 399.3 472.4
Tenant Reimbursements - - - - - -
Other Revenue - - - - - -
Total Revenue 181.7 220.8 263.5 330.9 399.3 472.4
Property Exp. 60.5 78.5 93.2 124.5 147.3 168.1
Selling General & Admin Exp. 21.6 30.4 38.6 47.4 52.7 65.1
Depreciation & Amort. 55.5 73.4 95.2 118.0 141.5 163.0
Amort. of Goodw ill and Intangibles - - - - - -
Other Operating Exp. 3.5 3.2 - - - -
Total Operating Exp. 141.1 185.5 227.0 289.9 341.5 396.2
Operating Income 40.6 35.3 36.5 41.0 57.8 76.2
Interest Expense, Total (32.9) (41.8) (43.7) (39.5) (41.2) (47.7)
Interest and Invest. Income - - - - - -
Net Interest Exp. (32.9) (41.8) (43.7) (39.5) (41.2) (47.7)
Other Non-Operating Inc. (Exp.) - - 0.1 - - -
EBT Excl. Unusual Items 7.7 (6.5) (7.1) 1.5 16.6 28.5
Restructuring Charges - - (0.7) - (1.4) 8.0
Total Merger & Rel. Restruct. Charges (2.6) (5.7) (1.4) (1.0) (14.1) (7.1)
Impairment of Goodw ill - - - - - -
Gain (Loss) On Sale Of Assets - 0.1 (3.0) - - -
Asset Writedow n - (13.3) - - (13.5) (13.5)
Other Unusual Items (1.4) - (21.3) (13.6) (6.0) (6.0)
EBT Incl. Unusual Items 3.7 (25.4) (33.5) (13.1) (18.4) 9.9
Income Tax Expense 2.2 (5.1) 2.3 1.4 1.8 1.7
Earnings from Cont. Ops. 1.5 (20.3) (35.8) (14.5) (20.2) 8.2
Earnings of Discontinued Ops. - - - - - -
Extraord. Item & Account. Change - - - - - -
Net Income to Company 1.5 (20.3) (35.8) (14.5) (20.2) 8.2
Minority Int. in Earnings - - 10.3 6.7 4.8 0.9
Net Income 1.5 (20.3) (25.5) (7.8) (15.4) 9.1
Appendix 2: Balance Sheet
13
14
Appendix 3: Statement of Cash Flows
QUESTIONS?
Don’t hold back, regardless of your level of experience!

CONE Final (1)

  • 1.
    Source: Google Images CompanyBuy Recommendation: CyrusOne, Inc. Symbol: CONE Analysts: Carl Schiro Tom O’Connell cschiro@nd.edu toconne2@nd.edu
  • 2.
    Company Overview Sources: S&PCapIQ, CONE FY 2016 10-K Background Revenue Breakdown Basics of Real Estate Valuation • CyrusOne is headquartered in Carrollton, TX and operates 33 data center facilities across the United States, United Kingdom, and Singapore • Between 2001 and 2010, the company was strictly a regional player, largely constrained in Texas • After converting the company into a REIT in 2013, CONE’s stock price has increased 163%, among the best of any publicly traded REIT.
  • 3.
    Background on DataCenters Sources: S&P CapIQ, Oracle Corporation FY 2016 10-K Key Terms • Data Centers highly specialized buildings which house large scale storage and server facilities that power the internet and corporate world. • Data Centers have an abundance of power supply as well as infrastructure to prevent the servers from being taken offline. • They also are connected to large scale fiber optic networks to supply the appropriate bandwidth for internet connection. • Full scale and modern data centers can cost over 1,200$ a month/sq foot. • Enterprise Data Center: Centers which serve the needs of Corporate IT centers/departments and large scale internet enterprises. These facilities are more exposed to competition than network dense data centers. • Megawatt (MW): A scale of energy/power consumption. Equivalent to 1 Million Watts. Data Centers use power consumption to scale usage. Large scale facilities can use up to 40 MW which would be enough to power 40,000 homes. • Turn Key: Data center fully built out and ready to be utilized immediately • Powered Shell Center: A data center which has tenants supply hardware • Network Dense Data Center: A data center which acts as a key hub and switch for internet as well as server connectivity. Network dense data centers are extremely rare, hard to replicate and exhibit major pricing power. Considered to be the data center equivalent of high productivity malls • Interconnection: The act of multiple tenants of data centers also serving as key internet connection hubs as well as storage facilities for their clients Industry Overview
  • 4.
    Critical Components Sources: S&PCapIQ, Oracle Corporation FY 2016 10-K Continued • High Speed Fiber Optic Connection: Data Centers require major infrastructure to ensure high speed and availably when requesting data • Complex Power Systems: In order to prevent shut down from power loss or overheating, centers have numerous fail safe systems to ensure they never go offline • AC Systems: Servers, especially when in close proximity to each other, run at very high temperatures. Powerful AC units ensure hardware stability and prevent overheating • Telecommunication: High speed fiber optic network cabling directly to the data center ensures maximum connection speed from remote and nearby locations • Specialized Building: Raised flooring for cabling, electrical wiring/failsafe infrastructure. Also directly connected with fiber optic lines • High Security/Data Backup: Data centers contain millions of GBs of critical data which is necessary to protect. Security measures similar to that of a power plant are common among data centers. Data backup is critical in the case of potential natural disaster or catastrophic data loss • Fireproofing: Due to the high temperature the hardware operates at and gives off, there is an inherent risk of fire. Elaborate fire protection systems as well as fire proofing are critical to datacenters • Processing Power: Data Centers often are used as both major internet connection switches as well as remote storage. Data Centers need the processing power to support both simultaneously Components
  • 5.
    Strategic Positioning Source: CONEFY 2016 10-K Strong Customer Base Massively Modular Construction Models Strategically Located Portfolio • Have domestic properties in 6 out of the top 10 largest U.S cities by population and 5 out of the top 10 for Fortune 500 HQs • Acquisition of Cervalis in NY Metropolitan area (4 Data Centers) gives company huge access to Wall Street • Acquisition of CME Group in Chicago adds more than 428,000 SF and a facility that processed over 3.5 billion transactions in 2015 • Proprietary design principles allow CONE to efficiently stage construction on large scale and deliver critical power and colocation SF (CSF) in a time frame that is among industry best • Recent Build-to-Market Powered Shell facility has decreased from 8 to 6 months, and New Data Hall has decreased from 16 to 12 weeks • Allows cost of delivery to be less than $6.5M per MW, below industry levels of $7M per MW
  • 6.
    Growth Strategy Source: Wallstreet Journal, Forbes Increase Revenue from Existing Customers • Many existing customers still have infrastructure needs that have not been outsourced, which will require more space • Over 50% of current revenue growth is from existing customers • Utilization rate is 86% across portfolio; expected to increase to 95% within 2 years • Lease escalators up 2-3% over next two years (85% signed in last period have them) • Can grow to of 3.5x current size with existing development of existing powered shell & land • Planning on expanding into Northern Virginia, Dallas, and Pacific Northwest (all locations characterized as “mature growth” by Stifel) among others in 2016 & beyond • Recent Development Yields- San Antonio 1: 18%, Carrollton: 16%, Phoenix 1 & 2: 15%, Houston 2: 18%, Northern Virginia: 15% • Further expansion into Phoenix and Chicago met with recent skepticism; however, all 100% preleased Attracting and Retaining New Customers • Increased complexity of managing Data Centers are beginning to be recognized by companies, so more will begin to outsource needs • Currently, Fortune 1000 customers spend $270 million on needs, however; management says this number could increase to $2.7 billion in near future • 97% service ticket satisfaction rate; 95% of customers recommend CONE to others New Customers Expanding into New Markets Growing Interconnection & Power Business • Interconnection revenue was up 56% in Q1 2016 and 83% of all contracts signed in period included interconnection product • 11,000+ cross connects included in portfolio, which is a 350% increase from 2012 • Interconnection only accounts for 6% total revenue for CONE compared to 13% for COR and 16% for DLR, showing room for significant growth • All of the new customers who took metered power contracts had 7% admin fee included, which will boost power reimbursement line
  • 7.
    Risks Reduction in BusinessLease Termination Building OwnershipElectric Power/Cooling Capabilities • Significant portion of customers are in industries that experience volatility, specifically information technology (29% of revenue), financial services (21% of revenue), and energy (20% of revenue) • If any customer becomes a debtor under U.S Bankruptcy Code, laws may limit company’s ability to terminate contract or recover any amounts owed to us under agreements with specific tenant • Power and cooling systems are difficult and expensive to upgrade • Failure to timely upgrade or add additional infrastructure could result in decreased occupancy rates or density within current facilities • Even if successful in implementing changes, CONE may not be able to pass on additional costs to customers • Significant portion of customer leases that expire this year are on month-to-month basis, and many of them contain early termination provisions • As of December 31, 2015, leases representing 24%, 16%, and 24% of the annualized rent portfolio will expire during 2016, 2017, and 2018, and an additional 1% of the annualized rent for portfolio were month-to-month leases • Cyrus One does not own all of their buildings, which leaves them as a risk for altering revenue growth. • 16 buildings are not own that account for 700,000 NRSF, 24% of total portfolio, and 33% of total revenue
  • 8.
    Industry Overview Source: S&PCapIQ Cloud Computing Demand Competitors EPS Growth (Historical and Expectd) Digital Realty Trust (DLR) • Digital Realty was the first public Data Center REIT (’04). • Owns a diverse portfolio with a large presence in network dense areas—which prove to be some of the most valuable and lucrative areas for Data Centers • Recent earnings took a dip in mid-2015 • They are evenly spread across NY, VA, Dallas, London, and San Fran. Average Cost of Capital • Cloud computing accounted for 50% of MW signed in 2016 Increase in Data Competitors CoreSite Reality (COR) • Formed in 2001 with an IPO in 2010, CoreSite is a major provider for cloud based storage as well as other server needs for tech companies. • Tom Ray, CEO, announced plans to retire at the end of September ’16, and market doesn’t anticipate CoreSite’s main strategy to change. • Current NAV/share is 60.50$. DuPont Fabros (DFT) • IPO in 2007, DuPont typically handles large scale customers on wholesale scale. • Current market strategy of dealing with wholesale leasing is well built for the current market that Data Center REITs are currently operating in. • Also is also currently operating at a NAV premium and is using this as a method to approve internal development (around 10% of portfolio)
  • 9.
    Discounted Cash Flow 9 DCFmodel $ in millions 2012 2013 2014 2015 2016E 2017E 2018E 2019E 2020E Total Revenue $220.8 $263.5 $330.9 $399.3 $554.6 $623.3 $735.0 $815.5 $899.7 Revenue Growth 21.5% 19.3% 25.6% 20.7% 38.9% 12.4% 17.9% 11.0% 10.3% Expenses Property Operating Expenses 76.0 88.4 124.5 148.7 199.3 229.4 284.5 313.9 343.2 Sales and Marketing 9.7 9.9 12.8 12.1 18.7 15.6 16.0 16.5 17.0 General and Administrative 20.7 26.5 34.6 46.6 64.7 85.4 106.7 116.3 128.7 Depreciation and Amortization 73.4 89.9 118.0 141.5 174.5 189.8 224.1 244.2 270.2 Other Expenses 24.7 4.8 1.0 27.6 3.8 2.0 4.0 3.8 3.9 Operating Expenses 204.5 219.5 290.9 376.5 461.0 522.2 635.2 694.6 763.0 Operating Income 16.3 44.0 40.0 22.8 93.6 101.1 99.8 120.9 136.7 NOI 144.8 175.1 206.4 250.6 355.3 393.9 450.5 501.6 556.5 Margin 65.6% 66.5% 62.4% 62.8% 64.1% 63.2% 61.3% 61.5% 61.9% Stock based comp 10.0 10.0 10.0 12.0 14.0 14.0 18.0 18.0 18.0 Adjusted EBITDA 99.7 143.9 168.0 176.3 282.1 304.9 341.8 383.0 424.9 Margin 45.2% 54.6% 50.8% 44.2% 50.9% 48.9% 46.5% 47.0% 47.2% Interest Expense (38) (40) (40) (41) (54) (66) (67) (69) (70) Net income -21.7 4.0 0.0 -18.2 39.6 35.1 32.8 51.9 66.7 Add: D&A 73.4 89.9 118.0 141.5 174.5 189.8 224.1 244.2 270.2 Less: CAPEX (205.0) (205.0) (205.0) (205.0) (205.0) (205.0) (205.0) (205.0) (205.0) Free cash flow -153.3 -111.1 -87.0 -81.7 9.1 19.9 51.8 91.0 131.9 Growth -27.5% -21.7% -6.1% -111.2% 117.7% 160.3% 75.6% 44.9% Unlevered Free Cash Flow WACC 6.52% Discount Period 1 2 3 4 5 Discount Factor 0.94 0.88 0.83 0.78 0.73 Present Value of Free Cash Flow $8.6 $17.5 $42.9 $70.7 $96.2
  • 10.
    Comparable Analysis 10 CONE DuPontDLR COR NominalNOI 355.29 NominalNOI 364 NominalNOI 1,355 NominalNOI $249 NominalCapRate 7.00% NominalCapRate 7.80% NominalCapRate 7.00% NominalCapRate 7.40% CapexReserve 18.40% CapexReserve 20.00% CapexReserve 17.70% CapexReserve 17.50% EconomicCapRate 5.71% EconomicCapRate 6.20% EconomicCapRate 5.70% EconomicCapRate 6.10% OperatingRealEstateValue $5,075.64 OperatingRealEstateValue 4699 OperatingRealEstateValue 19,473 OperatingRealEstateValue 3,379 OperatingRealEstate $5,075.64 OperatingRealEstate OperatingRealEstate $19,473 OperatingRealEstate $3,379 Development $380.00 Development $217 Development $867 Development $316 Other $87.70 Other $224 Other $1,698 Other $41 TotalAssets $5,543.34 TotalAssets $5,139 TotalAssets $22,039 TotalAssets 3,737 Debt-MarketValue $945.90 Debt-MarketValue $1,251 Debt-MarketValue $6,760 Debt-MarketValue 508 Other $428.10 Other $175 Other $667 Other 175 PreferredStock-MarketValue $0.00 PreferredStock-MarketValue $227 PreferredStock-MarketValue $1,445 PreferredStock-MarketValue 121 TotalLiabilities $1,374.00 TotalLiabilities $1,653 TotalLiabilities $8,871 TotalLiabilities 804 NAV 4,169 NAV 3,486 NAV 13,167 NAV 2,932 DilutedShareCount 72.2 DilutedShareCount 90.2 DilutedShareCount 165 DilutedShareCount 48.5 NAV/share $57.75 NAV/share $38.75 NAV/share $80 NAV/share 60.5 MarketSharePrice 48.33 MarketSharePrice $42.36 MarketSharePrice $96.84 MarketSharePrice $76.95 Premium/Discount 19.49% Premium/Discount 9.32% Premium/Discount 21.05% Premium/Discount 27.19%
  • 11.
    Catalysts and PortfolioStrategy Upside Recommendation Downside • Strong Strategic Positioning in Market with extremely high growth rate in future • Growing Interconnection & Power Reimbursement Revenue lines will provide substantial growth in near future • Continued Patterns of Acquisition of Existing/New Customers and Further Development CyrusOne, a stock that has experienced significant growth over the last five years, will continue to do so in the coming years. Their strong position in a market with two exponential demand drivers bodes well for the company. Currently, they are the only Data Center REIT trading at a discount to NAV, so value remains to be seen in their current share price. Therefore, I recommend the Notre Dame Investment Club purchase a stake in CONE at a final implied share price of $55.50.• New Supply Begins to outrun demand in Data Center REIT Industry • Potential of growing Churn Rate with customers experiencing increases in Lease Rate • Failure to continue to grow Market Share as rates as high as the past NAV/Share 57.75$ 75% DCF 48.35$ 25% Target Price 55.40$ 100% Final Implied Price
  • 12.
    Appendix 1: IncomeStatement Source: S&P CapIQ Income Statement For the Fiscal Period Ending 12 months Dec-31-2011 Reclassified 12 months Dec-31-2012 12 months Dec-31-2013 12 months Dec-31-2014 12 months Dec-31-2015 LTM 12 months Jun-30-2016 Currency USD USD USD USD USD USD Rental Revenue 181.7 220.8 263.5 330.9 399.3 472.4 Tenant Reimbursements - - - - - - Other Revenue - - - - - - Total Revenue 181.7 220.8 263.5 330.9 399.3 472.4 Property Exp. 60.5 78.5 93.2 124.5 147.3 168.1 Selling General & Admin Exp. 21.6 30.4 38.6 47.4 52.7 65.1 Depreciation & Amort. 55.5 73.4 95.2 118.0 141.5 163.0 Amort. of Goodw ill and Intangibles - - - - - - Other Operating Exp. 3.5 3.2 - - - - Total Operating Exp. 141.1 185.5 227.0 289.9 341.5 396.2 Operating Income 40.6 35.3 36.5 41.0 57.8 76.2 Interest Expense, Total (32.9) (41.8) (43.7) (39.5) (41.2) (47.7) Interest and Invest. Income - - - - - - Net Interest Exp. (32.9) (41.8) (43.7) (39.5) (41.2) (47.7) Other Non-Operating Inc. (Exp.) - - 0.1 - - - EBT Excl. Unusual Items 7.7 (6.5) (7.1) 1.5 16.6 28.5 Restructuring Charges - - (0.7) - (1.4) 8.0 Total Merger & Rel. Restruct. Charges (2.6) (5.7) (1.4) (1.0) (14.1) (7.1) Impairment of Goodw ill - - - - - - Gain (Loss) On Sale Of Assets - 0.1 (3.0) - - - Asset Writedow n - (13.3) - - (13.5) (13.5) Other Unusual Items (1.4) - (21.3) (13.6) (6.0) (6.0) EBT Incl. Unusual Items 3.7 (25.4) (33.5) (13.1) (18.4) 9.9 Income Tax Expense 2.2 (5.1) 2.3 1.4 1.8 1.7 Earnings from Cont. Ops. 1.5 (20.3) (35.8) (14.5) (20.2) 8.2 Earnings of Discontinued Ops. - - - - - - Extraord. Item & Account. Change - - - - - - Net Income to Company 1.5 (20.3) (35.8) (14.5) (20.2) 8.2 Minority Int. in Earnings - - 10.3 6.7 4.8 0.9 Net Income 1.5 (20.3) (25.5) (7.8) (15.4) 9.1
  • 13.
  • 14.
  • 15.
    QUESTIONS? Don’t hold back,regardless of your level of experience!