This document discusses predicting the setting of concrete mixtures through experimental work conducted under laboratory and field conditions. The key points are:
1) Initial and final setting times were determined using penetration resistance testing on concrete mixtures with varying temperatures, cements, and supplementary cementing materials.
2) A model is presented to correlate setting times to the degree of hydration, which characterizes the formation of hydration products over time. Initial and final set are found to occur at consistent degrees of hydration regardless of curing conditions.
3) Models are developed to predict setting based on the degree of hydration and water-cementitious ratio, accounting for temperature effects through an equivalent age maturity function.
Optimum replacement depth to control heave of swelling claysAhmed Ebid
The behavior of unsaturated swelling soils under changing of moisture content was intensively studied by many researchers since the 1950’s. Many proposed formulas and techniques were used to classify, describe and predict the swelling behavior and parameters of such type of soil. On the other hand, many techniques are used to allow structures to be founded on swelling soils without suffering any damages due to the soil heave. Replacing the swelling soil with granular mixture is one of the most famous and cheapest techniques especially in case of light structures on shallow layer of swelling soil. The aim of this research is to develop a simplified formula to estimate the heave of swelling soil considering the effect of replaced layer. The developed formula is used to estimate the required replacement depth to avoid damage due to excessive heave.
The Effect of Climatic Conditions of Various Regions of Iran on Pavement Fati...IDES Editor
In this research, climatic data for various regions of
Iran were obtained from meteorological organizations in their
original formats and then were converted to ICM1 input files
for MEPDG2 software by algorithms. The major aim of this
research is to assess the environmental effects on fatigue
cracking, so more than 300 analyses were conducted on a
specific pavement with climatic data from various regions of
Iran, since pavement temperature and humidity profile have
important effects on alligator and longitudinal cracking, and
specific pavements don’t have the same performance in all
regions. Lastly, useful solutions will be recommended for
decreasing the deleterious effects of climatic conditions on
fatigue cracking
Permeability Evaluation in Pilaspi (M. Eocene - U. Eocene) FormationIJERA Editor
Studying the permeability in a particular formation will be our address in this paper, through collection of a set of data in relates to the past real core analyses by the oil operators and correlating them to our lab works on the samples of the same formation from Pilaspi formation (M.EOCENE - U.EOCENE) outcrop on Haibat Sultan Mountain near Taq Taq oil Field. Lab works were done in Koya University using most of reservoir lab equipments for getting and determining the most important properties like porosity and permeability on plug samples of that formation. The key study in this paper is oil well TT-02 in Taq Taq oil field. In this paper we will try to nominate and recognize the more active porosity type through measuring air and liquid permeability in our reservoir lab and show the effects of increasing flowing pressure on the permeability using saturated and dry core plug. Water and air were used as flowing fluids and two methods were used to measure the permeability; steady-state method, measures the permeability of a saturated Core plug under constant flow rate conditions and air permeability with (N2) for dry core plug.
This paper presents the effectiveness and assessment of the potential of the vacuum consolidation using Prefabricated Vertical Drain, in Mumbai marine clay, as more economical and effective method of consolidation. Large 3-D consolidation cell was designed to carry out laboratory experiments on the reconstituted soft marine clay from the project site at New Mumbai, western part of the India. Various combinations of the surcharge and vacuum loading with PVD were tested and examined. The study showed that method is feasible and save significant time for the consolidation process in turn saving in construction time of foundation on soft marine clay. The strength and stability of the clay also enhances greatly. This paper examines the applicability of Asaoka method to predict settlement of Mumbai Marine clay. An overview is also provided to some geotechnical properties such as density, moisture content, void ratio and shear strength which are predominantly affected during the vacuum preloading system. The settlement analysis was conducted using conventional solution by Hansbo and Asaoka.. The hydraulic conductivity of reconstituted specimen was back calculated. The Back calculated coefficient of radial consolidation was observed in the range of 1.45 to 2.27 m2/year and ratio of ch/cv.odeo was found to be 1.5 to 2. The addition of vacuum pressure tends to increase horizontal coefficient of consolidation leads to shorten the preloading time t by 15 to 80 % depending on the vacuum preload magnitude. The attempt is also made to find out kh/ks values for the selected soil specimen. It was observed that kh/ks value for Mumbai marine clay is about 1.50.
Laboratory experimental study and elastic wave velocity on physical propertie...HoangTienTrung1
Pressure grouting has gained popularity as a soil reinforcement method. However, the behavior of the interface between rock and grout is not well known. This study investigates the interaction of pressure grouting and rock, through a series of laboratory tests performed on specially designed and fabricated equipment and using standard testing methods. The test measures the density, compressional strength, and frictional resistance of grout relative to the applied pressure and curing time. Simultaneously, the velocities of the elastic wave traveling through the grout are obtained to develop correlations between the physical properties of the grout and the test conditions. The results of the tests show that the density, compressional strength, and frictional resistance of the grout increase with applied pressure and curing time. The strengths of the influencing factors are seen to be correlated within the range of the test conditions. Using the results of these tests, the potential development of a new method that requires less cement was discussed.
ANALYSIS OF POSSIBILITY OF GROWTH OF SEVERAL EPITAXIAL LAYERS SIMULTANEOUSLY ...ijoejournal
We analyzed nonlinear model with varying in space and time coefficients of growth of epitaxial layers
from gas phase in a vertical reactor with account native convection. We formulate several conditions to
increase homogeneity of epitaxial layers with varying of technological process parameters.
Seismic performance of a layered liquefiable site validation of numerical sim...Mahir Badanagki, Ph.D.
In this paper, the results of a centrifuge experiment modeling of a layered soil profile, including a liquefiable layer of Ottawa sand, are used to evaluate the predictive capabilities of two state ofthe-art constitutive models.
Finite element simulation and investigation of thin wall impeller casting ija...Dr.Vikas Deulgaonkar
In case of casting of thin wall impeller structure, the prediction of shrinkage defect is a difficult operation and failure of such thin wall structure is a commonly encountered problem. Such failures are due to non-uniform heat transfer rate. The uniformity of heat transfer rate may enhance by placing the runner at appropriate position and riser based on the geometrical attributes. An attempt is made for the analysis of optimization in the placement of runner and riser. The present work focuses on the simulation of aluminum thin wall pump impeller blade using commercially available software (ANSYS) and experiments for optimum placement of risers and reducing defects.
Heat transfer studies were carried out in a laboratory scale gas-solid fluidized bed with 0.1m
ID x 1 m length column, using three sizes of local sand particles of 301, 454, and 560 µm. the bed
region was heated bya horizontal heat transfer probe. It was made of copper rod (15 mm ODx50 mm
long) and insulated at the ends by Teflon. A hole was drilled at the center of the rod to accommodate
a cartridge heater 200 W (6.5 mm OD x 42 mm long). Three bed inventories of sand 1.5 kg, 2.0 kg,
and 2.5 kg, four superficial air velocities of 1.0 m/s, 1.25 m/s, 1.5 m/s, 1.75 m/s were used. Three
heat fluxes of 1698.9, 2928.4, 4675.7 W m-2 were employed. The data obtained showed how the heat
transfer coefficient effected by the above operating parameters. The heat transfer coefficient is
directly proportional with air superficial velocity as well as the bed inventory and heat fluxes but
inversely proportional with sand particles size.
The Rheological and Empirical Characteristics of Steel Fibre Reinforced Self-...Roy Belton
Investigating whether a correlation exists between rheology and empiricism for various steel fibre self-compacting concrete mixtures with additional cementitious additions (such as PFA and GGBS).
International Journal of Engineering Research and Applications (IJERA) is an open access online peer reviewed international journal that publishes research and review articles in the fields of Computer Science, Neural Networks, Electrical Engineering, Software Engineering, Information Technology, Mechanical Engineering, Chemical Engineering, Plastic Engineering, Food Technology, Textile Engineering, Nano Technology & science, Power Electronics, Electronics & Communication Engineering, Computational mathematics, Image processing, Civil Engineering, Structural Engineering, Environmental Engineering, VLSI Testing & Low Power VLSI Design etc.
International Journal of Engineering and Science Invention (IJESI) is an international journal intended for professionals and researchers in all fields of computer science and electronics. IJESI publishes research articles and reviews within the whole field Engineering Science and Technology, new teaching methods, assessment, validation and the impact of new technologies and it will continue to provide information on the latest trends and developments in this ever-expanding subject. The publications of papers are selected through double peer reviewed to ensure originality, relevance, and readability. The articles published in our journal can be accessed online.
Investigation of Different Types of Cement Material on Thermal Properties of ...IJERA Editor
One of the challenges in sustainable development is to optimize the energy efficiency of buildings during their
lifespan. Nowadays the applying of different types of cements in modern concretes provide low embodied CO2
with the intrinsic property called “thermal mass” that reduces the risk of overheating in the summer and
provides passive heating in the winter. Thermal mass is affected by thermal properties of concrete which it is the
ability of the element to exchange heat with the environment and is based on thermal capacity, conductivity, and
density. Laboratory experiments measured density, specific capacity and thermal conductivity of sustainable
concrete mixes with various percentages of GGBS, PFA, SF. The results contribute to the investigation of the
performance of thermal properties performance in sustainable concrete.
Creep is defined as the plastic deformation under sustain load. Creep strain depends
primarily on the duration of sustained loading. It has been widely acknowledged that creep of
concrete is greatly influenced by the surrounding ambient. Creep induces the deflection of the
structural member with time. Hence the study on creep of concrete is necessary to prevent failure. A
concrete cylinder is casted for two different grades and the load of 40% of its compressive strength
is applied constantly. Creep is measured with time. A time - dependent creep is provided in a graph
showing its variation.
The sun is the source of solar energy and the solar energy is pollution free and available in ample amount which can be used for heating, electricity generation and coking purpose.The position of sun constantly varies so its intensity also varies which affect the heat quantity incident upon the system. The aim of present work is overcome this difficultly using wax type phase change material which behaves like heat storage medium as position of sun changes. This phase change material based solar water heater is fabricated and thermal performance evaluation can be carried out using K type thermocouple.
Affordable Stationery Printing Services in Jaipur | Navpack n PrintNavpack & Print
Looking for professional printing services in Jaipur? Navpack n Print offers high-quality and affordable stationery printing for all your business needs. Stand out with custom stationery designs and fast turnaround times. Contact us today for a quote!
Personal Brand Statement:
As an Army veteran dedicated to lifelong learning, I bring a disciplined, strategic mindset to my pursuits. I am constantly expanding my knowledge to innovate and lead effectively. My journey is driven by a commitment to excellence, and to make a meaningful impact in the world.
[Note: This is a partial preview. To download this presentation, visit:
https://www.oeconsulting.com.sg/training-presentations]
Sustainability has become an increasingly critical topic as the world recognizes the need to protect our planet and its resources for future generations. Sustainability means meeting our current needs without compromising the ability of future generations to meet theirs. It involves long-term planning and consideration of the consequences of our actions. The goal is to create strategies that ensure the long-term viability of People, Planet, and Profit.
Leading companies such as Nike, Toyota, and Siemens are prioritizing sustainable innovation in their business models, setting an example for others to follow. In this Sustainability training presentation, you will learn key concepts, principles, and practices of sustainability applicable across industries. This training aims to create awareness and educate employees, senior executives, consultants, and other key stakeholders, including investors, policymakers, and supply chain partners, on the importance and implementation of sustainability.
LEARNING OBJECTIVES
1. Develop a comprehensive understanding of the fundamental principles and concepts that form the foundation of sustainability within corporate environments.
2. Explore the sustainability implementation model, focusing on effective measures and reporting strategies to track and communicate sustainability efforts.
3. Identify and define best practices and critical success factors essential for achieving sustainability goals within organizations.
CONTENTS
1. Introduction and Key Concepts of Sustainability
2. Principles and Practices of Sustainability
3. Measures and Reporting in Sustainability
4. Sustainability Implementation & Best Practices
To download the complete presentation, visit: https://www.oeconsulting.com.sg/training-presentations
Attending a job Interview for B1 and B2 Englsih learnersErika906060
It is a sample of an interview for a business english class for pre-intermediate and intermediate english students with emphasis on the speking ability.
3.0 Project 2_ Developing My Brand Identity Kit.pptxtanyjahb
A personal brand exploration presentation summarizes an individual's unique qualities and goals, covering strengths, values, passions, and target audience. It helps individuals understand what makes them stand out, their desired image, and how they aim to achieve it.
The world of search engine optimization (SEO) is buzzing with discussions after Google confirmed that around 2,500 leaked internal documents related to its Search feature are indeed authentic. The revelation has sparked significant concerns within the SEO community. The leaked documents were initially reported by SEO experts Rand Fishkin and Mike King, igniting widespread analysis and discourse. For More Info:- https://news.arihantwebtech.com/search-disrupted-googles-leaked-documents-rock-the-seo-world/
Skye Residences | Extended Stay Residences Near Toronto Airportmarketingjdass
Experience unparalleled EXTENDED STAY and comfort at Skye Residences located just minutes from Toronto Airport. Discover sophisticated accommodations tailored for discerning travelers.
Website Link :
https://skyeresidences.com/
https://skyeresidences.com/about-us/
https://skyeresidences.com/gallery/
https://skyeresidences.com/rooms/
https://skyeresidences.com/near-by-attractions/
https://skyeresidences.com/commute/
https://skyeresidences.com/contact/
https://skyeresidences.com/queen-suite-with-sofa-bed/
https://skyeresidences.com/queen-suite-with-sofa-bed-and-balcony/
https://skyeresidences.com/queen-suite-with-sofa-bed-accessible/
https://skyeresidences.com/2-bedroom-deluxe-queen-suite-with-sofa-bed/
https://skyeresidences.com/2-bedroom-deluxe-king-queen-suite-with-sofa-bed/
https://skyeresidences.com/2-bedroom-deluxe-queen-suite-with-sofa-bed-accessible/
#Skye Residences Etobicoke, #Skye Residences Near Toronto Airport, #Skye Residences Toronto, #Skye Hotel Toronto, #Skye Hotel Near Toronto Airport, #Hotel Near Toronto Airport, #Near Toronto Airport Accommodation, #Suites Near Toronto Airport, #Etobicoke Suites Near Airport, #Hotel Near Toronto Pearson International Airport, #Toronto Airport Suite Rentals, #Pearson Airport Hotel Suites
Putting the SPARK into Virtual Training.pptxCynthia Clay
This 60-minute webinar, sponsored by Adobe, was delivered for the Training Mag Network. It explored the five elements of SPARK: Storytelling, Purpose, Action, Relationships, and Kudos. Knowing how to tell a well-structured story is key to building long-term memory. Stating a clear purpose that doesn't take away from the discovery learning process is critical. Ensuring that people move from theory to practical application is imperative. Creating strong social learning is the key to commitment and engagement. Validating and affirming participants' comments is the way to create a positive learning environment.
Buy Verified PayPal Account | Buy Google 5 Star Reviewsusawebmarket
Buy Verified PayPal Account
Looking to buy verified PayPal accounts? Discover 7 expert tips for safely purchasing a verified PayPal account in 2024. Ensure security and reliability for your transactions.
PayPal Services Features-
🟢 Email Access
🟢 Bank Added
🟢 Card Verified
🟢 Full SSN Provided
🟢 Phone Number Access
🟢 Driving License Copy
🟢 Fasted Delivery
Client Satisfaction is Our First priority. Our services is very appropriate to buy. We assume that the first-rate way to purchase our offerings is to order on the website. If you have any worry in our cooperation usually You can order us on Skype or Telegram.
24/7 Hours Reply/Please Contact
usawebmarketEmail: support@usawebmarket.com
Skype: usawebmarket
Telegram: @usawebmarket
WhatsApp: +1(218) 203-5951
USA WEB MARKET is the Best Verified PayPal, Payoneer, Cash App, Skrill, Neteller, Stripe Account and SEO, SMM Service provider.100%Satisfection granted.100% replacement Granted.
Accpac to QuickBooks Conversion Navigating the Transition with Online Account...PaulBryant58
This article provides a comprehensive guide on how to
effectively manage the convert Accpac to QuickBooks , with a particular focus on utilizing online accounting services to streamline the process.
Accpac to QuickBooks Conversion Navigating the Transition with Online Account...
concrete-setting
1. PREDICTION OF CONCRETE SETTING
Anton K. Schindler
Department of Civil Engineering, Auburn University, Alabama, U.S.A.
Abstract
With knowledge of the time to initial set, contractors will be able plan measures to finish,
texture, and saw cut concrete pavements on time. The point at which final set occurs is of
importance, since it provides an estimate of when the concrete strength and stiffness
development will start. In this study, experimental work was performed under laboratory and
field conditions to determine the effect of temperature, different cements, and supplementary
cementing materials on the initial and final setting times of concrete mixtures. The objectives
of this paper are to present and calibrate a setting model that correlates the degree of hydration
to the setting times collected under laboratory and field conditions. Initial and final set times
of the concrete were determined with penetration resistance testing. Field data were collected
from seven concrete pavement projects paved throughout the year, in different climatic regions.
The results indicate that final setting occurs at approximately the same degree of hydration for
a particular mixture irrespective of the curing history. This observation is also true for the
initial set condition. Models are developed to predict the setting of concrete with the degree of
hydration and the water-cementitious materials ratio as variables.
1. Introduction
Setting of concrete is the gradual transition from liquid to solid, and the definition of any point
at which the paste is considered set, is somewhat arbitrary [1]. Final setting of concrete relates
to the point where stresses and stiffness start to develop in freshly placed concrete. It has been
reported that the initial thermal gradient at setting (built-in curling) has a major impact on the
long-term performance of jointed concrete pavements [2]. With a model to predict concrete
setting and a model to predict the development of in-place concrete temperatures, the thermal
gradients at final set can be estimated and used during pavement design. Initial set is of
importance, as it provides an estimate of when the concrete has reached the point where it has
stiffened to such an extent that it can no longer be vibrated without damaging the concrete.
Under hot weather conditions, the time to initial set will be shorter than under normal
temperatures, which will affect the construction crew’s ability to consolidate and finish the inplace concrete. Under cold weather conditions the time to initial set is extended and the
potential of plastic shrinkage cracking occurring in the fresh concrete is extended. With
knowledge of the time to initial set, contractors would be able to plan measures to finish and
texture a concrete pavement on time to avoid that initial setting occurs before these activities.
SCHINDLER, Prediction of Concrete Setting, 1/14
Fax: (334) 844-6290
E-mail: antons@eng.auburn.edu
2. Experimental work was performed for this study under laboratory and field conditions to
determine the effect of temperature, different cements, and supplementary cementing materials
(SCMs) on the initial and final setting times. The objectives of this paper are to present and
calibrate a setting model to characterize setting times collected under laboratory and field
conditions.
2. Background and approach
The curing temperature of the concrete is arguably the variable that has the most significant
effect on the concrete’s setting time. In this paper the maturity method is used to account for
the effect of temperature and time on the development of hydration products. The equivalent
age maturity function shown in Equation 1, as developed by Freiesleben Hansen and Pedersen
[3], is widely accepted as the most accurate maturity formulation [4].
where,
te(Tr)
∆t
Tc
Tr
E
R
=
=
=
=
=
=
t
E
0
te (Tr ) =
1
∑ exp R 273 + T
r
−
1
⋅∆t
273 + Tc
(1)
equivalent age at the reference curing temperature (hours),
chronological time interval (hours),
average concrete temperature during the time interval, ∆t, (°C),
constant reference temperature (°C),
activation energy (J/mol), and
universal gas constant (8.3144 J/mol/K).
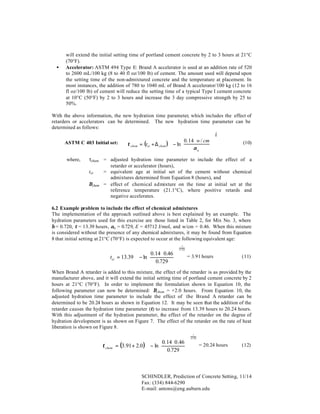
ASTM C 403 [5], “Standard Test Method for Time of Setting of Concrete Mixtures by
Penetration Resistance”, defines setting of the concrete in terms of initial and final set. A
mortar sample is obtained from concrete by wet sieving, and the force required to penetrate
needles of different sizes into the mortar is measured. At a penetration resistance of 3.4 MPa
(500 psi), initial setting occurs, which was chosen to correspond with the time when the
concrete can no longer be vibrated [6]. Tuthill and Cordon [6] determined that at a penetration
resistance of 27.6 MPa (4000 psi) the concrete has reached a compressive strength of around
0.6 MPa (80 psi) and it could carry some measurable loads.
Pinto and Hover [7] evaluated how different temperatures affected the setting time in terms of
the penetration resistance method described by ASTM C 403. Pinto and Hover [7] stated that
although “... the setting process is influenced by the rheology effects of the water-cement ratio
(w/c), aggregates, air voids, bleeding, and evaporation, setting is primarily influenced by
hydration of the cement.” Although the final set test results of Pinto and Hover [7] varied
considerably when tested at different temperatures, they concluded that the computed
equivalent age at setting was much more uniform for each mixture. This indicates that for any
given concrete mixture, final set occurs when a specific level of microstructure development
(degree of hydration) has occurred.
Test data from an adiabatic calorimeter provide a means to quantify the heat of hydration
development as the hydration of the mixture progresses [8,9]. It has been shown and it is
widely accepted that the ratio of the heat development as compared to the maximum heat
available in the system is an accurate and practical method to quantify the degree of hydration.
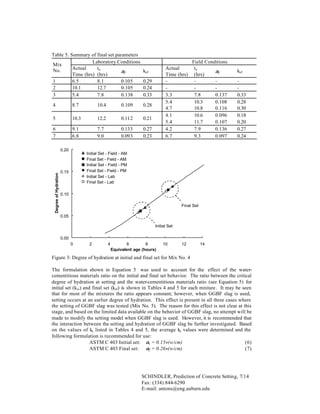
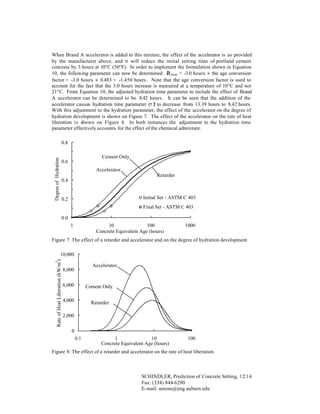
The degree of hydration (α) is actually defined as the ratio between the quantity of hydrated
cementitious material and the original quantity of cementitious material. Figure 1 presents a
physical interpretation of the degree of hydration, and it may be seen that it characterizes the
SCHINDLER, Prediction of Concrete Setting, 2/14
Fax: (334) 844-6290
E-mail: antons@eng.auburn.edu
3. formation of hydration products for a specific concrete mixture over time. This figure
illustrates why initial and final set may be correlated to the degree of hydration and this paper
will investigate this hypothesis further. The exponential function shown in Equation 2 can be
used to effectively characterize the S-shaped degree of hydration curve [10,11].
τ β
α (te ) = α u ⋅ exp −
te
where,
α(t e)
τ
β
αu
=
=
=
=
(2)
the degree of hydration at equivalent age, te,
hydration time parameter (hours),
hydration shape parameter, and
ultimate degree of hydration.
Degree of Hydration (%)
100%
Dormant
Period
Setting
Hardening
= Cement
= Hydration Products
0%
Concrete Age
Figure 1: Physical interpretation of the degree of hydration development
The activation energy (E) defines the temperature sensitivity of the concrete mixture in the
equivalent age m
aturity function (Equation 1). In this paper a model to characterize the
activation energy in terms of the cement composition and SCMs in the concrete mixture was
used. The activation energy model can be summarized as follows [12]:
E = 22,100 ⋅ f E ⋅ p C3 A 0.30 ⋅ p C4 AF 0.25 ⋅ Blaine0.35
where,
p C3A =
p C4AF =
Blaine =
fE
=
weight ratio of C3 A in terms of the total cement content,
weight ratio of C4 AF in terms of the total cement content,
Blaine value, specific surface area of cement (m2 /kg), and
activation energy modification factor, defined as:
p
f E = 1 − 1.05 ⋅ p FA ⋅ 1 − FACaO + 0.40 ⋅ p SLAG
0 .40
where,
(3)
(4)
p FA
= mass ratio replacement of the fly ash,
p FACaO = mass ratio of the CaO content in the fly ash, and
p SLAG = mass ratio replacement of the GGBF Slag.
Byfors [13] defined the term “critical degree of hydration” (αcr) as the degree of hydration that
has to be reached before any strength gain will occur. Byfors concluded that the critical degree
of hydration is dependent on the water-cement ratio and presented the following expression:
SCHINDLER, Prediction of Concrete Setting, 3/14
Fax: (334) 844-6290
E-mail: antons@eng.auburn.edu
4. αcr = k s ⋅ (w/c)
where,
ks
w/c
(5)
= constant that varies between 0.4 and 0.46, and
= water-cement ratio.
Byfors’s definition of the critical degree of hydration is very similar to the point at which final
setting occurs; however, the value was obtained by extrapolating the degree of hydration versus
strength development data until the time of zero strength is reached. In this paper it is
proposed that the initial and final set times of concrete be evaluated in terms of the degree of
hydration development. The effect of the water-cement ratio will be incorporated, since it has
been shown to influence the degree of hydration at setting [13,14]. This is necessary since a
higher water-cement ratio will results in a greater distance between cement particles, which
will in turn require a higher degree of hydration before setting of the mixture can occur.
3. Experimental work
In order to develop a setting model, setting test data were collected under laboratory and field
conditions. Field data were collected from seven concrete pavement projects paved in different
seasons and in different climatic regions of Texas. At each field site, quantities of raw
materials were gathered to enable the reproduction of the field mixtures in the laboratory.
ASTM C 403 [5] tests were performed on-site by sampling fresh concrete placed in front of the
concrete paver. Table 1 provides a brief summary of the mixture proportions of the
continuously reinforced concrete pavement (CRCP) sites visited.
Table 1: Summary of the CRCP concrete mixtures tested
Mix
Site
Cementitious Materials
No.
Description
1
Dallas - May
Type I/II + 20% Class F fly ash
2
Houston - May
Type I/II + 25% Class C fly ash
3
Dallas - Aug
Type I
4
Houston - Aug
Type I/II + 35% Class C fly ash
5
El Paso - Aug
Type I/II + 50% GGBF Slag
6
Dallas - Sept
Type I/II + 20% Class F fly ash
7
Houston - Oct
Type I/II + 25% Class C fly ash
Total Cementitious
Content (kg/m3 )
293
318
346
320
279
272
347
w/cm
0.39
0.44
0.46
0.41
0.54
0.50
0.41
Semi -adiabatic tests were performed on 150 x 300mm cylindrical concrete specimens, to
define the degree of hydration for each mixture. The semi-adiabatic testing equipment used
during this project was supplied by Digital Site Systems, Inc., Pennsylvania. The with-in-test
repeatability with this equipment is r
eported to be within 1% to 3%. Based on standard
American testing temperatures, a reference temperature of 21.1°C (70°F) was used for the
back-calculation of the degree of hydration of the mixtures. The best-fit hydration parameters
for the degree of hydration formulation, shown in Equation 2, are summarized in Table 2.
The times of initial and final set were determined by means of penetration resistance testing in
accordance with ASTM C 403 [5]. Setting results were obtained from the mixtures under field
conditions (fluctuating temperatures) and controlled laboratory conditions (constant
temperatures). The concrete mixtures were sieved through a 4.75mm sieve to obtain a
representative mortar sample of the fresh concrete. In this test, the maximum force required to
penetrate needles of different sizes to a depth of 25 mm over a 10 second period is measured.
SCHINDLER, Prediction of Concrete Setting, 4/14
Fax: (334) 844-6290
E-mail: antons@eng.auburn.edu
5. As the concrete stiffens, the size of needle is progressively decreased. Thermocouples were
used to monitor ambient and mortar temperatures. During the data analysis, the best-fit power
function, as recommended by ASTM C 403, was fitted through the data points. The
penetration resistance test results for the concretes sampled in the morning and the afternoon
on a CRCP project in Houston are shown in Figure 2. The setting results under laboratory
conditions for the mixture is also plotted on Figure 2. The effect of different curing
temperatures on the setting times can clearly be seen in this figure. Air temperatures during
construction of this pavement were above the 25°C; hence, setting occurred earlier on-site than
under laboratory conditions. Similarly, setting for the section placed in the afternoon occurred
faster, since the afternoon placement’s concrete temperatures were higher than the morning
placement’s concrete temperatures. Table 3 provides a summary of the chronological initial
and final setting times determined in the field and under laboratory conditions.
Table 2: Best-fit hydration parameters obtained from semi-adiabatic testing (Tr = 21.1°C)
Activation Energy
Hydration Parameters
Mix No.
(J/mol)
β
τ (hours)
αu
1
36,848
1.010
15.50
0.725
2
36,636
0.818
31.05
0.841
3
45,712
0.935
13.39
0.729
4
35,341
0.720
28.35
0.857
5
50,600
0.562
40.58
0.800
6
39,031
0.681
17.89
0.788
7
38,375
0.573
35.95
0.850
Pentration Resistance (MPa)
30
Final Set
25
20
2:45pm
9:30am
15
Lab
10
5
Initial Set
0
0
100
200
300
400
500
Concrete Chronological Age (Minutes)
600
Figure 2: Chronological times of setting by penetration resistance of Mix No. 4
SCHINDLER, Prediction of Concrete Setting, 5/14
Fax: (334) 844-6290
E-mail: antons@eng.auburn.edu
6. Table 3: Summary of initial and final set times as obtained by penetration resistance
Field Conditions (hours)
Laboratory (hours)
Mix
Site
Section No. 1
Section No. 2
No.
Description
Initial
Final
Initial
Final
Initial
Final
Set
Set
Set
Set
Set
Set
1
Dallas – May 4.9
6.5
2
Houston - May 7.9
10.1
3
Dallas – Aug
4.1
5.4
2.6
3.3
4
Houston - Aug 5.8
8.7
4.4
5.4
3.3
4.7
5
El Paso - Aug 7.0
10.3
2.9
4.1
3.5
5.4
6
Dallas – Sept 7.2
9.1
3.3
4.2
7
Houston - Oct 5.1
6.8
5.3
6.7
-
4. Calibration of the initial and final setting model
The convention introduced by Pinto and Hover [7] was adopted and the degree of hydration
values that correspond to initial ( i ) and final (α f) set were determined for all the mixtures.
α
The chronological setting times shown in Table 3 indicate that a wide range of initial and final
set times may occur for the different mixtures. During testing, the temperature of the setting
paste was monitored under both laboratory and field conditions. The measured concrete
temperatures were used to determine the equivalent ages at initial and final set. The hydration
parameters and activation energy as listed in Table 2 were used to determine the critical degree
of hydration that corresponds to the respective initial and final setting times. The results for
initial and final set are summarized in Tables 4 and 5. In general, it was found that setting
occurred at around the same equivalent age in the field and laboratory mixtures, which is in
agreement with the findings reported by Pinto and Hover [7]. As the degree of hydration is a
function of the equivalent age, this is in agreement with the formulation of Byfors [13], who
stated that setting occurs at a specific “critical” degree of hydration. Figure 3 provides an
example comparison between the equivalent age and degree of hydration at set. In this figure,
it may be seen that irrespective of the curing history, final set occurs at around the same degree
of hydration for a particular mixture. This observation is also true for the initial set condition.
Table 4: Summary of initial set parameters
Laboratory Conditions
Mix
Actual
te
No.
ksi
αi
Time (hrs) (hrs)
1
2
3
4.9
7.9
4.1
5.9
9.9
5.7
0.052
0.066
0.080
0.14
0.15
0.19
4
5.8
7.0
0.055
0.14
5
7.0
6.9
0.054
0.10
6
7
7.2
5.1
5.9
6.4
0.094
0.059
0.19
0.14
Field Conditions
Actual
Time
(hrs)
2.6
4.4
3.3
2.9
3.5
3.3
5.3
te
(hrs)
αI
ksi
5.0
7.8
7.3
6.6
7.5
5.4
7.1
0.060
0.069
0.061
0.050
0.060
0.082
0.067
0.14
0.18
0.16
0.09
0.11
0.16
0.16
SCHINDLER, Prediction of Concrete Setting, 6/14
Fax: (334) 844-6290
E-mail: antons@eng.auburn.edu
7. Table 5: Summary of final set parameters
Laboratory Conditions
Mix
Actual
te
No.
αf
Time (hrs) (hrs)
1
6.5
8.1
0.105
2
10.1
12.7
0.105
3
5.4
7.8
0.138
Actual
Time (hrs)
3.3
5.4
4.7
4.1
5.4
4.2
6.7
ksf
0.29
0.24
0.33
4
8.7
10.4
0.109
0.28
5
10.3
12.2
0.112
0.21
6
7
9.1
6.8
7.7
9.0
0.133
0.093
0.27
0.23
Degree of Hydration
0.20
Field Conditions
te
αf
(hrs)
7.8
0.137
10.3
0.108
10.8
0.116
10.6
0.096
11.7
0.107
7.9
0.136
9.3
0.097
ksf
0.33
0.28
0.30
0.18
0.20
0.27
0.24
Initial Set - Field - AM
Final Set - Field - AM
Initial Set - Field - PM
Final Set - Field - PM
Initial Set - Lab
Final Set - Lab
Series10
0.15
0.10
Final Set
0.05
Initial Set
0.00
0
2
4
6
8
Equivalent age (hours)
10
12
14
Figure 3: Degree of hydration at initial and final set for Mix No. 4
The formulation shown in Equation 5 was used to account for the effect of the watercementitious materials ratio on the initial and final set behavior. The ratio between the critical
degree of hydration at setting and the water-cementitious materials ratio (see Equation 5) for
initial set (ksi ) and final set (ksf) is shown in Tables 4 and 5 for each mixture. It may be seen
that for most of the mixtures the ratio appears constant; however, when GGBF slag is used,
setting occurs at an earlier degree of hydration. This effect is present in all three cases where
the setting of GGBF slag was tested (Mix No. 5). The reason for this effect is not clear at this
stage, and based on the limited data available on the behavior of GGBF slag, no attempt will be
made to modify the setting model when GGBF slag is used. However, it is recommended that
the interaction between the setting and hydration of GGBF slag be further investigated. Based
on the values of ks listed in Tables 4 and 5, the average ks values were determined and the
following formulation is recommended for use:
ASTM C 403 Initial set: αi = 0.15⋅ (w/cm)
(6)
ASTM C 403 Final set: αf = 0.26⋅ (w/cm)
(7)
SCHINDLER, Prediction of Concrete Setting, 7/14
Fax: (334) 844-6290
E-mail: antons@eng.auburn.edu
8. where,
αi
= degree of hydration at initial set,
αf
= degree of hydration at final set, and
w/cm = water-cementitious materials ratio.
In Table 6 the degree of hydration at setting computed with the formulations shown in
,
Equations 6 and 7 are evaluated for different water-cementitious materials ratios. With a w/cm
of 0.50, it may be seen that initial and final set are predicted to occur after, respectively, 7.5%
and 13% of hydration products have been developed. Table 6 indicates that for setting to
occur, more hydration products have to develop at higher w/cm ratios, and visa versa, which is
in accordance with findings in past literature [13,14].
Table 6: The effect of different w/cm ratios on the degree of hydration at setting
Degree of Hydration
ASTM C 403
w/cm = 0.40
w/cm = 0.50
w/cm = 0.60
Initial Set
0.060
0.075
0.090
Final Set
0.104
0.130
0.156
Equivalent Age at Initial Set (Hours)
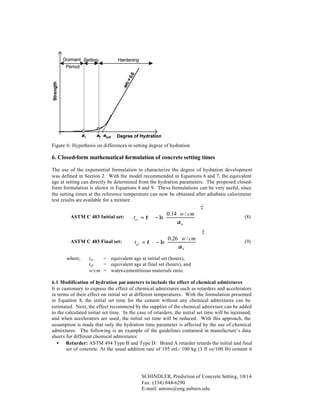
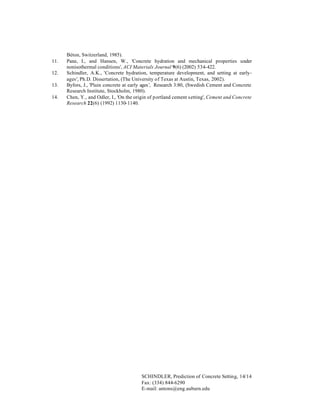
Figures 4 and 5 provide a comparison of the predicted equivalent age versus the measured
equivalent age at setting using the proposed model shown in Equations 6 and 7. These figures
indicate that an accurate estimate of the equivalent age at setting can be obtained with the
proposed model. The r2 values were 0.735 and 0.766, respectively, for the predicted versus
measured initial and final setting. It may be seen that the initial and final setting times for the
GGBF slag mixtures are over predicted, and this effect is present in all three cases where the
setting of GGBF slag was tested. This may be due to the fact that setting occurs at an earlier
degree of hydration. It is recommended that the interaction between setting and hydration of
GGBF slag be further investigated.
Initial Set
Predicted
16
14
12
10
8
6
4
2
7F
7L
6F
6L
5F-2
5F-1
5L
4F-2
4F-1
4L
3F
3L
2L
1L
0
Mix No.
Figure 4: Comparison of measured and predicted equivalent ages to reach initial set
(Note: L = Laboratory conditions, F=Field conditions, 1=Section No.1, 2=Section No. 2)
SCHINDLER, Prediction of Concrete Setting, 8/14
Fax: (334) 844-6290
E-mail: antons@eng.auburn.edu
9. Equivalent Age at Final Set (Hours)
16
Final Set
Predicted
14
12
10
8
6
4
2
7F
7L
6F
6L
5F-2
5F-1
5L
4F-2
4F-1
4L
3F
3L
2L
1L
0
Mix No.
Figure 5: Comparison of measured and predicted equivalent ages to reach final set
(Note: L = Laboratory conditions, F=Field conditions, 1=Section No.1, 2=Section No. 2)
5. Additional remarks regarding the concrete setting model
In Section 2, it was discussed that Byfors [13] recommended a ks value between 0.4 and 0.46 to
multiply with the water-cement ratio to obtain the critical degree of hydration when the
strength development starts. However, based on the calibration of the ASTM C 403 setting
data, a ks value of 0.26 was found to best represent the measured the final set times. These
values appear to contradict one another.
The “arbitrary” definition of set used by ASTM C 403 and that used by Byfors originate from
different requirements. The difference between the ASTM C 403 approach and that taken by
Byfors is schematically shown in Figure 6. Byfors determined the start of strength
development by extrapolating a linear line from degree of hydration versus strength graphs.
By extrapolating a linear line from the later age strength, the slow initial gain in strength is not
considered. Concerning this issue, Byfors [13] remarks that, “...the relation between strength
and the degree of hydration is, however, exponential at a very early stage, from the setting
phase and a few hours after.” This exponential gain in initial strength is captured by the ASTM
C 403 procedure and this behavior may be seen in typical ASTM C 403 test results as shown in
Figure 2.
Based on the discussion above, it may be concluded that a difference between the degree of
hydration at final set as proposed by the author and Byfors [13] is not unexpected. The
difference arises from the use of different definitions of the time of final set. The use of either
of the two approaches may be adopted; however, compatibility concerning strength and
stiffness gain should be maintained. It is recommended to determine the degree of hydration at
initial and final set in terms of the formulation shown in Equations 6 and 7.
SCHINDLER, Prediction of Concrete Setting, 9/14
Fax: (334) 844-6290
E-mail: antons@eng.auburn.edu
10. Hardening
Strength
w/c
=
0.6
Dormant Setting
Period
αi
αf αcrit
Degree of Hydration
Figure 6: Hypothesis on differences in setting degree of hydration
6. Closed-form mathematical formulation of concrete setting times
The use of the exponential formulation to characterize the degree of hydration development
was defined in Section 2. With the model recommended in Equations 6 and 7, the equivalent
age at setting can directly be determined from the hydration parameters. The proposed closedform formulation is shown in Equations 8 and 9. These formulations can be very useful, since
the setting times at the reference temperature can now be obtained after adiabatic calorimeter
test results are available for a mixture.
ASTM C 403 Initial set:
ASTM C 403 Final set:
where,
0.14 ⋅ w / cm
tei = τ ⋅ − ln
αu
−1
β
0 .26 ⋅ w / cm
tef = τ ⋅ − ln
αu
(8)
−1
β
(9)
tei
= equivalent age at initial set (hours),
tef
= equivalent age at final set (hours), and
w/cm = water-cementitious materials ratio.
6.1 Modification of hydration par ameters to include the effect of chemical admixtures
It is customary to express the effect of chemical admixtures such as retarders and accelerators
in terms of their effect on initial set at different temperatures. With the formulation presented
in Equation 8, the initial set time for the cement without any chemical admixtures can be
estimated. Next, the effect recommend by the supplier of the chemical admixture can be added
to the calculated initial set time. In the case of retarders, the initial set time will be increased,
and when accelerators are used, the initial set time will be reduced. With this approach, the
assumption is made that only the hydration time parameter is affected by the use of chemical
admixtures. The following is an example of the guidelines contained in manufacture’s data
sheets for different chemical admixtures:
• Retarder: ASTM 494 Type B and Type D: Brand A retarder retards the initial and final
set of concrete. At the usual addition rate of 195 mL/ 100 kg (3 fl oz/100 lb) cement it
SCHINDLER, Prediction of Concrete Setting, 10/14
Fax: (334) 844-6290
E-mail: antons@eng.auburn.edu
11. •
will extend the initial setting time of portland cement concrete by 2 to 3 hours at 21°C
(70°F).
Accelerator: ASTM 494 Type E: Brand A accelerator is used at an addition rate of 520
to 2600 mL/100 kg (8 to 40 fl oz/100 lb) of cement. The amount used will depend upon
the setting time of the non-admixtured concrete and the temperature at placement. In
most instances, the addition of 780 to 1040 mL of Brand A accelerator/100 kg (12 to 16
fl oz/100 lb) of cement will reduce the setting time of a typical Type I cement concrete
at 10°C (50°F) by 2 to 3 hours and increase the 3 day compressive strength by 25 to
50%.
With the above information, the new hydration time parameter, which includes the effect of
retarders or accelerators can be determined. The new hydration time parameter can be
determined as follows:
ASTM C 403 Initial set:
where,
0. 14 ⋅ w / cm
τ chem = (tei + ∆ chem ) ⋅ − ln
αu
1
β
(10)
τchem = adjusted hydration time parameter to include the effect of a
retarder or accelerator (hours),
tei
= equivalent age at initial set of the cement without chemical
admixtures determined from Equation 8 (hours), and
∆chem = effect of chemical admixture on the time at initial set at the
reference temperature (21.1°C), where positive retards and
negative accelerates.
6.2 Example problem to include the effect of chemical admixtures
The implementation of the approach outlined above is best explained by an example. The
hydration parameters used for this exercise are those listed in Table 2, for Mix No. 3, where
β = 0.720, τ = 13.39 hours, αu = 0.729, E = 45712 J/mol, and w/cm = 0.46. When this mixture
is considered without the presence of any chemical admixtures, it may be found from Equation
8 that initial setting at 21°C (70°F) is expected to occur at the following equivalent age:
−1
0.14 ⋅ 0.46
tei = 13.39 ⋅ − ln
0.729
0. 720
= 3.91 hours
(11)
When Brand A retarder is added to this mixture, the effect of the retarder is as provided by the
manufacturer above, and it will extend the initial setting time of portland cement concrete by 2
hours at 21°C (70°F). In order to implement the formulation shown in Equation 10, the
following parameter can now be determined: ∆chem = +2.0 hours. From Equation 10, the
adjusted hydration time parameter to include the effect of the Brand A retarder can be
determined to be 20.24 hours as shown in Equation 12. It may be seen that the addition of the
retarder causes the hydration time parameter (τ) to increase from 13.39 hours to 20.24 hours.
With this adjustment of the hydration parameter, the effect of the retarder on the degree of
hydration development is as shown on Figure 7. The effect of the retarder on the rate of heat
liberation is shown on Figure 8.
1
0.14 ⋅ 0 .46
τ chem = (3.91 + 2.0 ) ⋅ − ln
0.729
0.720
= 20.24 hours
(12)
SCHINDLER, Prediction of Concrete Setting, 11/14
Fax: (334) 844-6290
E-mail: antons@eng.auburn.edu
12. When Brand A accelerator is added to this mixture, the effect of the accelerator is as provided
by the manufacturer above, and it will reduce the initial setting time of portland cement
concrete by 3 hours at 10°C (50°F). In order to implement the formulation shown in Equation
10, the following parameter can now be determined: ∆chem = -3.0 hours × the age conversion
factor = -3.0 hours × 0.483 = -1.450 hours. Note that the age conversion factor is used to
account for the fact that the 3.0 hours increase is measured at a temperature of 10°C and not
21°C. From Equation 10, the adjusted hydration time parameter to include the effect of Brand
A accelerator can be determined to be 8.42 hours. It can be seen that the addition of the
accelerator causes hydration time parameter (τ ? to decrease from 13.39 hours to 8.42 hours.
)
With this adjustment to the hydration parameter, the effect of the accelerator on the degree of
hydration development is shown on Figure 7. The effect of the accelerator on the rate of heat
liberation is shown on Figure 8 In both instances the adjustment to the hydration time
.
parameter effectively accounts for the effect of the chemical admixture.
0.8
Degree of Hydration
Cement Only
0.6
Accelerator
Retarder
0.4
Initial Set - ASTM C 403
0.2
Final Set - ASTM C 403
0.0
1
10
100
Concrete Equivalent Age (hours)
1000
Figure 7: The effect of a retarder and accelerator and on the degree of hydration development
3
Rate of Heat Liberation (kW/m )
10,000
Accelerator
8,000
6,000
Cement Only
4,000
Retarder
2,000
0
0.1
1
10
Concrete Equivalent Age (hours)
100
Figure 8: The effect of a retarder and accelerator on the rate of heat liberation
SCHINDLER, Prediction of Concrete Setting, 12/14
Fax: (334) 844-6290
E-mail: antons@eng.auburn.edu
13. 7. Summary and conclusions
With knowledge of the time to initial set, contractors will be able to plan measures to finish,
texture, and saw cut concrete pavements on time to prevent setting of occurring before these
activities. With the setting model proposed in this paper, the effect of temperature, different
cements, and supplementary cementing materials on the initial and final setting times may be
evaluated. Penetration resistance (ASTM C 403) setting data were collected under field and
laboratory conditions for concrete mixtures containing different cements, fly ash types, and
GGBF slag. The water-cementitious materials ratio of the mixtures varied between 0.39 and
0.54, and the cementitious materials content varied between 272 and 347 kg/m3 . It was shown
that setting of concrete in general occurs when a specific amount of hydration products have
formed. These findings are in agreement with those reported by other researchers [7,13]. The
proposed setting model is presented in Equations 6 and 7. With this model, accurate estimates
of the equivalent age at initial and final setting can be obtained. However, when GGBF slag is
used, setting occurs at an earlier degree of hydration. It is for this reason recommended that
the interaction between setting and the hydration of GGBF slag be further investigated.
8. Acknowledgements
The author would like to extend his appreciation and gratitude for the financial support
provided by the Texas Highway Department. The author is grateful for the guidance and
inspiration of Dr. B. Frank McCullough from the University of Texas at Austin.
9. References
1.
2.
3.
4.
5.
6.
7.
8.
9.
10.
Neville, A.M., 'Properties of concrete', 4th Edn, (John Wiley and Sons, Incorporated,
New York, 1996).
Yu, H.T., Khazanovich, L., Darter, M.I., and Ardani, A., 'Analysis of concrete
pavement responses to temperature and wheel loads measured from instrumented slabs',
Transportation Research Record 1639 (1998), 94-101.
Freiesleben Hansen, P., and Pedersen, E.J., 'Maturity computer for controlling curing
and hardening of concrete', Nordisk Betong 1(19) (1977) 21-25.
Carino, N.J., 'The maturity m
ethod', in 'CRC Handbook on nondestructive testing of
concrete', Chapter 5, V.M. Malhotra, and N.J. Carino, eds., (CRC Press, Florida, 1991).
ASTM C 403, 'Standard test method for time of setting of concrete mixtures by
penetration r
esistance', American Society for Testing and Materials, Pennsylvania,
(1999).
Tuthill, L.H., and Cordon, W.A., 'Properties and uses of initially retarded c
oncrete',
Proceedings of the American Concrete Institute 52(2) (1955) 273-286.
Pinto, R.C.A., and Hover, K.C., 'Application of maturity approach to setting times', ACI
Materials Journal 96 (6) (1999) 686-691.
Van Breugel, K., 'Simulation of hydration and formation of structure in hardening
cement based materials ', Ph.D. Thesis, 2nd Edn, (Delft University Press, Netherlands,
1997).
RILEM Technical Committee 119-TCE, 'Adiabatic and semi-adiabatic calorimetry to
determine the temperature increase in c
oncrete due to hydration heat of c
ement', in
RILEM Report 15, 'Prevention of thermal cracking in concrete at early ages', R.
Springenschmid, ed., (E & FN Spon, London, 1998) 315-330.
Freiesleben Hansen, P., and Pedersen, E.J., 'Curing of concrete structures ', in 'Draft
DEB-Guide to durable concrete structures', Appendix 1, (Comité Euro-International du
SCHINDLER, Prediction of Concrete Setting, 13/14
Fax: (334) 844-6290
E-mail: antons@eng.auburn.edu
14. 11.
12.
13.
14.
Béton, Switzerland, 1985).
Pane, I., and Hansen, W., 'Concrete hydration and mechanical properties under
nonisothermal conditions', ACI Materials Journal 9(6) (2002) 534-422.
Schindler, A.K., 'Concrete hydration, temperature development, and setting at earlyages', Ph.D. Dissertation, (The University of Texas at Austin, Texas, 2002).
Byfors, J., 'Plain concrete at early ages ', Research 3:80, (Swedish Cement and Concrete
Research Institute, Stockholm, 1980).
Chen, Y., and Odler, I., 'On the origin of portland cement setting', Cement and Concrete
Research 22(6) (1992) 1130-1140.
SCHINDLER, Prediction of Concrete Setting, 14/14
Fax: (334) 844-6290
E-mail: antons@eng.auburn.edu