This study establishes correlations between destructive and non-destructive testing of concrete compressive strength. Concrete cubes were cured for 7, 14, and 28 days and tested destructively via compression and non-destructively using a rebound hammer. Regression analysis found strong linear correlations (R2 91.6-97.9%) between rebound number and compressive strength. Models were able to predict compressive strength to within 1.3-1.8% of actual values on average, indicating rebound hammer can be used to accurately estimate compressive strength non-destructively.
![International Journal of Engineering Science Invention
ISSN (Online): 2319 – 6734, ISSN (Print): 2319 – 6726
www.ijesi.org Volume 3 Issue 9 ǁ September 2014 ǁ PP.12-17
www.ijesi.org 12 | Page
Correlation between Non-Destructive Testing (NDT) and Destructive Testing (DT) of Compressive Strength of Concrete Duna Samson1, Omoniyi, Tope Moses2 1 Senior Lecturer, Civil Engineering Department, Abubakar Tafawa Balewa University, Nigeria 2Graduate Student, Civil Engineering Department, Abubakar Tafawa Balewa University, Nigeria ABSTRACT : This work presents a study on the correlation and comparison between Destructive and a Non- Destructive Method (Rebound Hammer) of testing the compressive strength of concrete. Concrete cubes of 100mm x 100mm x 100mm were produced using concrete mix of grade 20N/mm2, 30N/mm2 and 35N/mm2 and cured for 7, 14 and 28days. A total of 90 cubes were produced and used for the study. Regression analysis was carried out on the data using MINITAB 15 to establish linear mathematical relationships between compressive strength and rebound number. The Compressive strength and rebound number were taken as the dependent and independent variable respectively. The results showed that the coefficient of correlation of all the proposed models ranged between 91.6%-97.9% indicating a perfect relationship between compressive strength and the rebound number. The average percentage of the residual error was determined to be 1.78%, 1.29% and 1.32% for proposed models of concrete cured at 7, 14 and 28days respectively. This implies that all the proposed models are highly significant. KEYWORDS : Compressive Strength, Concrete, Destructive testing (DT), Non-Destructive testing (NDT), Regression.
I. INTRODUCTION
Concrete is a composite material produced from the combination of cement, fine aggregate, coarse aggregate and water in their relative proportion. It is a ubiquitous building material because its constituents are relatively cheap, and readily available. In addition to that, concrete in its fresh state has the ability to be moulded into any desired shape and size. The strength of concrete is its most important property (especially when needed for structural purposes) alongside its durability. Therefore, it is very important to ascertain the compressive strength of concrete before subjecting it to its anticipated loads. Compressive strength of the hardened concrete can be determined using the destructive and non-destructive testing (NDT) methods. The destructive testing (DT) method is carried out by crushing the cast specimen to failure while the non destructive is carried out without destroying the concrete specimen. The main disadvantage of the destructive testing methods is the length of time it takes for the results to be ready, the equipment and the power required. The rebound (Schmitz) hammer is one of the most popular non destructive testing (NDT) methods used to test the strength of concrete. This is due to its relatively low cost and simplicity in use [1]. Although the non destructive testing (NDT) results are much quicker compared to the destructive methods, they are more of an approximation than exact compressive strength values [2]. In as much as the rebound hammer results are quicker, and do not destroy the surface of concrete tested, there is no established relationship between the compressive strength obtained using NDT and DT [3]. The aim of this research is to compare concrete compressive strengths measured using destructive method and those measured using the NDT and to develop regression equation relating them.
II. MATERIALS AND METHODS
Materials: Ashaka brand of Ordinary Portland Cement (OPC) was used throughout the research work. It was tested in accordance with BS 12:1978 specification. The coarse aggregate used throughout the experiment was from an igneous rock source and procured from a local quarry site in Bauchi, North East Nigeria. It was tested in accordance with BS 882:1983 specification. Fine aggregate used was sharp sand obtained from a stream at Bayara close to Bauchi Metropolis. Portable drinking water was used for the production of concrete and as such no test was performed on it. Table 1 shows the result of preliminary test conducted on the materials.
III. METHODS.
Production, Casting and Curing of Concrete Specimen.
Concrete of grade 20N/mm2, 30 N/mm2 and 35 N/mm2 were used for the study. The mix design was done in accordance with BS 882:1973 specification for normal weight concrete. Batching of concrete](https://image.slidesharecdn.com/b0391012017-141021013855-conversion-gate02/85/B0391012017-1-320.jpg)
![International Journal of Engineering Science Invention
ISSN (Online): 2319 – 6734, ISSN (Print): 2319 – 6726
www.ijesi.org Volume 3 Issue 9 ǁ September 2014 ǁ PP.12-17
www.ijesi.org 12 | Page
Correlation between Non-Destructive Testing (NDT) and Destructive Testing (DT) of Compressive Strength of Concrete Duna Samson1, Omoniyi, Tope Moses2 1 Senior Lecturer, Civil Engineering Department, Abubakar Tafawa Balewa University, Nigeria 2Graduate Student, Civil Engineering Department, Abubakar Tafawa Balewa University, Nigeria ABSTRACT : This work presents a study on the correlation and comparison between Destructive and a Non- Destructive Method (Rebound Hammer) of testing the compressive strength of concrete. Concrete cubes of 100mm x 100mm x 100mm were produced using concrete mix of grade 20N/mm2, 30N/mm2 and 35N/mm2 and cured for 7, 14 and 28days. A total of 90 cubes were produced and used for the study. Regression analysis was carried out on the data using MINITAB 15 to establish linear mathematical relationships between compressive strength and rebound number. The Compressive strength and rebound number were taken as the dependent and independent variable respectively. The results showed that the coefficient of correlation of all the proposed models ranged between 91.6%-97.9% indicating a perfect relationship between compressive strength and the rebound number. The average percentage of the residual error was determined to be 1.78%, 1.29% and 1.32% for proposed models of concrete cured at 7, 14 and 28days respectively. This implies that all the proposed models are highly significant. KEYWORDS : Compressive Strength, Concrete, Destructive testing (DT), Non-Destructive testing (NDT), Regression.
I. INTRODUCTION
Concrete is a composite material produced from the combination of cement, fine aggregate, coarse aggregate and water in their relative proportion. It is a ubiquitous building material because its constituents are relatively cheap, and readily available. In addition to that, concrete in its fresh state has the ability to be moulded into any desired shape and size. The strength of concrete is its most important property (especially when needed for structural purposes) alongside its durability. Therefore, it is very important to ascertain the compressive strength of concrete before subjecting it to its anticipated loads. Compressive strength of the hardened concrete can be determined using the destructive and non-destructive testing (NDT) methods. The destructive testing (DT) method is carried out by crushing the cast specimen to failure while the non destructive is carried out without destroying the concrete specimen. The main disadvantage of the destructive testing methods is the length of time it takes for the results to be ready, the equipment and the power required. The rebound (Schmitz) hammer is one of the most popular non destructive testing (NDT) methods used to test the strength of concrete. This is due to its relatively low cost and simplicity in use [1]. Although the non destructive testing (NDT) results are much quicker compared to the destructive methods, they are more of an approximation than exact compressive strength values [2]. In as much as the rebound hammer results are quicker, and do not destroy the surface of concrete tested, there is no established relationship between the compressive strength obtained using NDT and DT [3]. The aim of this research is to compare concrete compressive strengths measured using destructive method and those measured using the NDT and to develop regression equation relating them.
II. MATERIALS AND METHODS
Materials: Ashaka brand of Ordinary Portland Cement (OPC) was used throughout the research work. It was tested in accordance with BS 12:1978 specification. The coarse aggregate used throughout the experiment was from an igneous rock source and procured from a local quarry site in Bauchi, North East Nigeria. It was tested in accordance with BS 882:1983 specification. Fine aggregate used was sharp sand obtained from a stream at Bayara close to Bauchi Metropolis. Portable drinking water was used for the production of concrete and as such no test was performed on it. Table 1 shows the result of preliminary test conducted on the materials.
III. METHODS.
Production, Casting and Curing of Concrete Specimen.
Concrete of grade 20N/mm2, 30 N/mm2 and 35 N/mm2 were used for the study. The mix design was done in accordance with BS 882:1973 specification for normal weight concrete. Batching of concrete](https://image.slidesharecdn.com/b0391012017-141021013855-conversion-gate02/75/B0391012017-1-2048.jpg)
![Correlation Between Non-Destructive Testing….
www.ijesi.org 14 | Page
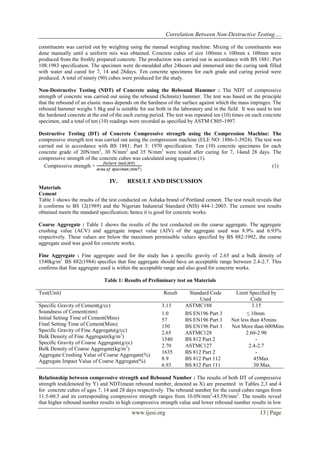
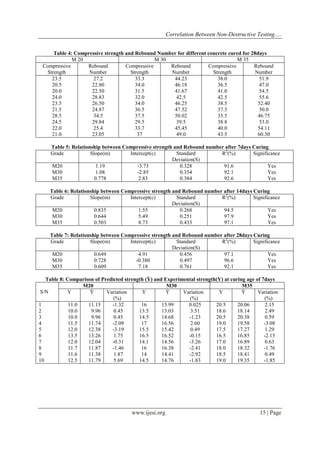
compressive strength. The compressive strength and rebound number were also seen to increase with curing age. These trends are similar to the findings reported by [4]. Table 5,6 and 7 shows the results of regression analysis carried out on the different mixes and cured for 7, 14 and 28days respectively. Due to the linear relationship between the compressive strength and the rebound number, a linear model of the form shown in Equation 2 was selected to fit the data. (2) Where x represents the mean rebound number and y represents the corresponding compressive strength while m and c represents the slope and intercept respectively. The correlation coefficient (i.e. R2) as seen in Tables 5,6 and 7 ranges from 91.6%-97.9%. These correlation coefficients agree with those obtained in earlier works [5]. This means that there is an excellent relationship between compressive strength and the rebound number. This also implies that the independent variable (rebound number) is a useful predictor of the dependent variable (Compressive strength) and thus the proposed models are highly significant [6]. Comparison was also made between the predicted compressive strength (using the regression models) values and the actual compressive strength (experimental) values. The comparison results for all the regression models are presented in Tables 8, 9 and 10.The results reveals that the difference(in percentage) between the Experimental and Predicted compressive strength values varies between 0.025%-5.69%, 0.11%-4.69% and 0.05%-3.34% for all concrete mixes cured for 7,14 and 28days respectively. The average percentage of the residual error was determined to be 1.78%, 1.29% and 1.32% for concrete aged 7, 14 and 28days respectively. These values are not large which implies that all the proposed models are valid. Therefore, the models can be used to predict the compressive strength of concrete to a high degree of accuracy [7]. One way analysis of variance (ANOVA) was carried out to compare the experimental and predicted values of compressive strength at 5% level of significance (P>0.05). The results are as presented in Tables 11, 12 and 13 for concrete cured for 7, 14 and 28days respectively. The P-values is a measure of the likelihood that the true coefficient is zero. All the P values exceeded the selected level of significance (P>0.05). This implies that there is no statistically significant difference between the means of the experimental and predicted value of compressive strength. Thus, the proposed relationships can be used to predict to a high degree of accuracy, the compressive strength of concrete members if the rebound number is determined [8]. Table 2: Compressive strength and Rebound number for different concrete cured for 7days
M 20
M 30
M 35
Compressive Strength
Rebound Number
Compressive Strength
Rebound Number
Compressive Strength
Rebound Number
11.0
12.5
16.0
17.45
20.5
22.12
10.0
11.5
13.5
14.70
18.6
19.65
10.0
11.5
14.5
16.23
20.5
22.53
11.5
13.0
17.0
17.97
19.0
21.51
12.0
13.54
15.5
16.92
17.5
18.54
13.5
14.28
16.5
17.94
16.5
18.0
12.0
13.25
14.10
16.12
17.0
18.05
11.7
13.11
16.0
17.81
18.0
19.88
11.6
12.70
14.0
15.98
18.5
20.0
12.5
13.04
14.5
16.31
19.0
21.21
Table 3: Compressive strength and Rebound number for different concrete cured for 14days
M20
M 30
M35
Compressive Strength
Rebound Number
Compressive Strength
Rebound Number
Compressive Strength
Rebound Number
17.0
18.01
17.3
18.5
22.0
25.90
14.2
15.0
20.6
22.92
22.5
26.80
13.6
14.48
18.6
19.75
19.5
21.47
15.0
16.47
17.5
18.90
23.0
27.50
14.7
15.33
22.2
26.34
23.5
29.05
13.9
14.95
19.0
21.0
24.0
31.0
14.3
15.12
18.5
20.02
25.5
34.25
15.3
16.90
19.0
21.34
17.5
19.05
16
17.43
20.2
22.56
20.0
21.98
13.8
14.72
17.0
18.14
21.0
23.7](https://image.slidesharecdn.com/b0391012017-141021013855-conversion-gate02/85/B0391012017-3-320.jpg)
![Correlation Between Non-Destructive Testing….
www.ijesi.org 17 | Page
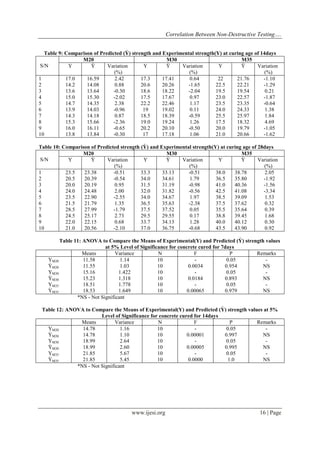
Table 13: ANOVA to Compare the Means of Experimental(Y) and Predicted (Ỳ) strength values at 5% Level of Significance for concrete cured for 28days
Means
Variance
N
F
P
Remarks
YM20
22.90
6.27
10
-
0.05
-
ỲM20
22.90
6.08
10
0.0000
1.00
NS
YM30
33.90
6.45
10
-
0.05
-
ỲM30
33.90
6.28
10
0.000
1.00
NS
YM35
39.18
6.58
10
-
0.05
-
ỲM35
39.18
6.09
10
0.0000
0.997
NS
*NS - Not Significant
V. CONCLUSION
The following conclusions are drawn based on the outcome of the experiment and analysis:
[1] High rebound number results in high compressive strength while low rebound number results in low compressive strength.
[2] The correlation coefficient of the proposed models ranges from 92.1%-97.9%. This shows an excellent relationship between compressive strength and the rebound number, and thus the rebound number is a useful predictor.
[3] Due to the high correlation coefficient of all the proposed Models which ranges from 91.6%- 97.9%, all the models are highly significant.
[4] The average percentage of residual error for all the proposed model was 1.78% 1.29% and 1.32% for concrete cured for 14 and 28days respectively. This further confirms that the models can predict the compressive strength of concrete to a high degree of accuracy if the rebound number is established.
[5] There is no statistically significant difference between Experimental and Predicted Strength Values
REFERENCES
[1] Luke M, S(2012). Using the Rebound Hammer. Proceedings of the 11th Annual Mongolian Concrete Conference, June 2012. [2] Aguwamba, J.C and Adagba, T, A comparative Analysis of the rebound Hammer and Ultrasonic Pulse Velocity in Testing Concrete. Nigerian journal of Technology. 31(1), 2012, 31-39. [3] Aguwamba, J.C and Adagba, T, A comparative Analysis of the rebound Hammer and Ultrasonic Pulse Velocity in Testing Concrete. Nigerian journal of Technology. 31(1), 2012, 31-39. [4] ASTM C805-08, “Standard Test Method for Rebound Number of Hardened Concrete”, American Society for Testing and Materials, West Conshohocken, PA, 2008 [5] Cemex USA (2013) Proper use of the Rebound Hammer Updated to reflect the changes to ASTM C805. Technical Bulletin. Retrieved From: www.cemexusa.com (July 9th, 2014) [6] Jen-Chei. L, Mou-Lin. S, and Chang-Huan. K. Estimating the Strength of Concrete Using Surface Rebound Value and Design Parameters of Concrete Material. Tamkang Journal of Science and Engineering, 12(1), 2009,1-7 [7] Hassan, R. H(2012). Correlation between Destructive and Non-Destructive Strengths of Concrete Cubes Using Regression Analysis. Contemporary Engineering Sciences, 5(10), 2012, 493 – 509 [8] Multiple Regression and Model Checking (2011). Tutorial, Department of Mathematics and Statistic, University of Reading. pp 1-6](https://image.slidesharecdn.com/b0391012017-141021013855-conversion-gate02/85/B0391012017-6-320.jpg)


