Concept mapping, mind mapping and argument
mapping: what are the differences and do they matter?
Martin Davies
Published online: 27 November 2010
� Springer Science+Business Media B.V. 2010
Abstract In recent years, academics and educators have begun to use software map-
ping tools for a number of education-related purposes. Typically, the tools are used to
help impart critical and analytical skills to students, to enable students to see rela-
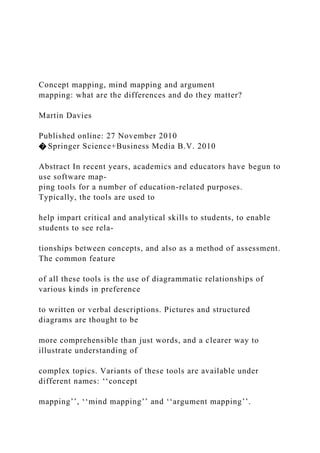
tionships between concepts, and also as a method of assessment. The common feature
of all these tools is the use of diagrammatic relationships of various kinds in preference
to written or verbal descriptions. Pictures and structured diagrams are thought to be
more comprehensible than just words, and a clearer way to illustrate understanding of
complex topics. Variants of these tools are available under different names: ‘‘concept
mapping’’, ‘‘mind mapping’’ and ‘‘argument mapping’’. Sometimes these terms are used
synonymously. However, as this paper will demonstrate, there are clear differences in
each of these mapping tools. This paper offers an outline of the various types of tool
available and their advantages and disadvantages. It argues that the choice of mapping
tool largely depends on the purpose or aim for which the tool is used and that the tools
may well be converging to offer educators as yet unrealised and potentially comple-
mentary functions.
Keywords Concept mapping � Mind mapping � Computer-aided argument mapping �
Critical thinking � Argument � Inference-making � Knowledge mapping
Introduction
In the past 5–10 years, a variety of software packages have been developed that enable the
visual display of information, concepts and relations between ideas. These mapping tools
take a variety of names including: ‘‘concept mapping’’, ‘‘mind mapping’’ or ‘‘argument
mapping’’. The potential of these tools for educational purposes is only now starting to be
realised.
M. Davies (&)
University of Melbourne, Parkville, VIC, Australia
e-mail: [email protected]
123
High Educ (2011) 62:279–301
DOI 10.1007/s10734-010-9387-6
The idea of displaying complex information visually is, of course, quite old. Flow
charts, for example, were developed in 1972 (Nassi and Shneiderman 1973) pie charts and
other visual formats go back much earlier (Tufte 1983). More recently, visual displays
have been used to simplify complex philosophical issues (Horn 1998). Formal ways of
‘‘mapping’’ complex information—as opposed to the earth’s surface, countries, cities and
other destinations—began at least 30 years ago, and arguably even earlier.
More recently, the use of information and computer technology has enabled information
mapping to be achieved with far greater ease. A plethora of software tools has been
developed to meet various information mapping needs. What do these tools do? What are
their similarities and differences? What are their advantages and disadvantages? How
precisely do t.
Getting graphic About Infographics: Design Lessons Learned From Popular Infog...Patrick Lowenthal
People learn and remember more efficiently and effectively through the use of text and visuals than through text alone. Infographics are one way of presenting complex and dense informational content in a way that supports cognitive processing, learning, and future recognition and recollection. But the power of infographics is that they are a way of delivering the maximum amount of content in the least amount of space while still being precise and clear; because they are visual presentations as opposed to oral or text presentations, they can quickly tell a story, show relationships, and reveal structure. The following paper reports on an exploration of top 20 “liked” infographics on a popular infographic sharing website in an effort to better understand what makes an effective infographic in order to better prepare graduate students as consumers and designers of infographics. The paper concludes with recommendations and strategies on how educators might leverage the power of infographics in their classrooms.
Knowledge maps for e-learning. Jae Hwa Lee, Aviv Segev
Maps such as concept maps and knowledge maps are often used as learning materials. These maps havenodes and links, nodes as key concepts and links as relationships between key concepts. From a map, theuser can recognize the important concepts and the relationships between them. To build concept orknowledge maps, domain experts are needed. Therefore, since these experts are hard to obtain, the costof map creation is high. In this study, an attempt was made to automatically build a domain knowledgemap for e-learning using text mining techniques. From a set of documents about a specific topic,keywords are extracted using the TF/IDF algorithm. A domain knowledge map (K-map) is based onranking pairs of keywords according to the number of appearances in a sentence and the number ofwords in a sentence. The experiments analyzed the number of relations required to identify theimportant ideas in the text. In addition, the experiments compared K-map learning to document learningand found that K-map identifies the more important ideas
This is the first guide for researchers interested in creating infographics of their research findings. The main content of the guide is evidence-based, and is followed by links to examples of infographics and other information to illustrate the concepts presented. The appendices contain form-fillable worksheets intended to help ensure the user considers all important the design and development considerations, including a checklist to use to obtain feedback from intended target audience(s).
This powerpoint will look at the basic differences between concept maps, mind mapping, graphic organizers, and outlines ... all as a form of graphically representing mental schema. By Jesse Gentile
This guide was created for NeuroDevNet researchers and trainees (however it could also be useful to practitioners and KT professionals) with an interest in exploring infographics as a KT product. It begins with an evidence-informed introduction followed by an annotated bibliography of web-based resources and ends with appendices of evidence-informed worksheets (see Appendices A-E) created by the KT Core for you to use during the design and creation of your infographic. This guide is intended to provide you with information including: what is an infographic, what are the different types of infographics, what should you consider when planning your infographic, how you can either do it yourself or work with a graphic designer, and a form-fillable tool you can use to help you think through and collate the information you need before sketching a draft of your infographic.
Development and Evaluation of Concept Maps as Viable Educational Technology t...paperpublications3
Abstract: This study had developed and evaluated concept maps as viable educational technology to facilitate learning and assessment. The development process concluded upon establishing validity and reliability. These maps were classified into two: concept maps to facilitate learning; and, fill-in-the-maps to facilitate assessment. A one group pre-test-posttest pre-experimental design was employed. Fill-in-the-maps were utilized for unit pre-tests and posttests. Complete concept maps were used to facilitate learning. For midterm examination, students were given composition as basis for constructing concept map. For final examination, students were provided concept maps to write their own composition. Rubrics were used to assess students’ outputs. z-test for correlated means showed significant increases of Mean Percentage Score (MPS) from pre-test to posttest. The overall posttest result was correlated with those of objective, fill-in-the-map, map construction and composition writing. Significant correlations were observed. Results accentuated that concept maps can be developed and evaluated to facilitate learning and assessment.
Concept of collection. Assume that An agency has focused its sys.docxpatricke8
C
oncept of collection
. Assume that An agency has focused its system development and critical infrastructure data collection efforts on separate engineering management systems for different types of assets and is working on the integration of these systems. In this case, the agency focused on the data collection for two types of assets: water treatment and natural gas delivery management facilities.
Please identify what type of critical infrastructure data collection is needed for pavement and storm water management facilities.
.
Concept of AestheticsOVERVIEWAesthetics is defined as an appre.docxpatricke8
Concept of Aesthetics
OVERVIEW
Aesthetics is defined as an appreciation for beauty and a feeling of wonder. Teachers can help
develop children’s aesthetic senses by involving them in the arts through introduction to works
of art, music, dance, and literature. Children’s aesthetic sensibilities are enhanced by allowing
them to explore their environment in a manner that encourages divergent thinking. In discussing
art with children, basic elements such as line, color, form, space, and design are all appropriate.
Teachers can create aesthetic opportunities in the classroom by providing children with
materials, supplies, room décor, objects, books, visiting artists, and varied activities to stimulate
their aesthetic sense.
There are three basic ways to provide young children with developmentally appropriate
aesthetic experiences in the early childhood program:
Provide many opportunities to create art.
Provide many opportunities to look at and talk about art.
Help children become aware of art in their everyday lives.
Developing children’s aesthetic sensitivity is important because it improves the quality of their
learning and encourages the creative process.
KEY TERMS
aesthetic development
—
Teaching young children to appreciate art through everyday
experiences, play, and conversations
aesthetic experiences
—
Experiences involving an appreciation of the beauty of nature, the
rhythm and imagery of music or poetry, or the qualities of works of art.
aesthetic learning
—
Joining what one thinks with what one feels
Aesthetics Movement
—
Movement in the world beginning in early 1800 and lasting the
decade, emphasizing the “science of the beautiful” or the “philosophy of taste.”
aesthetics
—
An appreciation for beauty and a feeling of wonder. It is a sensibility that uses the
imagination as well as the five senses.
aesthetic sense —
One’s own specific taste or preference.
art appreciation
— Seeing and appreciating good artwork; learning to look at and learning to
create visual arts
art elements
—
Basic factors of art that can be used to describe art. These elements include
color, line, form or shape, space, and design.
balance —
The principle of design that deals with visual weight in a work of art
color/hue —
The color name
pattern —
When a particular shape, color, or motif is repeated in a rhythmic way
intensity —
The varied color when a hue’s complementary color, the color opposite it on the
color wheel, is added to the original color
language of art —
Expansion of the language of the early childhood classroom.
The words of
the language are the elements of art.
line —
A continuous mark on a surface
multicultural aesthetics —
A worldview of art which honors heritage, community, and tradition
multimedia artwork —
Integration of art such as walk-in sculpture environments; mixes of live
dance and films; and art exhibitions with drama, where actors move into the audience to engage
in the drama
primary colors —
Red, blue, and yellow.
More Related Content
Similar to Concept mapping, mind mapping and argumentmapping what are .docx
This is the first guide for researchers interested in creating infographics of their research findings. The main content of the guide is evidence-based, and is followed by links to examples of infographics and other information to illustrate the concepts presented. The appendices contain form-fillable worksheets intended to help ensure the user considers all important the design and development considerations, including a checklist to use to obtain feedback from intended target audience(s).
This powerpoint will look at the basic differences between concept maps, mind mapping, graphic organizers, and outlines ... all as a form of graphically representing mental schema. By Jesse Gentile
This guide was created for NeuroDevNet researchers and trainees (however it could also be useful to practitioners and KT professionals) with an interest in exploring infographics as a KT product. It begins with an evidence-informed introduction followed by an annotated bibliography of web-based resources and ends with appendices of evidence-informed worksheets (see Appendices A-E) created by the KT Core for you to use during the design and creation of your infographic. This guide is intended to provide you with information including: what is an infographic, what are the different types of infographics, what should you consider when planning your infographic, how you can either do it yourself or work with a graphic designer, and a form-fillable tool you can use to help you think through and collate the information you need before sketching a draft of your infographic.
Development and Evaluation of Concept Maps as Viable Educational Technology t...paperpublications3
Abstract: This study had developed and evaluated concept maps as viable educational technology to facilitate learning and assessment. The development process concluded upon establishing validity and reliability. These maps were classified into two: concept maps to facilitate learning; and, fill-in-the-maps to facilitate assessment. A one group pre-test-posttest pre-experimental design was employed. Fill-in-the-maps were utilized for unit pre-tests and posttests. Complete concept maps were used to facilitate learning. For midterm examination, students were given composition as basis for constructing concept map. For final examination, students were provided concept maps to write their own composition. Rubrics were used to assess students’ outputs. z-test for correlated means showed significant increases of Mean Percentage Score (MPS) from pre-test to posttest. The overall posttest result was correlated with those of objective, fill-in-the-map, map construction and composition writing. Significant correlations were observed. Results accentuated that concept maps can be developed and evaluated to facilitate learning and assessment.
Concept of collection. Assume that An agency has focused its sys.docxpatricke8
C
oncept of collection
. Assume that An agency has focused its system development and critical infrastructure data collection efforts on separate engineering management systems for different types of assets and is working on the integration of these systems. In this case, the agency focused on the data collection for two types of assets: water treatment and natural gas delivery management facilities.
Please identify what type of critical infrastructure data collection is needed for pavement and storm water management facilities.
.
Concept of AestheticsOVERVIEWAesthetics is defined as an appre.docxpatricke8
Concept of Aesthetics
OVERVIEW
Aesthetics is defined as an appreciation for beauty and a feeling of wonder. Teachers can help
develop children’s aesthetic senses by involving them in the arts through introduction to works
of art, music, dance, and literature. Children’s aesthetic sensibilities are enhanced by allowing
them to explore their environment in a manner that encourages divergent thinking. In discussing
art with children, basic elements such as line, color, form, space, and design are all appropriate.
Teachers can create aesthetic opportunities in the classroom by providing children with
materials, supplies, room décor, objects, books, visiting artists, and varied activities to stimulate
their aesthetic sense.
There are three basic ways to provide young children with developmentally appropriate
aesthetic experiences in the early childhood program:
Provide many opportunities to create art.
Provide many opportunities to look at and talk about art.
Help children become aware of art in their everyday lives.
Developing children’s aesthetic sensitivity is important because it improves the quality of their
learning and encourages the creative process.
KEY TERMS
aesthetic development
—
Teaching young children to appreciate art through everyday
experiences, play, and conversations
aesthetic experiences
—
Experiences involving an appreciation of the beauty of nature, the
rhythm and imagery of music or poetry, or the qualities of works of art.
aesthetic learning
—
Joining what one thinks with what one feels
Aesthetics Movement
—
Movement in the world beginning in early 1800 and lasting the
decade, emphasizing the “science of the beautiful” or the “philosophy of taste.”
aesthetics
—
An appreciation for beauty and a feeling of wonder. It is a sensibility that uses the
imagination as well as the five senses.
aesthetic sense —
One’s own specific taste or preference.
art appreciation
— Seeing and appreciating good artwork; learning to look at and learning to
create visual arts
art elements
—
Basic factors of art that can be used to describe art. These elements include
color, line, form or shape, space, and design.
balance —
The principle of design that deals with visual weight in a work of art
color/hue —
The color name
pattern —
When a particular shape, color, or motif is repeated in a rhythmic way
intensity —
The varied color when a hue’s complementary color, the color opposite it on the
color wheel, is added to the original color
language of art —
Expansion of the language of the early childhood classroom.
The words of
the language are the elements of art.
line —
A continuous mark on a surface
multicultural aesthetics —
A worldview of art which honors heritage, community, and tradition
multimedia artwork —
Integration of art such as walk-in sculpture environments; mixes of live
dance and films; and art exhibitions with drama, where actors move into the audience to engage
in the drama
primary colors —
Red, blue, and yellow.
CONCEPT MAPPINGMid Term Assignment (Concept Mapping).docxpatricke8
CONCEPT MAPPING
Mid Term Assignment (Concept Mapping)
Vishvaksen Reddy Kanatala
Dr.Rand Obeidat
Enterprise Risk Management
Our hospital
General checkup
Offers
Medical Attention
Emergencies
of
Regular diseases
Through our
Skilled staffs
Under who conduct
Laboratory experiments
Security
Price consideration
or
to settle
Bill
For an enterprise risk management of health centre, the concepts for the enterprise risk management are the hospital itself, what they offer from medical attention of regular diseases and emergencies as well as a checkup of regular diseases. They the enterprise risk management should focus on how the health centre assures the quality of their service by the use of skilled staffs who conduct laboratory experiment when necessary to ascertain the actual diseases. These services are done at price consideration, or the clients can attack assets which can be used to settle the bill, which should be equivalent to the price consideration.
These concepts relate to each other because enterprise risk management is all about proper control of finances thus for a health centre they, the concept in which they undergo transaction is through the treatment of clients which should be managed effectively and closely monitored to avoid losses. According to the kind of medication given to the client, there should be the amount that the client should pay for the financial stability of the health centre.
The relationship between the concepts in the concept map and the idea to be discussed in the paper is how a hospital goes through until it can reach a point where it can demand payments. The paper is on finances management; thus, the need to show how financial transactions in a hospital are reached t point of declaring the.
The concepts in the concepts maps are connected by the use of verbs as well as conjunctions accordingly to connect one each concept with the other.
Page 1 of 14
BA 308 Leadership & Communication
Hybrid Course Syllabus Spring, 2019
CRN Credits
36093 4
Instructors
Team* Instructor Email** Office Hours Location
A-D Eric Boggs [email protected] Tues. 2pm-4pm 208B Peterson
1-4 Nicole Wilson [email protected] Mon. 10am-12pm 422 Lillis
*Friday Week 1 you will be assigned to a team.
Table of Contents
To quickly find the information you need, press your Ctrl key and click the topic.
Questions & Office Hours ................................................................................................................ 2
What You Should Know About Hybrid Classes ............................................................................. 2
Required Books and Materials........................................................................................................ 3
Canvas Learning Management System ....................................................................................... 3
Course Description ..............
Concept A The first concept that I appreciated in the.docxpatricke8
Concept A
The first concept that I appreciated in the course is the sources of law. As Showalter (2017) explains, the sources of public law include the written constitutions, statutory enactments that legislative bodies such as state, federal, and local governments make, administrative rules and regulations, and judicial decisions. All these sources of law are useful in the understanding of the laws that govern the practice in a specific discipline, the penalties for breaching such laws, and similar cases that have been determined in court.
My professional discipline is in business management. In this discipline, the legal framework is quite applicable to the alignment of business practices with the legal requirements of the profession. Consequently, as a business manager, I will be expected to understand the legal environment surrounding the operations of a company. For instance, in a healthcare organization, from a business or administrative perspective, the understanding of privacy laws or antitrust laws will be beneficial to the process of tuning the operations of the facility with the legal requirements. Where there are ambiguities, it would be useful to research judicial decisions to obtain the precedents existing for particular cases and issues.
Concept B
The second concept that I learned through the course is torts, particularly negligence. By definition, negligence is an act or failure to act that results in the harm of an individual. It is different from battery, which is an intentional act, in the sense that it emphasizes a person’s (respondent’s) duty of care, the breach of that duty in the process of dealing with a second party (the plaintiff), and the causation of injuries to the plaintiff resulting from the breach of duty (Furrow, Greaney, Johnson, Jost, & Schwartz, 2013).
My discipline is business management. From the materials on torts, I have understood the concept of a legal person – an individual or entity – which underlies the discussion of negligence. The principle of legal personhood has enabled me to understand that both private persons and organizations have a duty of care to humanity, and the breach of that duty amounts to negligence if there is proof of the breach and its causation of an injury. Therefore, as a business manager, it would be upon me to understand the duty of care that I have to various persons and to develop policies to ensure that the organization upholds the duty in its operations. I would also be in a position to understand the acts of negligence performed by other legal persons against the business entity that I manage.
References
Furrow, B., Greaney, T., Johnson, S., Jost, T., & Schwartz, R. (2013). Health law: Cases, materials, and problems (7th ed.). St. Paul, MN: West Academic Publishing
Showalter, J. S. (2017). The Anglo-American legal system. In J. S. Showalter, The Law of Healthcare Administration (pp. 1-23). Chicago, IL: Health Administration Press.
Concept .
Concept Analysis (1,000 words). Deadline 1300, 11 March 2021. .docxpatricke8
Concept Analysis (1,000 words). Deadline: 13:00, 11 March 2021. Concepts lie at the heart of any academic field, and IR is no exception. They help us make sense about the worldand provide a ‘bridge’ between our ideas and the real world. This module will be introducing you to a number of key concepts in IR – as well as some of the debates which swirl around these concepts. This assessment asks youto choose one of these key concepts, and undertake your own research in order to establish the various ways in which the concept is defined and used in the field of IR. You will need to identify and locate appropriate academic sources, engage critically with that material, and construct a piece of writing which conforms to academic conventions.Your analysis needs to be 1,000 words in length, and address the competing meanings of, and debates around, your chosen concept. It needs to be rooted in the field of IR and engage with academic texts which address or use the concept.
The concept is globalisation.
Your concept analysis should address the following aspects:
➢ Who are the main IR theorists who explore this topic
➢ What do they say about this concept?
➢ What are the connections between your chosen concept and other key concepts in IR
In assessing the concept analysis, staff will consider the degree to which:▪ The student’s characterisation of the relevant concept is accurate
▪ The student has engaged with appropriate academic sources
▪ The student has considered a range of definitions, uses and perspectives relating to the concept▪ The analysis is logically and coherently structured
▪ The student has adhered to scholarly conventions in citing sources and producing a bibliography
.
Concentration in the mobile operating systemsmarketMauri.docxpatricke8
Concentration in the mobile operating systems
market
Maurizio Naldi
Universitỳ of Rome Tor Vergata
Department of Computer Science and Civil Engineering
Via del Politecnico 1, 00133 Roma, Italy
[email protected]
Abstract. Concentration phenomena concern the ICT market. Though
the regulatory action has been active mainly in the telecom network
operators industry, even more significant worldwide concentration phe-
nomena affect other industries. The market of mobile operating systems
is analysed through two concentration indices to get a quantitative pic-
ture of the current situation and its evolution over time: the Hirschman
Herfindahl Index (HHI) and the Four-Firm Concentration Ratio (CR4).
A strongly imbalanced oligopoly is shown to exist, where the four major
operating systems take over 99% of the market, but the dominant oper-
ating system Android alone is installed on over 80% of the new devices.
Keywords: Operating Systems; Concentration; Competition; HHI
1 Introduction
Market structure and the presence of dominant operators (manufacturers and/or
service providers) has been a significant field of activity in industrial policy since
long [18]. An operator holding a very large share of the market, or even acting
as a monopolist, may take advantage of its position and enforce unfair poli-
cies towards its customers, which in turn have little or no room to oppose. The
attention for the appearance of dominant positions is at the root of the birth
of a number of national anti-trust agencies, both at the national and superna-
tional level [6], which enforce rules against anticompetitive agreements, abuses
of dominant position as well as concentrations (e.g., mergers and acquisitions,
joint ventures) which may create or strengthen dominant positions detrimental
to competition.
The issue is particularly delicate in ICT industries, where operators may
often benefit of economies of scale, which would lead to a natural monopolistic
structure as the most efficient one [15]. Noam has carried out a broad analysis
of concentration phenomena in several ICT and ICT-related industries [13] [14]:
– Books
– Film
– ISP
ar
X
iv
:1
60
5.
04
76
1v
1
[
cs
.C
Y
]
1
6
M
ay
2
01
6
2 M. Naldi
– Magazines
– Multi- channel
– Newspapers
– Online News
– Radio
– Search Engines
– TV
– Wireless
– Wireline
In that survey, the highest HHI value is observed for search engines and is
roughly 0.75, quite above the second highest value, which is 0.55 and pertains
to the wireline telco market.
However, the survey of [13] leaves out a market that has often been at the
center of anti-trust disputes in recent years, which is the operating systems one.
The most notable ones have been the U.S.A. vs Microsoft case for the Windows
desktop operating system [4], and the very recent Statement of Objections raised
by the EU vs Google for the mobile operating system Android [1].
In that Statement of Objections, the European Commission alleges that
Google has b.
Concentric Literary and Cultural Studies 33.1 March 2007 7.docxpatricke8
Concentric: Literary and Cultural Studies 33.1
March 2007: 75-85
Nervous Tracery:
Modern Analogies between Gothic Architecture
and Scholasticism
Joseph C. Murphy
Fu Jen Catholic University
Abstract
During the Gothic revivals of the nineteenth and early twentieth centuries,
Gothic architecture shed the morbid associations attached to it in earlier
periods and was admired for the aesthetic and theological vision that shaped
its medieval development. The Gothic cathedral came to epitomize the
wholeness of the Middle Ages and an impulse toward synthesis in theology as
well as the arts. This essay surveys four Gothic revival texts that define a
relationship between medieval Gothic architecture and Scholastic theology:
John Ruskin’s essay “The Nature of Gothic” in The Stones of Venice (1851-
53); Henry Adams’ Mont Saint Michel and Chartres (1904); Wilhelm
Worringer’s Form in Gothic (Formprobleme der Gotik, 1911); and Erwin
Panofsky’s Gothic Architecture and Scholasticism (1951). In these widely
read works, influential beyond the field of art history, the seemingly arcane
analogy between the Gothic and the Scholastic becomes a proving ground for
the projects of prominent intellectuals within distinct historical and cultural
contexts. For each author, the meaning of the Gothic hangs in a particular
balance between its tracery—that is, its naturalistic ornamental detail—and its
larger structure: the balance between the concrete and the abstract, between
multiplicity and unity, also achieved in Scholastic theology. Because their
analogies between the Gothic and the Scholastic isolate distinct lines of force
within these complex systems, Ruskin, Adams, Worringer, and Panofsky each
identify different values there, revealing as much about the modern mind as
about the medieval. The syntheses that their medieval forbears accomplished
collectively in service of faith, these interpreters seek independently in service
of their own cultural identity, aesthetic values, or intellectual coherence.
Keywords
Gothic architecture, Scholasticism, John Ruskin, Henry Adams,
Wilhelm Worringer, Erwin Panofsky, Thomas Aquinas
Concentric 33.1
March 2007
76
The Gothic style presents an interesting case of how the Middle Ages have
persisted in Western history through the backward glances, sometimes leery,
sometimes wistful, of subsequent periods. First arising in the seventeenth century as
a derogatory term for the anti-classical, “barbarous” style adopted by European
cathedral builders beginning in the twelfth century, the word “Gothic” became
attached in the eighteenth century to a type of sensational narrative set in
infelicitous buildings. During the Gothic revivals of the nineteenth and early
twentieth centuries, Gothic architecture shed its morbid associations and was
admired both for its aesthetic form and for the integral relationship of that form to a
theological vision. Symbolizing, as Arthur Sym.
Con Should the United States government have bailed out the a.docxpatricke8
Con: Should the United States government have bailed out the automobile
industry?
Introduction
A. In 2009, the .“Big Three” (GM, Chrysler, and ford) were facing fmancial struggles.
They were fuced with a decision: either try and work through their problem on their own
by securing loans, or to go to the government for help. Of the Big Three, only Ford
declined government assistance, having already secured a line ofcredit in 2006 by using
all of their assets as collateral. GM and Chrysler filed for a managed Chapter 11
bankruptcy that was funded primarily through the U.S. Treasury using taxpayer money.
This modified version ofChapter 11 bankruptcy that was implemented by the U.S.
government appeared to have allowed these automakers to survive for the time being, but
it came at the expense ofthe taxpayers and it did not address all ofthe problems that
caused the Big Three’s issues in the first place.
I. The Big Three’s poor managerial choices created their financial problems,
and the taxpayers’ money shouldn’t be bailing them out.
A. GM, Chrysler, and ford continued to focus on and mass produce large trucks and
SUVs because of their higher profit margins despite a growing concern over increasing
fuel prices between 2002-2007.
1. Research done by Thomas Klier of the Federal Reserve Bank of Chicago
indicates that during the span of 2002-2007, “about 40 percent of the decrease in
U.S. market share has been caused by the recent increase in the price of gaso line.”
2. More specifically, research done by Meghan Busse and F brian Zettlemeyer of
Northwestern University and Christopher Knittle of UC Berkeley showed that
through the period of 1999-2006, “a$1 increein goIinepricewiII decree
the market share of cars in the least fuel efficient quartile (< 17.7 MPG) by
11.5%.... that a $1 increase in gasoline price will increase the market share of cars
inthemofu effidentquatile(>24.3MR3) by 15.1%”
B. They allowed legacy costs to build by continuing to give out large pension plans when
foreign auto makers were switching to more realistically defined contribution plans
(4OlKs) back in the $Os.
1. The average per-hour base salary ofa U.S. auto worker and a foreign auto
worker were about the same ($28/hour in 2007) but each worker actually cost
$73.21/hour compared to $44.17/hour of Japanese competitors, with the
difference being the additional benefits promised.
C. U.S. autornakers should have switched to defined contribution plans (4OlKs) in order
to stay competitive and keep costs sustainable.
1. GM didn’t officially freeze their pension plans until February of2012.
a. This meant that they would no longer contribute to the pension plans of
workers who were promised them upon employment. Those employees
would now receive 4OlKs (defined contribution plans), a change that
should have been made decades ago to avoid current financial struggles.
II. There was no market failure and the U.S. auto makei should have filed
for traditional Chapter 11 bankrup.
COMS 101
Persuasive Speech Instructions
This course requires you to present a persuasive speech to a live, visually documented audience of 3 or more adults. Use a video recording device to create an audible recording of this presentation for submission. After recording the presentation, upload it to YouTube as an unlisted video and post the video’s link to the instructor via the designated Blackboard assignment submission link. See the Posting Speech Videos to Blackboard via YouTube tutorial (in the Assignment Instructions folder) for step-by-step instruction about this process.
Your speech grade will be determined by the degree to which you satisfy the requirements listed below.
1. Choose an appropriate topic.
This assignment requires you to research a global, national, regional, state or local problem that apparently exists because humans in general or a specific group of humans are neglecting their duty to promote the things God values in this world.
· The problem may be political, economic, educational, environmental, medical, religious, or cultural. It may be a false belief or set of beliefs (about God, nature, or other people) that needs correction, a wrongful attitude or type of attitude (toward God, nature, or other people) that needs adjustment, a neglectful or wrong way of acting (toward God, nature, or other people) that needs to change, or a state of needfulness or brokenness that exists as it does because of human indifference or inactivity.
· The problem must be a social one that deters many individuals—not just a few isolated lives—from experiencing life according to God’s Word as he intended when he created the world the people in it.
Among the social issues that could generate a qualified speech topic are the following:
abortion, infanticide, or euthanasia
discrimination (racism, sexism, ageism)
abuse (child, elder, self, spousal)
ecology (climate change, pollution, littering)
addictions/codependency/eating disorders
education (underachievement or illiteracy)
air, land, or water pollution
famine, drought or diseases
animal abuse or vivisection
labor issues (child labor or sweatshops)
bioethics (cloning, eugenics, stem cell research)
marriage (divorce, cohabitation)
birth or population control
poverty (world hunger or homelessness)
crime (street, juvenile, gang, or white collar)
sex (pre-marital, extramarital, homosexual)
criminal justice (prison crowding, recidivism)
slavery or human trafficking
The following sites may be helpful for discovering or exploring these and other qualified topics:
Center for Bioethics and Human Dignity
The Heritage Foundation
Family Research Council
The Rutherford Institute
The American Enterprise Institute
The Pew Forum on Religion in Public Life
The Discovery Institute
Speech Goals: Because this is a persuasive speech—a speech in which you try to persuade the audience to believe or value something or to act in a specific way—and because you are to use this particular speech to advocate a rede.
COMS 040 AssignmentStudent Congress Bill Choose an argument a.docxpatricke8
COMS 040 Assignment:
Student Congress Bill
Choose an argument and then research it, and write a Congress Bill (a proposed law). (3-5 Whereas clauses) Whereas INSERT FACT IN SUPPORT OF THE BILL/LEGISLATION
Whereas: INSERT FACT IN SUPPORT OF THE BILL/LEGISLATION
Whereas: INSERT FACT IN SUPPORT OF THE BILL/LEGISLATION.
Whereas: INSERT FACT IN SUPPORT OF THE BILL/LEGISLATION.
THEREFORE, BE IT RESOLVED BY THIS STUDENT CONGRESS: insert proposed legislation.
.
computerweekly.com 10-16 September 2019 21Industry experts.docxpatricke8
computerweekly.com 10-16 September 2019 21
Industry experts believe blockchain is a technology that has the potential to affect the business of most IT profession-als in the next five years. Analyst Gartner has forecast that by 2023, blockchain will support the global movement and
tracking of $2tn of goods and services.
It is regarded by many industry watchers as a disrupting force
in the financial world. A PwC global financial technology (fintech)
survey found that 56% of respondents recognise the importance
of blockchain. At the same time, however, 57% admit to being
unsure about or unlikely to respond to this trend.
Start witH tHe HaSH
Blockchain is effectively a shared ledger between a group of
people – for example, a group of companies that work together
to produce a service or product. What makes blockchain differ-
ent is the fact that the history of the changes – past transactions,
for example – are immutable.
Essentially, the historical entries become read-only and
unchangeable. This is due to the fact that each blockchain
entry relies on the hash – a computed value including part of a
previous block as part of its hashing calculation for the current
block. This means that if a previous block is somehow modi-
fied or corrupted, its hash value will change and therefore the
values after that point become broken, making the tampering
evident for all to see.
One example where blockchain technology can be used is
where several companies come together to provide or consume
Blockchain:
hype vs reality
Regarded by many as a
disruptive force in finance
and beyond, blockchain
technology presents a number
of complex challenges that
must be overcome before
it can truly deliver on its
promises. Stuart Burns reports
BUYER’S GUIDE TO BLOCKCHAIN TECHNOLOGY | PART 1 OF 3
Home
IU
R
IIM
O
TO
V
/A
D
O
B
E
http://www.computerweekly.com
https://www.computerweekly.com/resources/Blockchain
https://www.computerweekly.com/ehandbook/Cutting-through-the-blockchain-hype
https://www.computerweekly.com/ehandbook/Cutting-through-the-blockchain-hype
https://www.techtarget.com/contributor/Stuart-Burns
computerweekly.com 10-16 September 2019 22
Home
News
HMRC under fire
over ‘scaremongering’
IR35 letters targeting
GSK contractors
Ransomware has
evolved into a serious
enterprise threat
How Defra has
been preparing its
IT systems for any
Brexit eventuality
Editor’s comment
Buyer’s guide
to blockchain
Chasing down
hackers through
security analytics
How councils are using
technology to support
adult social care
Downtime
services, usually under long-term contracts. It can be complex
and cumbersome to manage contracts involving several individu-
als, when multiple documents are involved and everyone needs
to agree on the same contract versions and details. Over time,
changes will occur that also need to be managed and agreed on.
Managing contracts in blockchain, however, means that rather
than p.
Computers in Human Behavior 39 (2014) 387–392Contents lists .docxpatricke8
Computers in Human Behavior 39 (2014) 387–392
Contents lists available at ScienceDirect
Computers in Human Behavior
j o u r n a l h o m e p a g e : w w w . e l s e v i e r . c o m / l o c a t e / c o m p h u m b e h
Five days at outdoor education camp without screens improves preteen
skills with nonverbal emotion cues
http://dx.doi.org/10.1016/j.chb.2014.05.036
0747-5632/� 2014 The Authors. Published by Elsevier Ltd.
This is an open access article under the CC BY-NC-ND license (http://creativecommons.org/licenses/by-nc-nd/3.0/).
⇑ Corresponding author. Address: Department of Psychology, University of
California, Los Angeles, 616 Via De La Paz, Pacific Palisades, CA 90272, United
States. Tel.: +1 310 526 3316; fax: +1 310 230 7830.
E-mail address: [email protected] (Y.T. Uhls).
Yalda T. Uhls a,⇑, Minas Michikyan b, Jordan Morris c, Debra Garcia d,b, Gary W. Small e, Eleni Zgourou f,
Patricia M. Greenfield a
a Department of Psychology, University of California, Los Angeles, Children’s Digital Media Center @ LA, United States
b Department of Psychology, California State University, Los Angeles, Children’s Digital Media Center @ LA, United States
c Department of Social Welfare, University of California, Los Angeles, United States
d Department of Education, University of California, Los Angeles, United States
e Department of Psychiatry & Biobehavioral Sciences, University of California, Los Angeles, United States
f Department of Education, University of North Carolina, Chapel Hill, Children’s Digital Media Center @ LA, United States
a r t i c l e i n f o a b s t r a c t
Article history:
Available online 15 August 2014
Keywords:
Social media
Nonverbal communication
Emotion
Adolescent
Social interaction
Development
A field experiment examined whether increasing opportunities for face-to-face interaction while elimi-
nating the use of screen-based media and communication tools improved nonverbal emotion–cue recog-
nition in preteens. Fifty-one preteens spent five days at an overnight nature camp where television,
computers and mobile phones were not allowed; this group was compared with school-based matched
controls (n = 54) that retained usual media practices. Both groups took pre- and post-tests that required
participants to infer emotional states from photographs of facial expressions and videotaped scenes with
verbal cues removed. Change scores for the two groups were compared using gender, ethnicity, media
use, and age as covariates. After five days interacting face-to-face without the use of any screen-based
media, preteens’ recognition of nonverbal emotion cues improved significantly more than that of the con-
trol group for both facial expressions and videotaped scenes. Implications are that the short-term effects
of increased opportunities for social interaction, combined with time away from screen-based media and
digital communication tools, improves a preteen’s understanding of nonverbal emotional cues.
� 2014 The Authors. Publish.
Computers in Human Behavior xxx (2012) xxx–xxxContents lists.docxpatricke8
Computers in Human Behavior xxx (2012) xxx–xxx
Contents lists available at SciVerse ScienceDirect
Computers in Human Behavior
j o u r n a l h o m e p a g e : w w w . e l s e v i e r . c o m / l o c a t e / c o m p h u m b e h
Critical thinking in E-learning environments
Raafat George Saadé a,⇑, Danielle Morin a,1, Jennifer D.E. Thomas b,2
a Concordia University, John Molson School of Business, Montreal, Quebec, Canada
b Pace University, Ivan Seidenberg School of CSIS, New York, NY, USA
a r t i c l e i n f o
Article history:
Available online xxxx
Keywords:
E-learning
Critical thinking
Assessment
Information technology
0747-5632/$ - see front matter � 2012 Elsevier Ltd. A
http://dx.doi.org/10.1016/j.chb.2012.03.025
⇑ Corresponding author. Tel.: +1 514 848 2424; fax
E-mail address: [email protected] (R.G. Sa
1 Tel.: +1 514 848 2424; fax: +1 514 848 2824.
2 Tel.: +1 212 346 1569; fax: +1 212 346 1863.
Please cite this article in press as: Saadé, R. G., e
10.1016/j.chb.2012.03.025
a b s t r a c t
One of the primary aims of higher education in today’s information technology enabled classroom is to
make students more active in the learning process. The intended outcome of this increased IT-facilitated
student engagement is to foster important skills such as critical thinking used in both academia and
workplace environments. Critical thinking (CT) skills entails the ability(ies) of mental processes of discern-
ment, analysis and evaluation to achieve a logical understanding. Critical thinking in the classroom as well
as in the workplace is a central theme; however, with the dramatic increase of IT usage the mechanisms by
which critical thinking is fostered and used has changed. This article presents the work and results of
critical thinking in a virtual learning environment. We therefore present a web-based course and we
assess in which parts of the course, and to what extent, critical thinking was perceived to occur. The course
contained two categories of learning modules namely resources and interactive components. Critical
thinking was measured subjectively using the ART scale. Results indicate the significance of ‘‘interactivity’’
in what students perceived to be critical-thinking-oriented versus online material as a resource. Results
and opportunities that virtual environments present to foster critical thinking are discussed.
� 2012 Elsevier Ltd. All rights reserved.
1. Introduction
One of the primary aims of higher education in today’s informa-
tion technology (IT) enabled classroom, is to make students more
active in the learning process (Ibrahim & Samsa, 2009). The in-
tended outcome of this increased IT-facilitated student engage-
ment is to foster important skills such as critical thinking. Given
the importance of information technology for critical thinking in
learning, it is vital that we understand better the associated key
factors related to: background of students, beliefs, perceptions
and attitudes and associated anteceden.
Computers can be used symbolically to intimidate, deceive or defraud.docxpatricke8
Computers can be used symbolically to intimidate, deceive or defraud victims. The basic law that protects our privacy is the Fourth Amendment to the United States Constitution, which mandates that people have a right to be secure in homes and against unreasonable search and seizure. What law(s) have been enacted to protect individuals at the state or federal government? Does these protection laws vary from state to state?
.
Computers are often used to make work easier. However, sometimes c.docxpatricke8
Computers are often used to make work easier. However, sometimes computers can make work more difficult especially with poorly implementation. SOX is an important example of a poorly implemented database that has encountered. A database should have its specific intentions as much as data organization and management always exist as general functions. The SOX database implemented in 2011 was put in place to combat fraud by coming up with efficient accounting audit and management of financial records. I think the developers failed to include technical aspects of fraud control into the system. They instead targeted the visible crimes leaving very many holes for exploiting the SOX system (Anand et al., 2014).
The database seems vague from IT perspective. The database constitutes only two sections of codes relating to IT. These two sections merely meet the standards for testing IT sufficient auditing compliance by organizations. The database seems to be far off the role of fostering sufficient auditing process for these organizations. Since inception, most audit companies struggle to figure out the IT protective aspects of the database. It seems that the developers mainly focused on the guidelines in using financial systems in preventing frauds but rather forgot the IT aspect if reducing the vulnerability of the system. For so many years, the database has failed to meet the technical roles of a database in system management and accounting regulation which are the critical reason why it was created. The SOX guidelines seem to forget about pertinent technical aspects of the system function (Cinarkaya et al., 2017).
The solutions to the mistake that was done are conducting technical analysis and installing appropriate fixing. Ideally, the database should target electronic management and safety of data rather than physical data management. This mistake of poorly implemented gave a false impression of database management in many companies that adopted the type of database in early days. From physical outlook, one could see that things are alright yet some technical rot was brewing within the system. It is clear that the developers of the SOX database missed some point while deriving and implementing the database and this should be fixed to enhance the computer-based operations (Anand et al., 2014).
References
Anand, T. S., Wikle, G. K., Lindsay, M. P., Schubert, R. N., Lettington, D. T., & Ludwig, J. P. (2014). U.S. Patent No. 5,832,496. Washington, DC: U.S. Patent and Trademark Office.
Cinarkaya, B., Tamm, S., Sureshchandra, J., Warshavsky, A., Bulumulla, I. U., Fry, B., ... & Brooks, D. (2017). U.S. Patent No. 9,825,965. Washington, DC: U.S. Patent and Trademark Office.
.
Computers are part of our everyday lives. You are likely reading thi.docxpatricke8
Computers are part of our everyday lives. You are likely reading this assignment on a computer screen right now; you may have a smart phone sitting on your desk, and maybe you just came back from a business trip during which you made airline and hotel reservations online. Over the last several years, you may have noticed that computers are able to store more information and process that information more quickly. New research into the electron spin of atoms hints at a new computer revolution in the near future.
Assignment
For this project, you will be exploring the developments in material science that have allowed computers to become so fast. To do so, please address the following in 3–4 pages, not including title and reference pages:
What are the 3 essential properties of every material?
New materials often lead to new technologies that change society. Describe how silicon-based semiconductors revolutionized computing.
What are microchips? How are they related to integrated circuits?
One of the pressing questions about the increasing ability of computers to quickly process large amounts of information is whether a computer can be built that is considered "alive" or "conscious." What is artificial intelligence? What are 2 essential differences between human brains and the central processing unit of a computer?
Click on the following link to review additional information in a video relevant to this assignment:
Will Computers Out-think Us?
.
Computerized Operating Systems (OS) are almost everywhere. We encoun.docxpatricke8
Computerized Operating Systems (OS) are almost everywhere. We encounter them when we use our laptop or desktop computer. We use them when we use our phones or tablet. Find peer-reviewed articles that discuss the advantages and disadvantages of at least two different Robotic Operating Systems (ROS).
250 words, APA format with references
.
Computerized Operating Systems (OS) are almost everywhere. We en.docxpatricke8
Computerized Operating Systems (OS) are almost everywhere. We encounter them when we use out laptop or desktop computer. We use them when we use our phone or tablet. Find articles that describes the different types of operating systems (Linux, Unix, Android, ROS, z/OS, z/VM, z/VSE, etc).
Do not select MS WINDOWS
. Write a scholarly review of comparing any two or more OS.
It should be at
least 10-15 pages
with at
least 5 APA
citations & matching references.
Formatting
: Introduction; Image / Table; Conclusion; 12 TNR font; double space; clearly divided small paragraphs; bold & underline headings;
.
Computer technology ▪ Information systems ▪ Data analytics supply c.docxpatricke8
Computer technology ▪ Information systems ▪ Data analytics /supply chain management ▪ Sensors/cameras and overall tracking monitoring equipment • Research Paper—the research paper is not a rehash of the company’s initiatives (Walmart vs Amazon) but rather a deep-dive analysis of the research you have found. This should include: ▪ a focused narrative of the area you researched (either company) ▪ Key takeaways and next steps ▪ your thoughts on the matter—either positive or negative at it pertains to your research
.
Unit 8 - Information and Communication Technology (Paper I).pdfThiyagu K
This slides describes the basic concepts of ICT, basics of Email, Emerging Technology and Digital Initiatives in Education. This presentations aligns with the UGC Paper I syllabus.
Honest Reviews of Tim Han LMA Course Program.pptxtimhan337
Personal development courses are widely available today, with each one promising life-changing outcomes. Tim Han’s Life Mastery Achievers (LMA) Course has drawn a lot of interest. In addition to offering my frank assessment of Success Insider’s LMA Course, this piece examines the course’s effects via a variety of Tim Han LMA course reviews and Success Insider comments.
Instructions for Submissions thorugh G- Classroom.pptxJheel Barad
This presentation provides a briefing on how to upload submissions and documents in Google Classroom. It was prepared as part of an orientation for new Sainik School in-service teacher trainees. As a training officer, my goal is to ensure that you are comfortable and proficient with this essential tool for managing assignments and fostering student engagement.
Acetabularia Information For Class 9 .docxvaibhavrinwa19
Acetabularia acetabulum is a single-celled green alga that in its vegetative state is morphologically differentiated into a basal rhizoid and an axially elongated stalk, which bears whorls of branching hairs. The single diploid nucleus resides in the rhizoid.
Model Attribute Check Company Auto PropertyCeline George
In Odoo, the multi-company feature allows you to manage multiple companies within a single Odoo database instance. Each company can have its own configurations while still sharing common resources such as products, customers, and suppliers.
The French Revolution, which began in 1789, was a period of radical social and political upheaval in France. It marked the decline of absolute monarchies, the rise of secular and democratic republics, and the eventual rise of Napoleon Bonaparte. This revolutionary period is crucial in understanding the transition from feudalism to modernity in Europe.
For more information, visit-www.vavaclasses.com
A Strategic Approach: GenAI in EducationPeter Windle
Artificial Intelligence (AI) technologies such as Generative AI, Image Generators and Large Language Models have had a dramatic impact on teaching, learning and assessment over the past 18 months. The most immediate threat AI posed was to Academic Integrity with Higher Education Institutes (HEIs) focusing their efforts on combating the use of GenAI in assessment. Guidelines were developed for staff and students, policies put in place too. Innovative educators have forged paths in the use of Generative AI for teaching, learning and assessments leading to pockets of transformation springing up across HEIs, often with little or no top-down guidance, support or direction.
This Gasta posits a strategic approach to integrating AI into HEIs to prepare staff, students and the curriculum for an evolving world and workplace. We will highlight the advantages of working with these technologies beyond the realm of teaching, learning and assessment by considering prompt engineering skills, industry impact, curriculum changes, and the need for staff upskilling. In contrast, not engaging strategically with Generative AI poses risks, including falling behind peers, missed opportunities and failing to ensure our graduates remain employable. The rapid evolution of AI technologies necessitates a proactive and strategic approach if we are to remain relevant.
Francesca Gottschalk - How can education support child empowerment.pptxEduSkills OECD
Francesca Gottschalk from the OECD’s Centre for Educational Research and Innovation presents at the Ask an Expert Webinar: How can education support child empowerment?
Welcome to TechSoup New Member Orientation and Q&A (May 2024).pdfTechSoup
In this webinar you will learn how your organization can access TechSoup's wide variety of product discount and donation programs. From hardware to software, we'll give you a tour of the tools available to help your nonprofit with productivity, collaboration, financial management, donor tracking, security, and more.
Biological screening of herbal drugs: Introduction and Need for
Phyto-Pharmacological Screening, New Strategies for evaluating
Natural Products, In vitro evaluation techniques for Antioxidants, Antimicrobial and Anticancer drugs. In vivo evaluation techniques
for Anti-inflammatory, Antiulcer, Anticancer, Wound healing, Antidiabetic, Hepatoprotective, Cardio protective, Diuretics and
Antifertility, Toxicity studies as per OECD guidelines
Concept mapping, mind mapping and argumentmapping what are .docx
1. Concept mapping, mind mapping and argument
mapping: what are the differences and do they matter?
Martin Davies
Published online: 27 November 2010
� Springer Science+Business Media B.V. 2010
Abstract In recent years, academics and educators have begun to
use software map-
ping tools for a number of education-related purposes.
Typically, the tools are used to
help impart critical and analytical skills to students, to enable
students to see rela-
tionships between concepts, and also as a method of assessment.
The common feature
of all these tools is the use of diagrammatic relationships of
various kinds in preference
to written or verbal descriptions. Pictures and structured
diagrams are thought to be
more comprehensible than just words, and a clearer way to
illustrate understanding of
complex topics. Variants of these tools are available under
different names: ‘‘concept
mapping’’, ‘‘mind mapping’’ and ‘‘argument mapping’’.
2. Sometimes these terms are used
synonymously. However, as this paper will demonstrate, there
are clear differences in
each of these mapping tools. This paper offers an outline of the
various types of tool
available and their advantages and disadvantages. It argues that
the choice of mapping
tool largely depends on the purpose or aim for which the tool is
used and that the tools
may well be converging to offer educators as yet unrealised and
potentially comple-
mentary functions.
Keywords Concept mapping � Mind mapping � Computer-
aided argument mapping �
Critical thinking � Argument � Inference-making �
Knowledge mapping
Introduction
In the past 5–10 years, a variety of software packages have been
developed that enable the
visual display of information, concepts and relations between
ideas. These mapping tools
take a variety of names including: ‘‘concept mapping’’, ‘‘mind
mapping’’ or ‘‘argument
mapping’’. The potential of these tools for educational purposes
3. is only now starting to be
realised.
M. Davies (&)
University of Melbourne, Parkville, VIC, Australia
e-mail: [email protected]
123
High Educ (2011) 62:279–301
DOI 10.1007/s10734-010-9387-6
The idea of displaying complex information visually is, of
course, quite old. Flow
charts, for example, were developed in 1972 (Nassi and
Shneiderman 1973) pie charts and
other visual formats go back much earlier (Tufte 1983). More
recently, visual displays
have been used to simplify complex philosophical issues (Horn
1998). Formal ways of
‘‘mapping’’ complex information—as opposed to the earth’s
surface, countries, cities and
other destinations—began at least 30 years ago, and arguably
even earlier.
More recently, the use of information and computer technology
has enabled information
mapping to be achieved with far greater ease. A plethora of
4. software tools has been
developed to meet various information mapping needs. What do
these tools do? What are
their similarities and differences? What are their advantages and
disadvantages? How
precisely do they enhance teaching and learning? This paper
considers these questions and
reviews three most commonly used mapping devices. The paper
claims that the type of
information mapping tool to be used is largely a function of the
purpose for which it is
intended. A clear understanding of the nature and
distinctiveness of these tools may offer
educators as yet unrealised and potentially complementary
functions to aid and enhance
student learning.
The purpose and justification for mapping tools
The over-riding aim of all mapping techniques is similar. If
students can represent or
manipulate a complex set of relationships in a diagram, they are
more likely to understand
those relationships, remember them, and be able to analyse their
component parts. This, in
5. turn, promotes ‘‘deep’’ and not ‘‘surface’’ approaches to
learning (Biggs 1987; Entwistle
1981; Marton and Saljo 1976a, b; Ramsden 1992). Secondly, for
most people, maps are
also much easier to follow than verbal or written descriptions,
although reservations need
to be made in terms of the kinds of ‘‘maps’’ under
consideration, for not all maps are equal
(Larkin and Simon 1987; Mayer and Gallini 1990). Thirdly, the
work involved in map-
making requires more active engagement on the part of the
learner, and this too leads to
greater learning (Twardy 2004).
There is empirical support for the use of mapping in enhancing,
retaining and improving
knowledge. Evidence from the cognitive sciences shows that
visual displays do enhance
learning (Vekiri 2002; Winn 1991). Maps allow the separate
encoding of information in
memory in visual and well as propositional form, a phenomenon
called ‘‘conjoint reten-
tion’’ or ‘‘dual coding’’ (Kulhavy et al. 1985; Paivio 1971,
1983; Schwartz 1988). In the
former hypothesis, representations are encoded as separate
6. intact units; in the latter, visual
representations are synchronously organised and processed
simultaneously and verbal
representations are hierarchically organised and serially
processed (Vekiri 2002). In simple
terms, processing information verbally as well as pictorially
helps learning by virtue of
using more than one modality. In a later section, I will return to
the educational justifi-
cation of mapping tools and why they work in more detail.
While the overriding objectives of mapping tools are similar,
there are differences in
their application. Mind mapping allows students to imagine and
explore associations
between concepts; concept mapping allows students to
understand the relationships
between concepts and hence understand those concepts
themselves and the domain to
which they belong; argument mapping allows students to
display inferential connections
between propositions and contentions, and to evaluate them in
terms of validity of argu-
ment structure and the soundness of argument premises. The
next section of this paper
outlines each tool and briefly reviews their advantages and
disadvantages.
7. 280 High Educ (2011) 62:279–301
123
The mapping tools
An attempt has recently been made to outline the similarities
and differences between
different mapping techniques (Eppler 2006). However, no
mention was made of the most
recent computer-aided mapping tool, argument mapping. This
paper updates this earlier
paper and outlines three key types of mapping: mind mapping,
concept mapping and
argument mapping with an emphasis on the software tools used
to make the maps.
Mind mapping
Mind mapping (or ‘‘idea’’ mapping) has been defined as
‘visual, non-linear representations
of ideas and their relationships’ (Biktimirov and Nilson 2006).
Mind maps comprise a
network of connected and related concepts. However, in mind
mapping, any idea can be
connected to any other. Free-form, spontaneous thinking is
required when creating a mind
8. map, and the aim of mind mapping is to find creative
associations between ideas. Thus,
mind maps are principally association maps. Formal mind
mapping techniques arguably
began with Buzan (Buzan 1974; Buzan and Buzan 2000). These
techniques involved using
line thicknesses, colours, pictures and diagrams to aid
knowledge recollection. Buzan
makes the following recommendations when mind mapping
(http://www.mindmap
example.com/samples.php, Buzan and Buzan 2000).
1. Place an image or topic in the centre using at least 3 colours
2. Use images, symbols, codes, and dimensions throughout your
Mind Map.
3. Select key words and print using upper or lower case letters.
4. Each word/image is alone and sitting on its own line.
5. Connect the lines starting from the central image. The central
lines are thicker,
organic and flowing, becoming thinner as they radiate out from
the centre.
6. Make the lines the same length as the word/image.
7. Use colours—your own code—throughout the Mind Map.
9. 8. Develop your own personal style of Mind Mapping.
9. Use emphasis and show associations in your Mind Map.
10. Keep the Mind Map clear by using radial hierarchy,
numerical order or outlines to
embrace your branches.
Concept maps, as we shall see, do not use such pictorial and
graphical design flourishes.
An example of a mind map on the topic on things to consider
for a presentation is given in
Fig. 1.
The main use of mind mapping is to create an association of
ideas. However, another
use is for memory retention—even if the advantages in the case
of mind mapping might be
marginal (Farrand et al. 2002b). It is generally easier to
remember a diagram than to
remember a description. Others have suggested, however, that
content is more central to
learning than the format in which that content is presented
(Pressley et al. 1998).
Mind mapping has been used in a variety of disciplines,
including Finance (Biktimirov
and Nilson 2006), Economics (Nettleship 1992), Marketing
(Eriksson and Hauer 2004),
10. Executive Education (Mento et al. 1999), Optometry (McClain
1987) and Medicine
(Farrand et al. 2002a). It is also widely used in professions such
as Fine Art and Design,
Advertising and Public Relations.
1
1
A list of mind mapping software is available (‘‘List of Mind
Mapping Software,’’ 2008) and (‘‘Software
for Mind mapping and Information Storage,’’ 2008).
High Educ (2011) 62:279–301 281
123
http://www.mindmapexample.com/samples.php
http://www.mindmapexample.com/samples.php
The advantages of mind mapping include its ‘‘free-form’’ and
unconstrained structure.
There are no limits on the ideas and links that can be made, and
there is no necessity to
retain an ideal structure or format. Mind mapping thus promotes
creative thinking, and
encourages ‘‘brainstorming’’. A disadvantage of mind mapping
is that the types of links
11. being made are limited to simple associations. Absence of clear
links between ideas is a
constraint. Mind maps have been said to be idiosyncratic in
terms of their design, often
hard for others to read; representing only hierarchical
relationships (in radial form);
inconsistent in terms of level of detail; and often too complex
and missing the ‘‘big
picture’’ (Eppler 2006; Zeilik, nd). Mind mapping is also
limited in dealing with more
complex relationships. For example, mind mapping might be
useful to brainstorm the
things that are critical for students to recall in an exam (or a
presentation, as in the example
provided). However, it is hard to see it being useful for a
purpose that requires an
understanding of how one concept is essential to understanding
another. More complex
topics require more than an associational tool, they require
relational analysis. The tool of
concept mapping has been developed to address these
limitations of mind mapping.
Concept mapping
Concept mapping is often confused with mind mapping
12. (Ahlberg 1993, 2004; Slotte and Lonka
1999). However, unlike mind mapping, concept mapping is
more structured, and less
pictorial in nature. The aim of concept mapping is not to
generate spontaneous associative
elements but to outline relationships between ideas. Thus,
concept mapping is a relational
device. A concept map has a hierarchical ‘‘tree’’ structure with
super-ordinate and subor-
dinate parts (primary, secondary and tertiary ideas). The map
normally begins with a word
or concept or phrase which represents a focus question that
requires an answer (Novak and
Cañas 2006). Cross-links using connective terms (usually
prepositional phrases) such as
‘‘leads to’’, ‘‘results from’’, ‘‘is part of’’, etc., are used to
show relationships between
Fig. 1 A Mind Map (‘‘Mind Maps Made With Mind Mapping
Tool’’)
282 High Educ (2011) 62:279–301
123
concepts represented. Examples (not shown here) are added to
terminal concepts as
instances but these are not enclosed in boxes or circles as they
13. are not concepts but represent
instances of a concept. Two quite different concept maps are
given below on the focus
question: What is the purpose of concept mapping? Fig. 2.
The difference between mind mapping and concept mapping is
also at the level of
precision and formality. Mind maps are less formal and
structured. Concept maps are
formal and generally more tightly structured. Mind maps
emphasise diagrams and pictures
to aid recall of associations; concept maps generally use
hierarchical structure and rela-
tional phrases to aid understanding of relationships. However,
concept maps can take a
variety of forms ranging from hierarchical, to non-hierarchical
forms, and even data-driven
maps where the input determines the shape of the map. One
recent form of the latter
involves a statistical process known as agglomerative cluster
analysis when analysis is
made of terms that appear in a text across a number of
respondents which are then
Fig. 2 Two different Novakian-style concept maps using the
software CMap (http://cmap.ihmc.us/
conceptmap.html) (from ‘‘Concept Map,’’ 2010; Zeilik nd)
14. High Educ (2011) 62:279–301 283
123
http://cmap.ihmc.us/conceptmap.html
http://cmap.ihmc.us/conceptmap.html
‘‘clustered’’ to form a diagrammatic representation (Jackson
and Trochim 2002; Trochim
1989).
A non-hierarchical, style of concept map on the influence of
labour market on the
economy is given in Fig. 3. While non-hierarchical, this map
has more similarities to a
concept map than a mind map as it endeavours to establish
appropriate relationships
between the economic concepts rather than simple associations.
However, it has similarities
to a mind map as well in terms of its looser, non-hierarchical,
unstructured form.
The development of concept mapping has been attributed to the
work of Novak as early
as 1972 and his work on children’s developing knowledge of
science concepts (Novak and
Cañas 2006). This work, in turn, was inspired by the work of
15. learning psychologist
Ausubel (Ausubel 1963). The mapping technique was refined
further (Novak 1981) and
then extended to the educational context (Novak and Gowin
1984). The resulting diagrams
are sometimes known as ‘‘Novakian maps’’ in honour of their
founder. As noted, alter-
native approaches are also available (Jackson and Trochim
2002).
Recent additions to the Novakian format include attempts to
capture ‘‘cyclical’’ rela-
tionships representing complex natural and social systems
(Safayeni et al. 2005). Tech-
nology has aided the popularity of concept mapping by means of
dedicated software tools
such as CMap Tools (Cañas et al. 2004) and Compendium.
2
Such is the interest in concept
mapping, an annual international conference began in 2005.
There are several stages in developing a Novakian concept map.
However, the stages
are very different from developing a mind map:
Fig. 3 Non-linear concept map on labour market economics
16. 2
Cmap Tools is available free from the Institute of Human and
Machine Cognition (http://www.ihmc.us).
Compendium is available from the Open University
(http://www.labspace.open.ac.uk). A list of concept
mapping software is available here (‘‘List of Concept Mapping
Software,’’ 2008).
284 High Educ (2011) 62:279–301
123
http://www.ihmc.us
http://www.labspace.open.ac.uk
1. Develop a declarative-type focus question (e.g., ‘‘What is
inflation?’’)
2. Devise a ‘‘parking lot’’ of concepts and ideas that are related
to the concept of
inflation, and the question to be answered. The purpose of this
stage is brainstorming.
The resulting concepts may or may not be used in the final map
(Novak and Cañas
2006). The concepts are placed in circles or boxes to designate
them as concepts.
3. Put concepts in hierarchical order of importance in a
provisional map. An ‘‘expert
17. skeleton map’’ can be started by an instructor in a class to
scaffold the learning
process, aid student participation and give students confidence.
Students can complete
the map themselves with the focus question and concepts
provided.
4. Link lines are then provided between the hierarchical
concepts from top to bottom.
The conventions have changed over the decades since the
inception of concept
mapping. Arrows were originally only used when it is necessary
to link a lower
concept with a higher concept. However, this convention has
recently been revised by
concept mappers to allow for arrows for all directions (Ahlberg
2004).
5. Devise suitable cross-links for key concepts in the map.
Verbs and prepositions/
prepositional phrases are used most frequently, for example:
‘‘requires’’, ‘‘to work
with’’, ‘‘will lead to’’, ‘‘involves’’, ‘‘during’’, ‘‘of’’,
‘‘through’’, and so on. The aim is to
show the relationship between the key concepts and their
subordinate or super-ordinate
18. elements.
6. Add examples to the terminal points of a map representing
the concepts. These are not
enclosed in boxes or circles to delineate them as instances of a
concept.
Since its inception as a formal technique, concept mapping has
been widely used in
academic disciplines, for example, Accounting (Chei-Chang
2008; Irvine et al. 2005;
Leauby and Brazina 1998; Maas and Leauby 2005; Simon 2007;
van der Laan and Dean
2006), Finance (Biktimirov and Nilson 2003), Engineering
(Walker and King 2002),
Statistics (Schau and Mattern 1997), Reading Comprehension
(Mealy and Nist 1989),
Biology (Kinchin 2000), Nursing (Baugh and Mellott 1998;
King and Shell 2002; Schuster
2000; Wilkes et al. 1999), Medicine (Hoffman et al. 2002;
McGaghie et al. 2000; West
et al. 2000), Nursing (Beitz 1998) and Veterinary Science
(Edmonson 1993).
Research has also been done on concept mapping as an
assessment tool (Gouveia and
Valadares 2004; Jonassen et al. 1997; van der Laan and Dean
19. 2006) and as a way to assist
academics in course design (Amundsen at al. 2008) and in
managing qualitative data
(Daley 2004). Several empirical studies have ascertained the
validity of the use of concept
maps (Markham et al. 1994; Ruiz-Primo and Shavelson 1996).
The main advantage of concept mapping is precisely its
relational aim. Concept maps
enable relational links to be made between relevant concepts. In
the educational context, it
is claimed that meaningful learning best takes place by linking
new concepts to existing
knowledge (Craik and Lockhart 1972; Maas and Leauby 2005).
Concept maps enable ‘the
elements of [learning] to relate to how cognitive knowledge is
developed structurally by
the learner’ (Maas and Leauby 2005, p. 77).
The main disadvantages of concept mapping are that they
require some expertise to
learn; they can be idiosyncratic in terms of design; and because
of their complexity they
may not always assist memorability, with learners faced with
designing concepts maps
20. often feeling overwhelmed and de-motivated (Beitz 1998;
Eppler 2006; Kinchin 2001).
Others have noted that the rigid rules used for identifying
concepts and their multiple
relationships does not make the process simple or easily to
learn, and the linear nature of
concept maps mean that they are not adequate to capture more
complex relationships
High Educ (2011) 62:279–301 285
123
between concepts. In particular, they do not enable easy
separation of concepts of critical
importance from those of secondary importance (Daley 2004).
It is also impossible to distinguish identification of concepts
from identification of
arguments using a concept map. For example, it is easy to
imagine developing a concept
map that canvasses the causes and effects of the global financial
crisis. In a complex issue
such as this, multiple causes can be linked to effects by means
of relational arrows. A
major disadvantage of concept mapping, however, is that it is
21. limited to relations between
concepts. Many issues require more than an identification of
relationships between con-
cepts; they require arguments to be made for positions that need
to be defended, and
objections to those positions. For example, it is difficult to
imagine how a concept map
could represent an argument for the claim that: ‘‘The US should
have intervened earlier in
the global currency crisis’’. This kind of relationship is not,
strictly speaking, relational.
This is, of course, not the fault of the concept mapping format.
Concept mapping is a tool
that was designed for a different purpose. This is a limitation of
concept mapping and it has
led to the development of a new kind of tool; a tool for mapping
arguments.
Argument mapping
A relatively recent innovation, developed since 2000, is
computer-aided argument map-
ping (CAAM). Available in a wide-range of software formats,
3
argument mapping has a
different purpose entirely from mind maps and concept maps.
Argument mapping is
22. concerned with explicating the inferential structure of
arguments. Where images and topics
are the main feature of associative connections in mind maps,
and concepts are the main
relationships in concept maps, inferences between whole
propositions are the key feature
of argument maps.
‘‘Arguments’’ are understood in the philosopher’s sense of
statements (‘‘premises’’)
joined together to result in claims (‘‘conclusions’’). An example
of an argument map
defending the proposition that The Reserve Bank will increase
interest rates is given in
Fig. 4. At the first (top) level of the argument there is the
contention. This is followed in
this example by a supporting claim (under the link word
‘‘because’’) and an objection
(under the link word ‘‘but’’). These are, in turn, supported by
more claims of support or
objection (which become rebuttals when they are objections to
objections): In the software,
claims, objections and rebuttals are coloured differently.
Finally, basis boxes which pro-
vide defence for the terminal claims, are provided at the end of
the argument tree.
Objections and rebuttals to objections can be added at any point
in the map (in different
23. colours for easier visual identification). The ‘‘basis’’ boxes at
the terminal points of the
argument also require evidence in place of the brackets
provided. Some evidence has been
provided (‘‘statistics’’, ‘‘expert opinion’’, ‘‘quotation’’).
Unlike mind mapping and concept mapping, argument mapping
is interested in the
inferential basis for a claim being defended and not the causal
or other associative rela-
tionships between the main claim and other claims. The
software also allows for an
automatically-generated description of the argument in text-
form. In some template
argument formats—provided with the software—the mapping
program also constructs a
prose version of the argument complete with a limited display
of linking words. However,
this function is presently underdeveloped, and is a caricature of
what would be needed in
university-style assignment. However, this impressive facility is
indicative of where
software tools are headed.
3
Harrell provides a comprehensive list of argument mapping
24. software (Harrell 2008).
286 High Educ (2011) 62:279–301
123
As noted, CAAM is still fairly new. Nonetheless, there have
been several studies
demonstrating its impact on student learning, especially
improvements in critical thinking
(Twardy 2004; van Gelder 2001; van Gelder et al. 2004).
Twardy demonstrated an
improvement in critical thinking skills as measured by a
standard instrument in pre- and
post-test by a 0.72 gain of standard deviations. Van Gelder,
Bissett and Cumming dem-
onstrated an even higher gain of 0.8 standard deviations in their
study. A very recent study
demonstrated greatest gains in students with the poorest
argument analysis skills in two
separate studies over the course of one semester (Harrell 2011)
The main advantage argument mapping may have over other
forms of mapping tools is
that it focuses on a certain sub-class of relationships (i.e.,
logical inferences between
25. propositions). It also puts limitations around the items being
mapped. There is a clear sense
in which arguments—and not relationships and associations—
have ‘‘boundaries’’. Even-
tually, all reasons have to be grounded. These grounds are
presented as terminal ‘‘basis’’
boxes for assumptions. These are then evaluated for plausibility
as shown. With mind
mapping and concept mapping, connections can potentially go
on ‘‘forever’’.
A weakness of argument mapping is also its strength; argument
mapping does not
capture looser, more tangential relationships, e.g., cause and
effect. This makes it a tool
with a very precise purpose. However, as we shall see in the
final section, there is no reason
why the advantages of argument maps cannot be supplemented
with the advantages of
other available tools, and with additional refinements that do
not exist at present.
Another disadvantage of argument mapping is that it can assume
too much. In the
educational context, argument mapping exercises can assume
that students have a suffi-
26. ciently clear understanding of a topic or issue and the precise
nature of the task at hand.
However, this understanding may often be absent. Students
themselves may need to define
because
because because
but
but
because however
The Reserve Bank
(RB)will increase
interest rates.
Inflation
Inflation needs to
be reduced.
2.9% too high
The underlying
inflation rate of
2.9% is too high.
Web
ABC news online
Expert Opinion
Macquarie Bank senior
27. economist Brian Redican
CPI rising
The Consumer
Price Index (CPI)
is rising at 1.9 %.
Statistic
Reserve bank
of Australia
RBA website
This rise is lowest in
nearly eight years.
Web
ABC news online
Election
The RB will not
change interest
rates during an
election campaign.
The Reserve Bank
will be reluctant to
influence the
outcome of the
election.
The RB Governor
has said an election
would not stop him.
28. Common Belief
The claim is widely
believed.
Quote
"If it's clear that something needs to be
done, I don't know what explanation we
could offer the Australian public for not
doing it, regardless of when an election
might be due."
- Glenn Steven, Reserve Bank Governor
ABC news
Fig. 4 Argument map using the software Rationale
(http://www.austhink.com)
High Educ (2011) 62:279–301 287
123
http://www.austhink.com
the scope of the issue to be addressed and the exact parameters
of the task. For example,
faced with an essay topic as:
• The changing roles of men and women have been good for
society. Discuss.
Students may initially create a series of arguments which
29. implicitly focus on changes in
their society, the society in which they are presently living, or
perhaps developed Western
countries generally. They may never actually articulate what the
changes might be, or in
what respects (or for whom) they might be considered ‘‘good’’
(nor might they define what
‘‘good’’ means). They may not consider whether or not to
confine themselves to particular
changes that have taken place over a particular time period in a
particular culture.
Assignment topics are often deliberately ambiguous to allow
students to demonstrate their
abilities in deconstructing the meaning of the topic itself.
Working out what needs to do in an essay and why is a
preparatory, and a critically
important step, to being able to map an argument successfully.
Students will have to do a
considerable amount of initial reading and thinking and struggle
with key concepts before
coming to an understanding of the exact task they need to
complete. It is only after this
process that the student can map an argument. Argument
mapping software offers no help
with these preparatory steps. However, this is precisely where a
30. further development in
mapping technologies might be able to help (see ‘‘A
convergence of mapping tools?’’).
Table 1 summarises the differences between the three forms of
mapping discussed in
this paper.
Notice that argument mapping shares the hierarchical form with
concept mapping,
and—in some variants at least—argument mapping shares the
design principles of colours,
shading, and line thicknesses with mind mapping. Note too the
increasing level of
sophistication in the tools. Where mind maps have a high degree
of generality in their
application, concept maps are more specific (focussing on
relational factors) and argument
mapping is the least general (more specific) in application of
all. This indicates, in one
sense, some degree of perhaps unintended evolutionary
sophistication in the development
of these tools. In the final section of this paper, suggestions will
be made on the new
directions that this evolution might take.
31. An important area of difference between the mapping
techniques is in the register and
formality of language used, i.e., the differences in linguistic
‘‘granularity’’ (see column to
far right of table). Whereas in mind mapping the language is
fairly ‘‘loose’’, and can
capture a variety of associative relationships, in argument
mapping the linguistic rela-
tionships are limited to whole propositions or statements linked
by logical connectors such
as ‘‘because’’ or ‘‘however’’. Argument mapping requires
precise rules of construction.
This forces explicit connections between propositions (from
premises to conclusions or
contentions). Argument mapping thereby demonstrates a
specific utility and considerable
fitness to purpose. Mind mapping does not have these
constraints. Concept mapping
occupies a space in-between the loose and tightly constrained
language in argument maps,
and the looser, tangential, associative language of mind maps.
Concept maps typically
involve the use of prepositional phrases such as ‘‘in relation
to’’, ‘‘is a result of’’, and so on;
but, as we have seen, sometimes these rules are not adhered to.
32. Compare, for example, the
very different examples of concept maps given earlier. The non-
linear economics concept
map has elements of a more constrained mind map as well as
having similarities to a
concept map.
This highlights an important difference in terms of flexibility.
Mind maps can some-
times take on similarities to concept maps, and can occupy a
more structured place further
along the continuum between the three mapping types. It has a
wider utility. This is not
288 High Educ (2011) 62:279–301
123
T
a
b
le
1
S
u
m
54. e
d
High Educ (2011) 62:279–301 289
123
the case with argument maps which have a very specific utility.
Therefore there is an
asymmetry in terms of the degree to which the mapping types
can overlap in function.
The rules for mind mapping do not make any specific
assumptions about learning as a
process or the nature of knowledge. The rules are ‘‘looser’’ and
therefore a mind map can
sometimes take on the characteristics of a concept map. By
contrast, a map that would
satisfy the rules for an argument map, cannot be a mind map
because the rules of
application are much stricter. A concept map occupies
something of a middle ground,
but is closer in form to a mind map than an argument map (I am
indebted to an
anonymous reviewer for this point).
Why mapping tools work
55. The most important reason for the widespread use of mapping
tools is that they are claimed
to benefit student learning. The educational justification for
mapping tools was outlined
briefly in ‘‘The purpose and justification for mapping tools’’.
However, specific details
which might explain why mapping tools work were not
discussed.
Knowledge mapping allows meaningful learning to occur
Hay et al. usefully distinguish between ‘‘non-learning’’, ‘‘rote
learning’’ and ‘‘mean-
ingful learning’’ (Hay et al. 2008). Using the pedagogical views
of Kolb and Jarvis
(Jarvis 1992; Kolb and Fry 1975) along with an application of
concept mapping tools,
they track changes in knowledge that results from the
presentation of learning material
to university students (Hay et al. Forthcoming). They find that
measurable improve-
ments in meaningful learning occur using concept mapping
under test conditions with
control groups.
They find that non-learning occurs when no detectable change
in knowledge occurs
56. before and after the presentation of new material. Rote learning
occurs when new infor-
mation is added (or rejected) in a students’ knowledge store, but
there is no new integration
made between the new or substituted information. Students
accept and reject information
but do not think about it or relate it to other knowledge they
possess. Meaningful learning,
by contrast, occurs when new perspectives are integrated into
the knowledge structure and
prior concepts of the student. The Fig. 5 explains these
differences. Hay et al. find that
concept mapping can ‘significantly add to the quality of
university teaching’ as it promotes
meaningful learning (Hay et al. 2008, p. 308).
Mapping allows the presentation of new material to build on
existing knowledge
Having a source of prior knowledge that is well-structured and
retrievable allows students
to ‘‘scaffold’’ new learning. This enables meaningful learning
to occur. Structured dia-
grams incorporating prose—such as the mapping devices
mentioned in the paper—are able
to represent new information better than traditional discursive
prose on its own (van Gelder
57. 2007). This, in turn, allows efficient learning and integration
with information stored in
memory. There are two reasons why this occurs: map-making
improves the usability of
information and also complements what the brain can do
imperfectly. Both improve student
learning. Let us take each of these points in turn.
290 High Educ (2011) 62:279–301
123
Usability
Maps make new information more usable. Usable information
can be more easily pro-
cessed. This is why we draw maps in preference to providing
long and detailed verbal
directions. Usability has, of course, been a driving force for
improvements in other areas. A
fountain pen, and a ball-point pen, both aid in the skill of
writing; so does a word pro-
cessor. The word processor improves on earlier writing tools by
being more usable. A
beginner’s windsurfing board provides a more usable way of
improving windsurfing skills
(by being larger and more stable) than an ‘‘expert’’ board. The
58. traditional manner of
presenting and understanding information is, of course, in prose
(either spoken in a lecture
or written in textbooks). Mapping devices, it is claimed, are
now more usable than prose
and results in improvements in teaching and learning.
More usable information is better in improving skill
development than less usable
information. As noted by Hay et. al. the basic methodology of
university teaching has
remained unchanged for centuries, despite transformations in
other areas of the tertiary
sector in the past few decades. Learning simply by reading
textbooks, or listening to a
presentation (incorporating linear-structured Powerpoint slides)
is far more likely to result
in non-learning or rote learning (Hay et al. 2008). However, if
students are asked to study,
draw or manipulate a map of what they have learned, this may
yield improved learning
because it is more usable (the activity of making a map is also
important, as discussed
below). This is because maps aid in linking new information
with what they already know.
59. Complementation
Mapping augments the brain’s ability to understand, retrieve
and process information. It
does this by complementing what the human brain can already
do (albeit imperfectly). In
the cognitive science literature, this is known as
complementation. Our memory stores are
seriously limited—some suggest as limited as holding only four
pieces of information at a
Fig. 5 Different kinds of learning in an intervention involving
students using concept mapping under test
conditions (Hay et al. 2008, p. 299)
High Educ (2011) 62:279–301 291
123
time (Cowan 2000). Similarly, our ability to ‘‘chunk’’ complex
pieces of relevant infor-
mation and sift them from irrelevant information is limited.
Mapping allows this to be done
efficiently because diagrams are more easily stored in memory
than other kinds of rep-
resentational formats (Larkin and Simon 1987). Memonics also
assist this. In ‘‘The purpose
60. and justification for mapping tools’’, a reason was given for
this. Maps allow the separate
encoding of information in memory in visual and well as
propositional form.
Mapping allows students to build new and meaningful
knowledge
links by active engagement
The educational literature suggests that meaningful engagement
is a critical factor in
promoting deeper learning. When students are meaningfully
engaged, they form longer-
lasting knowledge representations in memory (Craik and
Lockhart 1972). The educational
focus recently has moved from what the student is, and how to
teach them (i.e., student-
centred learning), to what the teacher does and how to improve
it (i.e., teacher-centred
learning), to a focus now on what the student does (i.e., how
they engage in taught
material) (Biggs 1999). Increasingly, good teaching and
learning is focussed on how to use
engagement activities, such as problem-based learning, to teach,
in a way that will engage
students in learning and narrow the gap between more
academically self-engaged students
and those less inclined.
61. By contrast, Hay et al. note that conventional teaching formats
in the university envi-
ronment involve simple ‘‘narrative chains’’ delivered in a
‘‘linear’’ manner typically on
Powerpoint slides. This material is designed to be accessible to
students, but it conceals
deep and complex networks of tacit scholarly information. The
way information that is
taught to students was originally understood and constructed by
academics themselves is
rarely explained. Constrained by the time-scheduling required
in any given academic year,
well-intentioned teachers try to circumvent the process of
learning for their students. This
paradoxically usually results in less meaningful learning. It
results in ‘linearity rather than
connectivity out of which genuine understanding arises’ (Hay et
al. 2008, p. 306). It also
fosters a lack of engagement critical to the development of
meaningful understanding. To
meet assessment demands, students begin to rely on
memorisation techniques and cram-
ming, not meaningful activities to ensure engagement and
learning, and ultimately—via a
62. transformative learning cycle—expertise. This failure to allow
opportunities for engage-
ment leads naturally to non-learning or simple rote learning
(Fig. 6).
Hay et al. recommends that teachers take the time to construct
knowledge maps and
explain their understanding of any given topic. They are less
specific about the various
forms that this mapping might take. They are concerned in their
paper with the pro-
mulgation of concept maps as a teaching and learning tool.
However, as we have seen in
this paper, knowledge or information mapping is available in a
number of discrete forms.
All forms of mapping have their place in the context of teaching
and learning. Maps of
associations (mind maps), causes and effects/relationships
(concept maps) and maps of
reasoning (argument maps) should all be presented in lectures in
preference to linear
narrative chains. This enables teachers to show the often tacit
connections that exist
between related academic areas. This would have a secondary
benefit of allowing stu-
63. dents to check their own understanding. Requiring students to
devise maps of their
learning for assessment, and encouraging them to compare and
contrast those maps with
fellow students is an additional activity that can promote and
encourage meaningful
learning.
292 High Educ (2011) 62:279–301
123
A convergence of mapping tools?
This next section is somewhat speculative. This paper has
suggested that the various
mapping tools have complementary functions. Mind mapping is
an associational mapping
tool; concept mapping provides a way of mapping relationships;
argument mapping
focuses on maps of inferential structures and logical
connections. However, the technology
is already available to enable a convergence of these mapping
tools. All mapping tools
function to improve student learning in the ways just
mentioned. All of them require the
64. pedagogical advantages of map-making to supplement and drive
student learning. What is
needed is a way of combining these advantages in an
educational tool that provides more
flexibility and power than the separate tools that exist at
present. Work has already been
done on a complementary approach integrating conceptual
diagrams, mind maps, concept
maps and visual metaphors into an over-arching educational
strategy beginning with
conceptual diagrams, then mind maps, then concepts and finally
visual metaphors (Eppler
2006). However, this approach did not consider the considerable
advantages of argument
mapping, and treats the mapping tools separately. I am
envisaging a single mapping tool
that does the role of each of the mapping tools that exist at
present.
What would a convergent mapping tool look like? Work has
already been done on
linking concept mapping software to libraries of resources—
such as Global Services
Library Network (https://glsn.com/)—so that various ‘‘nodes’’
in a map might allow
65. downloading of supporting evidence that was used in making
the map (van der Laan and
Dean 2006). This has a number of advantages. Using this
functionality, students can
demonstrate their understanding of an assessment topic in
several independent ways: firstly
Fig. 6 The narrative sequence involves an expert [2] giving a
linear presentation [1]. Students may either
adopt meaningful learning [4] or memorisation [3] (from Hay et
al. 2008). Meaningful learning is possible
only if engagement with the material is allowed enabling the
construction of knowledge in meaningful
patterns drawing upon prior knowledge. This process can
continue indefinitely until expertise is attained
High Educ (2011) 62:279–301 293
123
https://glsn.com/)
they can demonstrate, at minimum, that they know, i.e., can list
key concepts (a form of
surface learning); second, that they understand the relationships
between key concepts (a
deeper form of learning requiring analytical skills); and thirdly,
they can provide links to
relevant external material (or material they have written
66. themselves) supporting nodes in
the map. This third form of learning requires considerable
research and analytical skills.
Each form of learning can, of course, be independently
assessed. They can provide an
indication to teaching staff of the level of competence of
students in a given subject area.
Work has also been done on providing argument maps as
assessment tasks for students in
preference to written assignments in subjects such as Economics
(Davies 2009a). Much
work has been done on all the knowledge-mapping tools in
isolation as outlined previously.
What has not been done is work on how the different tools can
be integrated.
If the various mapping tools can be integrated then a number of
opportunities arise. For
one thing, the disadvantages and limitations of the discrete tools
are no longer constraints.
An example will make this clear.
An excerpt from a concept map on an inventory for financial
accounting showing the
relationship between revenues and cash flows is provided in
Fig. 7. While incomplete, we
67. can see that as a concept map it meets the requirement of
providing relationships between
key concepts. However, in the map, there is little evidence that
a student understands the
argument for why revenue may be ‘‘paid in advance’’. Indeed,
the student may be able to
draw a concept map of this kind without understanding the
reasoning behind any of the
financial practices themselves. The required information may be
‘‘rote learned’’. We
cannot tell from the map provided whether surface or deep
learning has been achieved.
This knowledge may need to be assessed by other assessment
modalities such as essays or
exams, or tutorial participation.
Alternatively, students may be required to link argument maps
at strategic points in their
concept map to nodes in the map that require argumentative
justification. This would
demonstrate a greater level of understanding. The argument map
may lie behind the nodes
in the concept map and be accessible by hyperlinks. Lecturers
could assess both maps
simultaneously or separately.
68. This way of checking understanding might also proceed in
another direction. At a
greater level of generality, mind maps may also be used
providing evidence of a different
kind of learning. For example, at the top most level of the
concept map above, ‘‘Revenue’’
And may be
Revenue (sales)
defined as: Price of
goods and services
sold
Paid in
advance
Paid for at
time of sale –
Cash “CR”
Sales
Paid for
in the
future
And may be
And may
Fig. 7 A partial concept map on the relationship between
revenues and cash flows
294 High Educ (2011) 62:279–301
69. 123
is stated formally as a definition. However, it is not clear
whether the student has con-
sidered other associated features of the definition. The student
may have merely rote
learned or copied this definition from a lecturer’s Powerpoint
slide. Providing a link to a
mind map showing all the associated definitional features of
‘‘revenue’’ would ensure that
the student understood the concept well and was familiar with
its various facets and
associated concepts, and could demonstrate this familiarity in
an assessment task. A
schematic plan of how the comparative functions of each of the
tools might be integrated is
presented in Fig. 8.
A convergence of mapping tools might proceed in other ways.
As noted earlier
(‘‘Argument mapping’’), to assist students in writing
assignments, mapping tools also need
to help with the preparatory stages involved. Earlier, we looked
before at a sample essay
70. topic:
• The changing roles of men and women have been good for a
society. Discuss.
The point was made that mapping tools provide little assistance
with tasks such as these,
which require a clear understanding of task requirements. A
fully-converged mapping tool
should be able to assist students in developing this
understanding. If this understanding can
be sequenced as a series of manageable stages, this should be
able to be integrated into the
computational routines of a software package and form part of a
converged mapping
platform.
M IN D M AP
(High level of generality)
CO N CEPT M AP
(Medium level of generality)
ARG UM EN T
M AP
(low level of
generality — high
specificity)
71. D
ec
re
as
in
g
ge
ne
ra
li
ty
IF there is support
for AM then it
should be used as
a teaching and
learning tool
There is support for
AM
?
AM is already being
used successfully
in some disciplines
My Basis
AM improves
critical thinking
72. skills
Data
(Twardy, 2004; van
Gelder, Bissett,
Cumming,2004)
AM is being used in
other professions
with success
Publication
AM uses different
parts of the brain to
store information
Expert Opinion
(Vikiri, 2002)
?
AM allows
informtion to be
processed more
efficiently than text
Example
Argument mapping
(AM) should be
used as a teaching
and learning tool
Fig. 8 Proposed convergence of knowledge mapping
technologies into a single integrated platform. The
73. central concept map may be devised initially to demonstrate
familiarity with the relationship between key
concepts in a topic. At given points, or ‘‘nodes’’, certain
concepts may be further elaborated in terms of
associative structures (mind maps), and inferential or logical
arguments (argument maps). NB: Maps
provided are illustrative only
High Educ (2011) 62:279–301 295
123
Understanding how to approach an assignment or essay topic
typically involves a
number of steps (although the steps may not be formally
identified as such). These stages
have been discussed elsewhere in detail (Davies 2009b):
• The deconstruction phase. This involves being able to select
key noun phrases in a
given essay topic provided by a lecturer and being able to
define them (e.g., ‘‘roles’’,
‘‘good’’, ‘‘society’’). It also involves knowing the meaning of
the direction words
provided by the instructor (e.g., ‘‘Discuss’’, ‘‘Analyse’’,
‘‘Trace’’, ‘‘Compare’’, etc.).
• The representation phase. This involves being able map out
the main parts of the body
of the proposed essay, i.e., what topics will be discussed in each
part. This is quite
74. different from a mind map, concept map or an argument map. It
is equivalent to
‘‘brainstorming’’ the form or structure that the essay will take.
An essay plan, as
opposed to a knowledge map requires an overview of which
issues and arguments
should be presented, and the order of their presentation (i.e.,
from weak to strong or
vice versa). Typically, the essay structure that will be formed
will mirror the parts of
the assignment topic given by a lecturer, but thought will need
to be given to
arrangement of ideas within each section.
• The issues phase. This involves further clarity on the issues
relevant to each of the key
terms in an essay topic (e.g., what does it mean for changing
gender roles to be ‘‘good’’
for society?’’ In what sense?) This requires some idea of the
evidential support that is
needed in the essay. This part of the preparation would benefit
from concept mapping
and mind mapping.
• The research phase. This involves knowing where to find
academic support for the
75. points made in an essay (e.g., the construction of search
statements to be used in
databases).
• The argument phase. This involves being able construct a clear
argument drawn from
wide reading. Argument mapping may be used here.
• The writing phase. Written assessment at university level
takes the form of various
genres: essays, empirical reports, annotated bibliographies,
literature reviews, summa-
ries and critiques, case studies, and so on. Each genre involves
the ability to write—in
clear and flowing prose—the point or issue being defended. But
the style of writing and
the structural requirements are very different. There are, of
course, commonalities
among the genres. At postgraduate-level, for example, an
introduction typically
involves an ‘‘funnel’’ structure that moves from the general
topic, to the specific issue
under consideration, to the gap in the research (using embedded
citations as support), to
the thesis statement and then an outline of the essay to follow.
‘‘Methodology’’ and
‘‘Discussion’’ sections in report writing have unique and
76. predictable writing genres as
well. In general, good academic writing of all genres from the
‘‘general’’ to the
‘‘specific’’, and uses an arrangement of part-whole
relationships between major ideas
and support for those ideas (e.g., support from academic
literature).
An integrated mapping software should assist students in some
or all of these areas. This
might be possible in further developments of mapping tools.
Suggestions for how this
might happen are provided below:
• Assignment topics could be entered by students into an
integrated mapping software.
Key parameters of a topic, such as important concepts,
discipline-specific definitions of
terms, etc. could also be added by lecturers via a separate
interface accessed by means
of a common course or subject code.
296 High Educ (2011) 62:279–301
123
• Key noun phrases might be highlighted in the assignment topic
77. that automatically
trigger mind maps of associated key terms and synonyms.
Direction words might be
explained with an in-built glossary of academic terms which
could be tailored to
discipline areas.
• Templates for developing ‘‘block’’ and ‘‘chain’’ style essay
structures might be made
available. (A ‘‘block’’ essay presents all the points
‘‘for’’/‘‘advantages’’ or ‘‘against’’/
‘‘disadvantages’’ for a topic first, then all the points for the
opposing position; a
‘‘chain’’ essay presents one point, then a point against, then a
second point, second
point against, and so on).
• Issues for students to consider might be automatically
generated based upon clusters of
key terms entered and ranked by relevance.
• Search statements of key terms, e.g., (Man OR Male) AND
(Woman OR Female) AND
(Gender role OR Sex role) AND (Good OR Beneficial OR
Advantageous), etc., might
be automatically constructed from submitted material to be used
in databases. These
databases might also be linked to the software.
• Writing templates for different sections of assignments
78. (essays, empirical-style reports,
case-style reports, etc.) might be made available which are
suited to the needs of
students and which follows the accepted academic structure
commonly used in
universities. Attempts have been made to articulate design
taxonomies for graduate
student writing that use predictable structures of nested part-
whole relationships
between ideas and support for ideas using commonly-used
linking phrases (Roche-
couste 2005). These taxonomies could be incorporated into a
converged mapping tool.
An example of this is provided in Fig. 9:
Beyond defining key topic and task words and constructing
writing templates, students
might also be assisted by an integrated mapping tool in turning
essay statements into
questions. Questions are always easier for students to begin
addressing than statements. For
example, the example provided previously can be more easily
approached if the topic is
transformed into: Have the changing roles of men and women
been good for society? A
student can then be directed to a template with the following
terms listed: ‘‘YES’’ (the
79. changing roles have been good), ‘‘YES but’’ (the changing roles
have generally been good
with minor exceptions to this view), ‘‘yes BUT’’ (the changing
roles have generally been
good, however, there are major exceptions to this view), and
‘‘NO’’ (the changing roles have
not been good) (for an elaboration of this technique, see Davies
2009b). This might translate
into an argument map proforma which could then be modified
and made more detailed.
This paper has been somewhat speculative in terms of the
directions in which a con-
verged mapping tool might take us in the future. Ideas for
improvements are easy to state.
Implementation is, of course, much harder. However, at present,
none of the mapping tools
discussed in this paper help students with the remedial
requirements that are often needed.
Perhaps an integrated knowledge mapping tool could do more in
future to help students
recognise the writing process and the conventions of the essay
genre and the logic behind
these conventions.
Conclusion
80. This paper has argued that there are sound reasons to consider
knowledge-mapping in its
various forms as a supplement to other teaching and learning
activities. The paper has
outlined the differences between the main forms of map-
making: mind maps, concept maps
High Educ (2011) 62:279–301 297
123
and argument maps, and has provided an educational
justification for their use. The paper
claims that the choice of a given mapping tool largely depends
of the purpose or aim to
which the tool is used. However, the paper also suggests that
these tools may well be
converging to offer educators as yet unrealised and potentially
complementary functions.
While the idea of using knowledge maps is decades old, it is
only in the early twenty-first
century that this kind of map-making has come of age. This
development provides new
teaching and learning tools for both students and teachers that
will enrich and provide new
81. directions in education in the future.
Acknowledgments My thanks to Tim Beaumont and two
anonymous reviewers from the journal for
useful comments on earlier versions of this paper.
References
Ahlberg, M. (1993). Concept maps, vee diagrams, and
Rhetorical Argumentation (RA) analysis: Three
educational theory-based tools to facilitate meaningful learning.
Paper presented at the Third Inter-
national Seminar on Misconceptions in Science and
Mathematics, Cornell University. Available from.
A more theoretical approach has been taken by several research
teams and this has r
in…..
Factors af f ecti ng…(T O PI C ) . hav e been studied by N ev
ille (1993), D av idson
et al (1997) and Brady & H ill (1999).
Similarly, Ferguson’s (2001) research, using a ….
perspective, suggests that ….
Neville’s study focused on …..
Brady & Hill, on the other hand, were able to demonstrate
that….
The findings of Brady & Hill support earlier research by
Davidson
et al (1997).
Davidson et al found that ….
82. For example, Hudson et al (2001) applied the ……
theory to … and demonstrated that …
Numerous studies have focused on …(SUB-TOPIC).. Several of
these reported
that …(FINDINGS)., while others have addressed the issue from
the point of view
of…(THEORETICAL STANCE).
Research in this area, therefore, provides some conflicting
results. Firstly, it has
been shown that…. More recent research, however, ….
Fig. 9 A template for a writing taxonomy (Rochecouste 2005)
298 High Educ (2011) 62:279–301
123
Ahlberg, M. (2004). Varieties of concept mapping. Paper
presented at the First International Conference on
Concept Mapping, Pamplona, Spain. Available from.
Amundsen, C., Weston, C., & McAlpine, L. (2008). Concept
mapping to support university academics’
analysis of course content. Studies in Higher Education, 33(6),
633–652.
Ausubel, D. P. (1963). The psychology of meaningful verbal
learning. New York: Grune and Stratton.
Baugh, N. G., & Mellott, K. G. (1998). Clinical concept
mapping as preparation for student nurses’ clinical
83. experiences. Journal of Nursing Education, 37(6), 253–256.
Beitz, J. M. (1998). Concept mapping: Navigating the learning
process. Nurse Educator, 23(5), 35–41.
Biggs, J. (1987). Student approaches to learning and studying.
Hawthorn, Vic: Australian Council for
Educational Research (ACER).
Biggs, J. (1999). What the student does: Teaching for enhanced
learning. Higher Education Research and
Development, 18(1), 57–75.
Biktimirov, E. N., & Nilson, L. B. (2003). Mapping your
course: Designing a graphic syllabus for intro-
ductory FINANCE. Journal of Education for Business,
78(July//August), 308–312.
Biktimirov, E. N., & Nilson, L. B. (2006). Show Them the
money: Using mind mapping in the introductory
finance course. Journal of Financial Education, 32(Fall), 72–86.
Buzan, T. (1974). Using both sides of your brain. New York: E.
P. Dutton.
Buzan, T., & Buzan, B. (2000). The mind map book. London:
BBC Books.
Cañas, A. J., Hill, G., Carff, R., Suri, N., Lott, J., & Eskridge,
T. (2004). CMap tools: A knowledge
modellign and sharing environment. In A. J. Cañas, J. D.
Novak, & F. M. Gonzalez (Eds.), Concept
maps theory, methodology, technology: First international
conference on concept mapping (Vol. 1,
pp. 125–133). Pamplona, Spain: Universidad Publica de
Navarra.
Chei-Chang, C. (2008). The effect of concept mapping on
students’ learning achievements and interests.
84. Innovations in Education and Teaching International, 45(4),
375–387.
Concept Map. (2010). Retrieved 8/3/2010, Wikipedia, from
http://en.wikipedia.org/w/index.php?title=
Concept_map&oldid=139167845.
Cowan, N. (2000). The magical number four in short-term
memory: A reconsideration of mental storage
capacity. Behavioral and Brain Sciences, 24, 87–185.
Craik, F. I. M., & Lockhart, R. S. (1972). Levels of processing:
A framework for memory research. Journal
of Verbal Learning and Verbal Behaviour, 11, 671–684.
Daley, B. J. (2004). Using concept maps in qualitative research.
Paper presented at the First International
Conference on Concept Mapping, Pamploma, Spain. Available
from http://cmc.ihmc.us/papers/
cmc2004-060.pdf.
Davies, W. M. (2009a). Computer-assisted argument mapping:
A rationale approach. Higher Education,
58(6), 799–820.
Davies, W. M. (2009b). Not quite right: Teaching students how
to make better arguments. Teaching in
Higher Education, 13(3), 327–340.
Edmonson, K. M. (1993, April 12-16). Concept mapping for the
development of medical curricula. Paper
presented at the Annual Meeting of the American Educational
Research Association, Atlanta, Georgia.
Available from.
Entwistle, N. (1981). Styles of learning and teaching; an
85. integrated outline of educational psychology for
students, teachers and lecturers. Chichester: John Wiley.
Eppler, M. J. (2006). A comparison between concept maps,
mind maps, conceptual diagrams, and visual
metaphors as complementary tools for knowledge construction
and sharing. Information Visualization,
5, 202–210.
Eriksson, L. T., & Hauer, A. M. (2004). Mind map marketing: A
creative approach in developing marketing
skills. Journal of Marketing Education, 26(2), 174–187.
Farrand, P., Hussain, F., & Hennessy, E. (2002a). The efficacy
of ‘‘mind map’’ study technique. Medical
Education, 36(May), 426–431.
Farrand, P., Hussain, F., & Hennessy, E. (2002b). The efficacy
of the ‘mind map’ study technique. Medical
Education, 36(5), 426–431.
Gouveia, V., & Valadares, J. (2004). Concept maps and the
didactic role of assessment. Paper presented at
the First International Conference on Concept Mapping.
Harrell, M. (2008). iLogos. Retrieved 7/11/08, from
http://www.phil.cmu.edu/projects/argument_mapping/.
Harrell, M. (2011). Argument diagramming and critical thinking
in introductory philosophy. Higher Edu-
cation Research and Development, forthcoming.
Hay, D., Kinchin, I., & Lygo-Baker, S. (2008). Making learning
visible: The role of concept mapping in
higher education. Studies in Higher Education, 33(3), 295–311.
Hay, D., Wells, H., & Kinchin, I. (Forthcoming). Using concept
86. maps to measure learning quality. Higher
Education.
High Educ (2011) 62:279–301 299
123
http://en.wikipedia.org/w/index.php?title=Concept_map&oldid=
139167845
http://en.wikipedia.org/w/index.php?title=Concept_map&oldid=
139167845
http://cmc.ihmc.us/papers/cmc2004-060.pdf
http://cmc.ihmc.us/papers/cmc2004-060.pdf
http://www.phil.cmu.edu/projects/argument_mapping/
Hoffman, E., Trott, J., & Neely, K. P. (2002). Concept mapping:
A tool to bridge the disciplinary divide.
Amercian Journal of Obstetrics and Gynecology,
187(September), S41–S43.
Horn, R. E. (1998). Mapping great debates: Can computers
think? bainbridge island. WA: MacroVU Press.
Irvine, H., Cooper, K., & Jones, G. (2005, 24
th
–25th November). Concept mapping to enhance student
learning in a financial accounting subject. Paper presented at
the Accounting Educators’ Forum,
Sydney, NSW. Available from.
Jackson, K., & Trochim, W. (2002). Concept mapping as an
alternative approach for the analysis of open-
ended survey responses. Organizational Research Methods,
87. 5(4), 307–336.
Jarvis, P. (1992). Paradoxes of learning. San Francisco: Jossey-
Bass.
Jonassen, D. H., Reeves, T. C., Hong, N., Harvey, D., & Peters,
K. (1997). Concept mapping as cognitive
learning and assessment tools. Journal of Interactive Learning
Research, 8(3–4), 289–308.
Kinchin, I. M. (2000). Concept mapping in biology. Journal of
Biological Education, 34(2), 61–68.
Kinchin, I. (2001). If concept mapping is so helpful to learning
biology why aren’t we all doing it?
International Journal of Science Education, 12, 1257–1269.
King, M., & Shell, R. (2002). Teaching and evaluating critical
thinking with concept maps. Nurse Educator,
27(5), 214–216.
Kolb, D., & Fry, R. (1975). Towards an applied theory of
experiential learning. In C. L. Cooper (Ed.),
Theories of group processes. London: Wiley and Sons.
Kulhavy, R. W., Lee, J. B., & Caterino, L. C. (1985). Conjoint
retention of maps and related discourse.
Contemporary Educational Psychology, 10, 683–699.
Larkin, J. H., & Simon, H. A. (1987). Why a diagram is
(sometimes) worth ten thousand words. Cognitive
Science, 11(1), 65–100.
Leauby, B. A., & Brazina, P. (1998). Concept mapping:
Potential uses in accounting education. Journal of
Accounting Education, 16(1), 123–138.
List of Concept Mapping Software. (2008). Retrieved 30th
88. November, from http://en.wikipedia.org/w/
index.php?title=List_of_concept_mapping_software&oldid=139
133393.
List of Mind Mapping Software. (2008). Retrieved 29 October,
from http://en.wikipedia.org/w/index.php?
title=List_of_mind_mapping_software&oldid=139428677.
Maas, J., & Leauby, B. A. (2005). Concept mapping: Exploring
its value as a meaningful learning tool in
accounting education. Global Perspectives of Accounting
Education, 2, 75–98.
Markham, K. M., Mintzes, J. J., & Jones, M. G. (1994). The
concept map as a research and evaluation tool:
Further evidence of validity. Journal of Research in Science
Teaching, 31(1), 91–101.
Marton, F., & Saljo, R. (1976a). On qualitative differences in
learning, i-outcome and process. British
Journal of Educational Psychology, 46, 4–11.
Marton, F., & Saljo, R. (1976b). On qualitative differences in
learning, ii-outcome as a function of the
learner’s conception of the task. British Journal of Educational
Psychology, 46, 115–127.
Mayer, R. E., & Gallini, J. K. (1990). When is an illustration
worth ten thousand words?. Journal of
Educational Psychology, 82(December), 715–726.
McClain, A. (1987). Improving lectures: Challenging both sides
of the brain. Journal of Optometric Edu-
cation, 13(Summer), 18–12.
McGaghie, W. C., McCrimmon, D. R., Mitchell, G., Thompson,
89. J. A., & Ravitch, M. (2000). Quantitative
concept mapping in pulmonary physiology: Comparison of
student and faculty knowledge structures.
Advances in Physiology Education, 23(1), 72–81.
Mealy, D. L., & Nist, S. L. (1989). Postsecondary teacher
directed comprehension strategies. Journal of
Reading, 32(6), 484–493.
Mento, A., Martinelli, P., & Jones, R. M. (1999). Mind mapping
in executive education: Applications and
outcomes. Journal of Management Development, 18(4), 390–
407.
Mind Maps Made With Mind Mapping Tool. 8/3/2010, from
http://www.mindmapexample.com/
samples.php.
Nassi, I., & Shneiderman, B. (1973). Flowchart techniques for
structured programming. SIGPLAN Notices,
8(8).
Nettleship, J. (1992). Active learning in economics: Mind maps
and wall charts. Economics, 28(Summer),
69–71.
Novak, J. D. (1981). Applying learning psychology and
philosophy to biology teaching. The American
Biology Teacher, 43(1), 12/20.
Novak, J. D., & Cañas, A. J. (2006). The theory underlying
concept maps and how to construct them.
Technical Report IHMC Cmap Tools 2006-01 Retrieved
21/6/07, Florida Institute for Human and
Machine Cognition, from
90. http://cmap.ihmcus/Publications/ResearchPapers/TheoryUnderly
ingConcept
Maps.pdf.
Novak, J. D., & Gowin, D. (1984). Learning how to learn. New
York: Cornell University Press.
300 High Educ (2011) 62:279–301
123
http://en.wikipedia.org/w/index.php?title=List_of_concept_map
ping_software&oldid=139133393
http://en.wikipedia.org/w/index.php?title=List_of_concept_map
ping_software&oldid=139133393
http://en.wikipedia.org/w/index.php?title=List_of_mind_mappin
g_software&oldid=139428677
http://en.wikipedia.org/w/index.php?title=List_of_mind_mappin
g_software&oldid=139428677
http://www.mindmapexample.com/samples.php
http://www.mindmapexample.com/samples.php
http://cmap.ihmcus/Publications/ResearchPapers/TheoryUnderly
ingConceptMaps.pdf
http://cmap.ihmcus/Publications/ResearchPapers/TheoryUnderly
ingConceptMaps.pdf
Paivio, A. (1971). Imagery and verbal processes. New York:
Holt, Reinhart and Winston.
Paivio, A. (1983). The empirical case for dual coding. In J.
Yuille (Ed.), Imagery, memory and cognition.
Hillsdale, N. J.: Lawrence Erlbaum.
Pressley, M., Van Etten, S., Yokoi, L., Freebern, G., &
VanMeter, P. (1998). The metacognition of college
91. studentship: A grounded theory approach. In J. D. D. J. Hacker
& A. C. Graesser (Eds.), Metacognition
in theory and practice (pp. 347–367). Mahwah, NJ: Erlbaum.
Ramsden, P. (1992). Learning to teach in higher education.
London: Routledge.
Rochecouste, J. (2005). Constructing taxonomies for student
writing. Paper presented at the European
Association for the Teaching of Academic Writing. from
http://eataw2005.hau.gr/pages/about.htm.
Ruiz-Primo, M. A., & Shavelson, R. (1996). Problems and
issues in the use of concept maps in science
assessment. Journal of Research in Science Teaching, 33(6),
569–600.
Safayeni, F., Derbentseva, N., & Canas, A. J. (2005). A
theoretical note on concepts and the need for cyclic
concept maps. Journal of Research in Science Teaching, 42(7),
741–766.
Schau, C., & Mattern, N. (1997). Use of map Techniques in
teaching applied statistics courses. The
American Statistician, 51(May), 171–175.
Schuster, P. M. (2000). Concept mapping: Reducing clinical
care plan paperwork and increasing learning.
Nurse Educator, 25(2), 76–81.
Schwartz, N. H. (1988). Cognitive processing characteristics of
maps: Implications for instruction. Edu-
cational and Psychological Research, 8, 93–101.
Simon, J. (2007). concept mapping in a financial accounting
theory course. Accounting Education, 16(3),
92. 272–308.
Slotte, V., & Lonka, K. (1999). spontaneous concept maps
aiding the understanding of scientific concepts.
International Journal of Science Education, 21(5), 515–531.
Software for Mind mapping and Information Storage. (2008).
Retrieved 30th October, from
http://www.mind-mapping.org/.
Trochim, W. (1989). An introduction to concept mapping for
planning and evaluation. Evaluation and
Program Planning, 12, 1–16.
Tufte, E. R. (1983). The visual display of quantitative
information (2nd ed. ed.). Cheshire, CT: Graphics
Press.
Twardy, C. (2004). Argument maps improve critical thinking.
Teaching Philosophy, 27(2), 95–116.
van der Laan, S., & Dean, G. (2006). Assessment to Encourage
Meaningful Learning in Groups: Concept
Mapping,. NZ: AAFANZ SIG Wellington.
van Gelder, T. (2001). How to improve critical thinking using
educational technology. Paper presented at the
Meeting at the Crossroads: Proceedings of the 18th Annual
Conference of the Australasian Society for
Computers in Learning in Tertiary Education, University of
Melbourne. Available from.
van Gelder, T. (2007). The rationale for Rationale
TM
. Law, Probability and Risk, 6, 23–42.
van Gelder, T., Bissett, M., & Cumming, G. (2004). Enhancing
93. expertise in informal reasoning. Canadian
Journal of Experimental Psychology, 58, 142–152.
Vekiri, I. (2002). What is the value of graphical displays in
learning? Educational Psychology Review,
14(3), 261–312.
Walker, J., & King, P. (2002). Concept mapping as a form of
student assessment and instruction. Paper
presented at the 2002 American Society for Engineering
Education Annual Conference and Exposition.
Available from.
West, D. C., Pomeroy, J. R., & Park, J. K. (2000). Critical
thinking in graduate medical education: A role for
concept mapping assessment. The Journal of the American
Medical Association, 284(9), 1105–1110.
Wilkes, L., Cooper, K., Lewin, J., & Batts, J. (1999). Concept
mapping: Promoting science learning in bn
learners in Australia. The Journal of Continuing Education in
Nursing, 30(1), 37–44.
Winn, W. (1991). Learning from maps and diagrams.
Educational Psychology Review, 3(3), 211–247.
Zeilik, M. (nd). Classroom assessment techniques: Concept
mapping. Retrieved 8/3/2010, from http://
www.flaguide.org/cat/conmap/conmap1.php.
High Educ (2011) 62:279–301 301
123
http://eataw2005.hau.gr/pages/about.htm
94. http://www.mind-mapping.org/
http://www.flaguide.org/cat/conmap/conmap1.php
http://www.flaguide.org/cat/conmap/conmap1.php
Copyright of Higher Education is the property of Springer
Science & Business Media B.V. and its content may
not be copied or emailed to multiple sites or posted to a listserv
without the copyright holder's express written
permission. However, users may print, download, or email
articles for individual use.
Copyright 2011 by the RESEARCH IN
THE SCHOOLS
Mid-South Educational Research Association
2011, Vol. 18, No. 1, 62-70
Spring 2011 62
RESEARCH IN THE SCHOOLS
Use of Bibliographic Systems and Concept Maps:
Innovative Tools to Complete a Literature Review
Maira L. Martelo
95. University of North Florida
Writing a literature review is probably one of the
most challenging aspects of being a doctoral student.
It is not only a matter of selecting a topic of interest,
but it is also a particularly challenging exercise in
regard to getting all the information organized,
classified, and accessible when the literature reviewer
needs it most. Particular attention to details is
important for a literature reviewer accurately to cite a
particular researcher’s work and also to find her/his
own voice in the process. As a doctoral student, the
literature reviewer needs to find his or her own voice
to be able to contribute some perspective to the
existing conversations in the academic world.
According to Graff and Birkenstein (2006), it is very
challenging to engage students in this type of
96. academic discussion, particularly when they are
required to make their own claims and to add
something of value to the conversation. In my
academic experience in Colombia, Mexico, and now
in the United States, I have recognized that perhaps
the greatest challenge for students is not only to be
able to convey what others have previously stated,
which, in most of the cases, becomes a summary of
the existing literature, but also to be able to find their
own voices in the conversation.
According to Boote and Beile (2005), a high-
quality dissertation, and more specifically, a good
literature review, requires not only reporting results
from previous research but also a critical review of
the methodology. By critically reviewing the methods
used by previous researchers, the reviewer will be
able to synthesize information, offering a new
perspective to the existing conversation
97. (Onwuegbuzie, Collins, Leech, Dellinger, & Jiao,
2010). After the researcher has decided upon a
dissertation topic and read the required articles,
books, and other references, the question is how to
organize all the references so that they can be used
when appropriate. Even more so, the question is how
to find a particular reference that the reviewer recalls
reading when he/she does not remember the location
or the name of that author. Let us now suppose that
the reviewer has a way of tracking all the materials
that her/she has read for the literature review. The
question that remains is how to create a conversation
among authors who actually might not be discussing
a topic in real life. In other words, it is possible that
the reviewer has all the key authors for a particular
topic, and that in the write-up, he/she is able to
provide the different perspectives about a contested
topic. However, determining how to create new
98. relationships within the existing perspectives is
probably the most common challenge for many
doctoral students. Unfortunately, the majority of
doctoral students receive little training “in how to
analyze and synthesize the research literature in their
This article presents a process for utilizing a bibliographic
system built with Microsoft Excel as well as concept
maps to organize and to synthesize information that can be
included in a literature review. A review of the
conceptual framework behind these tools is included as well as
a detailed description about how to build the
system in Excel. Also discussed in this article is the importance
of the literature review as a dynamic component
of any scholarly work. Doctoral students usually face the
challenge of writing a literature review, lacking the
necessary skills to search, to organize, to analyze, and to
synthesize information. Some ideas about how to build
relationships among existing scholars’ work on a particular
topic and ideas for generating new knowledge also
are discussed.
Correspondence should be addressed to Maira L.
99. Martelo, Doctoral Candidate, Educational
Leadership, University of North Florida,
Jacksonville, FL, 32224
Email: [email protected]
MAIRA L. MARTELO
Spring 2011 63
RESEARCH IN THE SCHOOLS
field” (Boote & Beile , 2005, p. 5). The poor quality
of literature reviews is not a unique problem for only
doctoral students, but for scholars in general.
Onwuegbuzie and Daniel (2005) found that 40% of
the manuscripts submitted for a research journal had
inadequate literature reviews, and these manuscripts
were more than six times more likely than were
manuscripts containing adequate literature reviews to
be rejected for publication. The poor quality of
literature reviews has been discussed by several
100. authors over the years (Boote & Beile, 2005; Fink,
2009; Hart, 2005). Recently, Onwuegbuzie et al.
(2010) have outlined a model for a rigorous literature
review that offers a clear guide about how to select,
to analyze, and to synthesize qualitative and
quantitative sources.
Organizing the Information
Writing a literature review requires enormous
amounts of time and effort that challenge even the
organization of daily life. It is not only about reading
the materials; it is more about classifying, analyzing,
and synthesizing great amounts of information, and
making sense of it before the writing process begins
(Machi & McEvoy, 2009; Onwuegbuzie et al., 2010).
Even though the topic of literature reviews seems to
be popular among scholars, there are scant published
works in this area offering methodological guidance
101. about how to conduct literature reviews
(Onwuegbuzie et al., 2010).
Several authors have reported that students, most
of the time, only have acquired pieces of information
about a particular field in a disorganized fashion.
Boote and Beile (2005) remarked that doctoral
students lack the bibliographic skills properly to
locate and to analyze the existing literature on a
particular topic. Also, they surmised that not all
educational doctoral programs have high-quality
standards for writing a literature review. This is
clearly exemplified by the inaccurate understanding
of the literature review as a summary of existing
knowledge or research about a particular topic; an
idea that is very commonly shared among doctoral
students (Hart, 2005; Onwuegbuzie, Leech, &
Collins, 2011). Further, Combs, Bustamante and
Onwuegbuzie (2010) documented the need for
102. doctoral students to find effective strategies to
“organize, catalog, and abstract the large amounts of
information gleaned from their searches” (p.172)
It is important to mention that by selecting books
and articles related to a particular topic, the writer of
the literature review is presenting a personal
interpretation in the sense that there has been a
selective process, which gives a certain ownership to
the writer (Dellinger, 2005; Onwuegbuzie et al.,
2010). However, it is not enough for the reviewer
simply to contribute to the existing conversation.
There is a clear and urgent need for doctoral students,
or any person aspiring for an academic career, to
develop advanced skills in searching bibliography,
but even more importantly, to develop ways of
collecting and classifying information in a
meaningful way (Boote & Beile, 2005; González,
Amozurrutia & Maass, 2006), so that they advance
103. the academic discussion with their own voices.
The process of finding and capturing information
about a particular topic can be messy, and that is why
having a central and unique control document is
highly recommended as a good strategy for
organizing, categorizing, and analyzing the
information available (Fink, 2009; González et al.,
2006; Machi & McEvoy, 2009; Onwuegbuzie et al.,
2010). Nowadays, there are several software
packages that allow the reviewer to do this; however,
Excel from Microsoft offers a great option without
the need to pay for an extra package.
Bibliographic System in Excel
Before sharing the particular details about the
bibliographic system in Excel, I would like to discuss
the knowledge behind it. I first want to give credit to
the researchers at the Complex Communication
104. Laboratory (LABCOMPLEX) at the Universidad
Nacional Autonoma de Mexico (UNAM), one of the
most prestigious universities in Latin America, from
whom I learned how to use this tool, and who are
leaders in the field of complex thinking and
cyberculture. LABCOMPLEX is seeking to promote
a cyberculture that is built upon three important
social processes or systems: information,
communication, and research—all of them in the
context of interdisciplinary work. Even though all
these systems are equally important, information is
the foundation of them all; through information we
build new human ecologies from which the number
of relationships is endless.
González et al. (2006) proposed the idea of
emergent communities in which knowledge is
socially constructed and shared; these ideas are all
based on the systemic paradigm in which all elements
105. are equally important and interdependent. With
information systems, it is possible to build
communication and cultural systems that will allow
the advancement of knowledge in any field. With a
cyberculture, according to these authors, it is possible
to adopt new perspectives and new dynamics of
interaction among researchers (González et al.,
2006). In short, the idea of building information
systems in Microsoft Excel is the first to take
advantage of existing software for a different use
from the functions for which it was originally
designed. For the purpose of writing literature
USE OF BIBLIOGRAPHIC SYSTEMS AND CONCEPT MAPS:
INNOVATIVE TOOLS TO COMPLETE A LITERATURE
REVIEW
Spring 2011 64
RESEARCH IN THE SCHOOLS
106. reviews, I have built my bibliographic system in
Excel since I started the doctoral program in
Educational Leadership at the University of North
Florida. I mention this because, as will be seen later
in this paper, building the system requires a lot of
time and effort at the beginning of the process, which
later is beneficial. I need to clarify that my
bibliographic system is a simplified version of the
original one proposed by the researchers at
LABCOMPLEX in Mexico, but one that still
encompasses its central idea.
The bibliographic system in Excel consists of six
columns as follows: (a) Authors, (b) Bibliography
using an appropriate style guide (e.g. American
Psychological Association (APA) style, Chicago
Manual of Style), (c) Type of document, (d)
Quotation-including page numbers, (e) Categories,
and (f) Comments (see Figure 1). The reason behind
107. having a column only for authors’ names is that when
filters are used in Excel, there is a limit in the number
of characters that can be used for the filters to
function. In the Bibliography column, I include the
full reference of the particular material in APA style
so that I do not have to invest additional time citing
the references correctly. Type of document is a
useful column that allows the reviewer to indicate if
the document is a journal article or a chapter of a
book. In the Quotation column, I include direct
quotations from all documents I read, including the
page number(s) from which it is extracted. The
reason to include direct quotations is not to use it as it
is when writing the literature review (because this
would lead to plagiarism), but to be able to
paraphrase a particular author’s words with the
required precision. Probably the most important part
of the bibliographic system is the Categories column.
108. The categories are key words associated with a
particular reference that will assist in classifying the
information included in the system. This is when
knowledge about the topic comes into play because
assigning categories requires a building and creative
process to structure a particular field in a way that
might be nonexistent. In other words, when using
categories to classify information from journal
articles, as well as from books or electronic
documents, the designer of the system is building her
or his own voice. This is an iterative process due the
fact that the chances of redefining the categories
become higher as a person reads more about a
particular topic (Dellinger, 2005; Onwuegbuzie et al.,
2010). The process of creating categories is similar
to coding and sorting qualitative and quantitative
information suggested by Frels and Onwuegbuzie
(2010) as an appropriate approach to conducting a
109. comprehensive literature review. I will revisit this
component of the system later on when addressing
the use of concept mapping. Finally, the section for
comments is for writing notes to oneself about a
particular reference for later use or even to indicate
sections or references that one can use when writing
the literature review.
My dissertation topic is in the area of early
literacy practices among Hispanic children. When
building my system, some of the categories I used
were parental involvement, multicultural
perspectives, literacy practices, and socioeconomic
status, only to cite some topics that are shared among
researchers in this field. The category called country
of origin is not widely mentioned in the existing
literature about my topic, but there are some authors
who have suggested that this could be an important
factor in determining the type of literacy practices at
110. home among Hispanic families. By choosing to
create this category, I am building my own voice to
contribute to the existing discussion.
Advantages and Disadvantages of the
Bibliographic System
Building the bibliographic system is time
consuming, but that is part of the nature of writing a
literature review or any other academic endeavor. In
some cases, particularly where information is coming
from books or from non-searchable PDF files, the
person building the system might have to type the
particular quotation needed for the system word by
word. However, nowadays, there is existing software
that allows one to scan documents and later convert
them into Word documents (e.g.,
http://www.pdftodocconverterpro.com/). In the case
of journal articles, the html version usually is
111. available, so one can copy and paste easily directly
into the system, avoiding the pitfalls of typing that
could lead to typographical errors, among other
problems (Fink, 2009). Before building the system, it
is recommended that the person working on this
project reads and highlights the relevant information
in articles and books that will be later included into
the system. Even though this could be seen as time
consuming, it gives the reader the opportunity better
to incorporate information because, later, at the point
of building the system, the person will have read the
same information at least twice, providing ample
opportunity to analyze materials and to establish
relationships among them. The process of reading
and classifying information with categories also is
known as constant comparison analysis, a technique
suggested by Combs et al. (2010) to cluster
information in groups, helping the establishment of
112. relationships among theories, and later during the
write-up of the literature review.
The main advantage of having a bibliographic
system comes from assigning categories and using
the filter tool. Filters are tools used to hide or to show
MAIRA L. MARTELO
Spring 2011 65
RESEARCH IN THE SCHOOLS
particular information in a spreadsheet. When the
reviewer has finished the inclusion of all the
references with their correspondent categories, he/she
should select the whole spread sheet and, under the
Home menu, select Filter (see Figure 2). By doing so,
the reviewer will create a scroll down menu for each
of the columns included in the system: Authors,
Bibliography, Type of document, Quotation,
Categories, and Comments. Most of the time, the
113. reviewer will filter by categories and by authors. The
bibliographic system captures precise ideas from
different authors in a way that makes it easier to give
the appropriate credit. Giving appropriate credit to
the authors of a particular concept is essential in the
scholarly world, as a way of showing respect for the
work of others (APA, 2010). By creating a new
connection among authors working on a particular
research topic, the user of the bibliographic system is
promoting a cyberculture because new relationships
are generated that were nonexistent in the real world
(González et al., 2006; Hart, 2005). Moreover, the
ability to connect previous research gives the
opportunity for doctoral students to contribute to the
generativity required and expected from scholars
(Boote & Beile, 2005). It also promotes higher
cognitive levels instead of just the repetition of what
has been stated by others (Combs et al., 2010). This
114. is when the reviewer’s own voice comes into the
process due to the fact that the reviewer, as the owner
of the system, is building a second-level order of
relationships by putting together perspectives of the
world that were not necessarily in place (González et
al., 2006). If we share our bibliographic systems with
other people interested in the same topic, we can
enrich our perspectives on education or any other
field because each observer who interacts with the
system will see different aspects of it. The
bibliographic system in Excel allows us to structure a
specific reality in a particular way and, in doing so,
the system itself will structure new ways of thinking.
Figure 1. Screenshot showing the Bibliographic System in
Excel.
115. USE OF BIBLIOGRAPHIC SYSTEMS AND CONCEPT MAPS:
INNOVATIVE TOOLS TO COMPLETE A LITERATURE
REVIEW
Spring 2011 66
RESEARCH IN THE SCHOOLS
Figure 2. Screenshot showing how to use Filters.
The Use of Concept Maps
When I already had included approximately 300
references in the bibliographic system, I found new
information about my topic that had been recently
published. After reading the new material, I faced the
challenge of presenting what I had learned from the
literature to some members of my committee, and
because I did not have sufficient time to include all
those references in my bibliographic system in Excel,
I decided to create a concept map. I used a free
software program called Cmaps Tools (Novak &
116. Cañas, 2008), created by the Florida Institute for
Human and Machine Cognition (IHMC) under the
leadership of Joseph Novak and Alberto Cañas.
According to Novak and Cañas (2008), concept maps
are powerful tools not only for organizing and
structuring knowledge, but also for promoting
meaningful learning. By structuring knowledge in
concept maps, it is easier to identify and to build new
knowledge and new meanings. A concept map
promotes creativity because the person building it is
creating meaningful relationships, knowledge that
can later be incorporated into the existing schema of
the designer, which makes learning easier (Eggen &
Kauchak, 2010; Hart, 2005). When undertaken in an
appropriate way, concept maps can promote “high
levels of cognitive performance” (Novak & Cañas,
2010, p. 13). Concept maps also are useful for
capturing and archiving large volumes of knowledge
117. or information (Novak & Cañas, 2010).
MAIRA L. MARTELO
Spring 2011 67
RESEARCH IN THE SCHOOLS
Cmpas tools is a great software program for
building maps easily because it allows the user to link
various types of files into a particular concept (e.g.,
text, presentations, maps, tables, images, and
websites), which makes it richer in the sense that
people can create knowledge models about a
particular topic without being limited to a single map
(Novak & Cañas, 2008). The other interesting aspect
of using this software programs is that it allows the
reviewer to archive the concept maps on the Internet
so that others around the world can see a map and
contribute to it. Also, the reviewer can have access to
it from any location. This idea is consistent with the
118. one promoted by people at the LABCOMPLEX in
the sense that they both pursue creating knowledge-
emergent communities in which knowledge is
socially constructed (González et al., 2006)
I built my concept map about the topic of early
literacy based on a focused question (see Figure 3),
as suggested by Novak and Cañas (2008). According
to these authors, a good concept map is one that is
built around a particular question because it provides
a clear context for what it is included in the map. In
other words, concept maps that do not answer a
particular question tend to be too broad, which goes
against the idea of establishing meaningful
relationships among related elements. The process of
building a concept map around a focus question is
iterative because the question guides the search for
information, and the extracted information reshapes
the question constantly or creates new questions
119. (Novak & Cañas, 2010).
Figure 3. Concept map about early literacy.
USE OF BIBLIOGRAPHIC SYSTEMS AND CONCEPT MAPS:
INNOVATIVE TOOLS TO COMPLETE A LITERATURE
REVIEW
Spring 2011 68
RESEARCH IN THE SCHOOLS
Integrating the Tools
120. When I used the two tools together, the
bibliographic system and the concept map about early
literacy, I was faced with the challenge of how to
integrate the information contained in both tools.
This is when I discovered that the words used in the
concept map were indeed the categories I needed to
classify all references included in my bibliographic
system. What I first decided to do was to include all
new references that were represented in the concept
map in the bibliographic system. In addition, I
revisited the existing categories in the bibliographic
system and changed some of them, based on the
words included in the concept map. The new
categories became the key components in the
conceptual framework of my literature review, and
even more so, key elements for the design of my
study.
The most exciting part of using these two tools
121. occurs when the reviewer actually begins to write the
literature review. The best tool for that, at least for
structuring the literature review itself, is to use the
concept map. Selecting each element included in the
concept map and filtering the system in Excel
according to these criteria will provide the reviewer
with all information related to a particular topic,
making the writing process much easier. The
reviewer then will have all pertinent references. After
reading what all the authors included in the
bibliographic system have written, it becomes easier
to write a synthesis of the existing discussion about
it. In this way, the reviewer, as the writer, can give
credit to the authors who have proposed a particular
concept without having to dig into the reviewer’s
memory or pile of articles, and the reviewer also can
avoid unintentional plagiarism. By using these two
tools the reviewer will be in a better position to find
122. her/his own voice and the chances of plagiarizing or
only summarizing what has been written is lower.
Advantages of these Tools
The existence of plagiarism is a recurrent
problem in academia (Ercegovac & Richardson,
2004; Hulsart & McCarthy, 2009), and I believe that
one of the reasons behind this problem has to do with
the lack of a system to match references with authors.
As doctoral students, we all have experienced this:
after reading numerous articles and books about a
topic, we assimilate terms and concepts, making it
difficult to remember to whom to give credit. The
importance of giving credit to people who have
proposed particular concepts is emphasized by APA
not only as a way to respect what others have written
previously but also as a great path to finding our own
contribution to a specific field.
123. The use of the bibliographic system in Excel
allows the user clearly to identify particular ideas of a
specific researcher or author; it also provides a great
opportunity for creativity because it promotes new
relationships among existing authors interested in the
same topic. By building those relationships, the
writer is able to find his or her own voice in the sense
that his or her own perspective becomes unique.
After summarizing, analyzing, and synthesizing the
literature, the writer can make supported claims about
that literature (Boote & Beile, 2005), instead of just
writing an annotated bibliography, a common
mistake found in dissertations (Hart, 2005). If the
same references included in the bibliographic system
are used by another person, a different perspective
will appear, and that is part of building emergent
communities of knowledge wherein several points of
view are shared (González et al., 2006).