Comparative Study of ECONOMISER Using the CFD Analysis IJMER
This paper presents a simulation of the economizer zone, which allowsstudying the flow
patterns developed in the fluid, while it flows along the length of the economizer. The past failure
details revelsthat erosion is more in U-bend areas of Economizer Unit because of increase in flue gas
velocity near these bends. But it isobserved that the velocity of flue gases surprisingly increases near
the lower bends as compared to upper ones. The model issolved using conventional CFD techniques by
FLUENT software. In which the individual tubes are treated as sub-gridfeatures. A geometrical model
is used to describe the multiplicity of heat-exchanging structures and the interconnectionsamong them.
The Computational Fluid Dynamics (CFD) approach is utilised for the creation of a three-dimensional
modelof the economizer coil of single column tube. With equilibrium assumption applied for
description of the system chemistry. The flue gastemperature, pressure and velocity field of fluid flow
within an economizer tube using the actual bounda
Evaluating mathematical heat transfer effectiveness equations using cfd techn...aeijjournal
Mathematical heat transfer equations for finned double pipe heat exchangers based on experimental work carried out in the 1970s can be programmed in a spreadsheet for repetitive use. Thus avoiding CFD analysis which can be time consuming and costly. However, it is important that such mathematical equations be evaluated for their accuracy. This paper uses CFD methods in evaluating the accuracy of mathematical equations. Several models were created with varying; geometry, flue gas entry temperature,
and flow rates. The analysis should provide designers and manufacturers a judgment on the expected level
of accuracy when using mathematical modelling methodology. This paper simultaneously identifies best
practices in carrying out such CFD analysis
Numerical Modeling and Simulation of a Double Tube Heat Exchanger Adopting a ...IJERA Editor
The double tube heat exchangers are commonly used in industry due to their simplicity in design and also their
operation at high temperatures and pressures. As the inlet parameters like temperatures and mass flow rates
change during operation, the outlet temperatures will also change. In the present paper, a simple approximate
linear model has been proposed to predict the outlet temperatures of a double tube heat exchanger, considering it
as a black box. The simulation of the heat exchanger has been carried out first using the commercial CFD
software FLUENT. Next the linear model of the double tube heat exchanger based on lumped parameters has
been developed using the basic governing equations, considering it as a black box. Results have been generated
for outlet temperatures for different inlet temperatures and mass flow rates of the cold and hot fluids. The results
obtained using the above two methods have then been discussed and compared with the numerical results
available in the literature to justify the basis for the assumption of a linear approximation. Comparisons of the
predicted results from the present model show a good agreement with the experimental results published in the
literature. The assumptions of linear variation of outlet temperatures with the inlet temperature of one fluid
(keeping other inlet parameters fixed) is very well justified and hence the model can be employed for the
analysis of double tube heat exchangers.
An Offshore Natural Gas Transmission Pipeline Model and Analysis for the Pred...IOSRJAC
The purpose of this paper is to model and analyze an existing natural gas transmission pipeline – the 24-inch, 5km gas export pipeline of the Amenam-Kpono field, Niger Delta, Nigeria – to determine properties such as pressure, temperature, density, flow velocity and, in particular, dew point, occurring at different segments of the pipeline, and to compare these with normal pipeline conditions in order to identify the segments most susceptible to condensation/hydrate formation so that cost-effective and efficient preventive/remedial actions can be taken. The analysis shows that high pressure and low temperature favor condensation/hydrate formation, and that because these conditions are more likely in the lower half of the pipeline system, remedial/preventive measures such as heating/insulation and inhibition injection should be channeled into that segment for cost optimization..
Basic Unit Conversions for Turbomachinery Calculations Vijay Sarathy
Turbomachinery equipment like centrifugal pumps & compressors have their performance stated as a function of Actual volumetric flow rate [Q] & Head [m/bar]. The following tutorial describes how pump/compressor head can be expressed in energy terms as ‘kJ/kg’. Turbomachinery head expressed in kJ/kg describes, how many kJ of energy is required to compress 1 kg of gas for a given pressure ratio. The advantage of using energy terms to estimate absorbed power is that it is based on the amount of ‘mass’ compressed which is independent of pressure and temperature of a fluid.
Numerical Simulation of Flow in a Solid Rocket Motor: Combustion Coupled Pres...inventionjournals
Acomputational study is performed for the simulation of reactive fluid flow in a solid rocket motor chamber with pressure dependent propellant burning surface regression. The model geometry consists of a 2D end burning lab-scale motor. Complete conservation equations of mass, momentum, energy and species are solved with finite rate chemistry. The pressure dependent regressive boundary in the combustion chamber is treated by use of remeshing techniques. Hydrogen and propane combustion processes are examined. Time dependent pressure and burning rate variations are illustrated comprehensively. Temperature and species mass fraction variations are given within the flame zone. Temperature, velocity and density distributions are compared for both constant burning rate and pressure dependent burning rate simulations.
Numerical Investigation of Mixed Convective Flow inside a Straight Pipe and B...iosrjce
The present study deals with a numerical investigation of steady laminar and turbulent mixed
convection heat transfer in a horizontal pipe and bend pipe using air as the working fluid.The thermal boundary
condition chosen is that of uniform temperature at the outer wall. Computations were performed to investigate
the effect of inlet Rayleigh number and Reynolds number in the velocity and temperature profile at inside of the
pipe. The secondary flow is more intense in the upper part of the cross-section. It increases throughout the
cross-section until its intensity reaches a maximum, and then it becomes weak at far downstream. For the
horizontal pipe the value of the L/D ratio becomes more than 10 the secondary flow effects are neutralized and
the velocity profile almost become constant throughout.
Piping systems associated with production, transporting oil & gas, water/gas injection into reservoirs, experience wear & tear with time & operations. There would be metal loss due to erosion, erosion-corrosion and cavitation to name a few. The presence of corrosion defects provides a means for localized fractures to propagate causing pipe ruptures & leakages. This also reduces the pipe/pipeline maximum allowable operating pressure [MAOP].
The following document covers methods by DNV standards to quantitatively estimate the erosion rate for ductile pipes and bends due to the presence of sand. It is to be noted that corrosion can occur in many other scenarios such as pipe dimensioning, flow rate limitations, pipe performance such as pressure drop, vibrations, noise, insulation, hydrate formation and removal, severe slug flow, terrain slugging and also upheaval buckling. However these aspects are not covered in this document.
Based on the erosional rates of pipes and bends, the Maximum Safe Pressure/Revised MAOP is evaluated based on a Level 1 Assessment procedure for the remaining strength of the pipeline. The Level 1 procedures taken up in this tutorial are RSTRENG 085dL method, DNVGL RP F-101 (Part-B) and PETROBRAS’s PB Equation.
Numerical Analysis of Header Configuration of the Plate-Fin Heat ExchangerIJMER
Numerical analysis of a plate fin heat exchanger accounting for the effect of fluid flow
maldistribution onthe inlet header configuration of the heat exchanger is investigated. In this analysis , it
was found that flow maldistribution has effect on the flow perpendicular to its velocity direction. The peak
velocity occurs in the central zone of the header while the velocityalong the perpendicular direction of the
inlet flow diminishes more and more. By this investigation,the results of the flow maldistribution are
presented for a plate fin heat exchangerwhich is reduced as compare to theexisting configuration of the
plate fin heat exchanger.
Optimized mould design of an Air cooler tankIOSR Journals
Proper modeling of mould for an air cooler tank is necessary to facilitate the ease for production line and weight reduction of the complete component assembly. The present research work aims at performing the structural analysis separately on 3 different models of moulds designed: Model-1: Mould extracted from the Pro-E software manufacturing module (say Thickness =‘t’). Model-2: Thickness reduced to half of the previous model for weight reduction. (t1= ½(t)) Model-3: Thickness reduced to half of the previous model for weight reduction. (t2= ¼(t)). The aim of the present work is to study the variation in displacement and stress values between Model-1, Model-2 and Model-3. This analysis is performed using FEM in ANSYS Software. The study is intended for appropriate reduction of thickness there by reducing the weight of complete assembly, which in turn reduces the complete cost of production of mould for an air cooler tank.
1D and 3D Modeling of Modern Automotive Exhaust ManifoldBarhm Mohamad
This paper presents the simulation of the multi-cylinder 4-stroke cycle spark-ignition engine
using a commercial simulation tool, AVL BOOST and Fire. Various models were examined to
select the appropriate models that would best serve to analyze the main components of the exhaust
systems: the plenum chamber, the muffler and the exhaust manifold branch junction. For the
plenum chamber and the muffler, the whole duct model was tested. In order to analyze the exhaust
manifold branch junction, a complicated model which reflects the actual shape and involves
pressure drops, velocity magnitude and sound pressure was compared to a simplified one.
However, the results from 1D and 3D model calculations compared with Honda K20B Engine
experimental data also show that both models are applicable with satisfying accuracy for exhaust
manifold branch junction. The simplified 1D model is recommended in regard to convenience in
modeling and efficiency in calculation.
The main objectives of the heat transfer analysis is to enhance the heat transfer rate from system to
surrounding. To transfer the heat from any system either by conduction or convection medium. Both modes of
heat transfer has been enhanced by providing an additional equipments in the outer periphery of the heat transfer
system.Fins are basically mechanical structures which are used to cool various structures by the process of
convection. Most part of their design is basically limited by the design of the system. But still certain parameters
and geometry could be modified to better heat transfer. In most of the cases simple fin geometry is preferred such
as rectangular fins and circular fins. Many experimental works has been done to improve the heat release of the
internal combustion engine cylinder and improves fin efficiency.This study presents the results of air flow and
heat transfer in a light weight automobile engine, considering fins with dimple to increase the heat transfer rate.
An analysis has been using ANSYS WORKBENCH version 12.0 was conducted to find the optimum number of
dimples to maximizing the heat transfer across the Automobile engine body. The results indicate that the
presence of fins with dimple shows improved results on the basis of heat transfer.
1 ijebm jan-2018-1-combustion adjustment in a naturalAI Publications
Shortage of detailed and accurate experimental data on fuel-air mixing in furnaces is due to the difficulty and complexity of measurements in flames. Although it may be possible with infra-Red camera to obtain an indication of what happens in the furnace by graphical image resolution this is not expected to be sufficiently detailed because it contains only the temperature gradient. More detailed information, however, may be obtained from the simulated resolution using Computational Fluid Dynamics (CFD) technique where the total number of elements/points defines the detailed level that can be displayed or captured in graphical image. Simulation resolution studies two aspects of the momentum effects on flame which are the forward momentum normally associated with the average outlet velocity of the combustion products and the lateral momentum caused by swirl. Following the American Petroleum Institute guidelines (API 560) for combustion adjustment in furnaces, it may be possible to have less emission and a maximum efficiency, but the potential interaction between the several operation and design factors are not thereby considered as in a mathematical model of CFD.
Bi-objective Optimization Apply to Environment a land Economic Dispatch Probl...ijceronline
International Journal of Computational Engineering Research (IJCER) is dedicated to protecting personal information and will make every reasonable effort to handle collected information appropriately. All information collected, as well as related requests, will be handled as carefully and efficiently as possible in accordance with IJCER standards for integrity and objectivity.
Exergy analysis of inlet water temperature of condenserIJERA Editor
The most of the power plant designed by energetic performance criteria based on first law of thermodynamics. According to First law of thermodynamics energy analysis cannot be justified the losses of energy.The method of exergy analysis is well suited to describe true magnitude of waste and loss to be determined. Such information can be used in the design of new energy efficient system and increasing the efficiency of existing systems.In the present study exergy analysis of the shell and tube condenser is carried out. As the condenser is one of the major components of the power plant, so it is necessary to operate the condenser efficiently under the various operating condition to increase the overall efficiency of the power plant. In the present study inlet temperature of the condenser is optimized using the exergy method. The main aim of paper is to be find out causes of energy destruction that can be helpful to redesign the system and to increase the efficiency
Similar to Computer aided thermal_design_optimisati (20)
Paul J. Boudreaux Consider a Mixed Analog/Digital/MEMsssusercf6d0e
Heat spreaders with high K values attached to the chip can help alleviate lateral DT problems. Placing the system or components into a forced isothermal environment also reduces DT, dT/dt and CTE related problems. Severing the thermomechanical heat path reduces or eliminates shock and vibration from entering the system while reducing weight.
Apart from TDMA, there are other iterative methods for solving the
system of equations which are faster. Unlike TDMA, which solves
the problem line by line, these iterative methods solves all
equations simultaneously. As a result these methods are faster than
TDMA. Some of the fast iterative methods are
1) SIP (strongly implicit procedure)
2) MSIP (modified SIP)
3) CG (Conjugate gradient method)
4) BiCGSTAB (bi-conjugate gradient stabilized method)
CG method is used for solving linear systems of equations which
have a symmetric coefficient matrix. All other methods mentioned
above are used for systems of equations involving non-symmetric
coefficient matrices.
must be set up at each nodal point.
We obtain a system of linear algebraic equations
Solve the system for values
Use any matrix solution method.
e.g. Tri-diagonal matrix algorithm (see textbook)
or: Gauss Seidel iteration method.
The convection of a scalar variable depends on the
magnitude and direction of the local velocity field.
How to find flow field?
Momentum equations can be derived from the Both sides of the equation contains temperatures at the new time step,
and a system of algebraic equations must be solved at each time level
is unconditionally stable for any Δt
is only first order accurate in time
small time steps are needed to ensure accuracy of results
The understanding of two-phase flow and heat transfer
with phase change in minichannels is needed for the design and
optimization of heat exchangers and other industrial
applications. In this study a three-dimensional numerical model
has been developed to predict filmwise condensation heat
transfer inside a rectangular minichannel. The Volume of Fluid
(VOF) method is used to track the vapor-liquid interface. The
modified High Resolution Interface Capture (HRIC) scheme is
employed to keep the interface sharp. The governing equations
and the VOF equation with relevant source terms for
condensation are solved. The surface tension is taken into
account in the modeling and it is evaluated by the Continuum
Surface Force (CSF) approach. The simulation is performed
using the CFD software package, ANSYS FLUENT, and an inhouse
developed code. This in-house code is specifically
developed to calculate the source terms associated with phase
change. These terms are deduced from Hertz-Knudsen equation
based on the kinetic gas theory. The numerical results are
validated with data obtained from the open literature. The
standard k-ω model is applied to model the turbulence through
both the liquid and vapor phase. The numerical results show
that surface tension plays an important role in the condensation
heat transfer process. Heat transfer enhancement is obtained
due to the presence of the corners. The surface tension pulls the
liquid towards the corners and reduces the average thermal
resistance in the cross section.
The role of boilers and heat recovery steam generators (HRSGs) in the industrial
economy has been profound. Boilers form the backbone of power plants,
cogeneration systems, and combined cycle plants. There are few process
plants, refineries, chemical plants, or electric utilities that do not have a steam
plant. Steam is the most convenient working fluid for industrial processing,
heating, chilling, and power generation applications. Fossil fuels will continue to
be the dominant energy providers for years to come.
This book is about steam generators, HRSGs, and related systems. There
are several excellent books on steam generation and boilers, and each has been
successful in emphasizing certain aspects of boilers and related topics such as
mechanical design details, metallurgy, corrosion, constructional aspects, maintenance,
or operational issues. This book is aimed at providing a different
perspective on steam generators and is biased toward thermal and process
design aspects of package boilers and HRSGs. (The terms ‘‘waste heat boiler’’
and ‘‘HRSG’’ are used in the same context.) My emphasis on thermal engineering
aspects of steam generators reinforced by hundreds of worked-out real-life
examples pertaining to boilers, HRSGs, and related systems will be of interest
to engineers involved in a broad field of steam generator–related activities such as
consulting, design, performance evaluation, and operation. During the last three decades I have had the opportunity to design hundreds
of package boilers and several hundred waste heat boilers that are in operation in
the U.S. and abroad. Based on my experience in reviewing numerous specifications
of boilers and HRSGs, I feel that consultants, plant engineers, contractors,
and decision makers involved in planning and developing steam plants often do
not appreciate some of the important and subtle aspects of design and performance
of steam generators.
Among the leading causes of discomfort in an air conditioned environment we can detected:
• too high air flow, generating drafts;
• uneven distribution of the incoming air volume;
• non homogeneous temperature distribution in the room.
To avoid these drawbacks, it is necessary to generate a proper diffusion of the air, which guarantees the right
temperature, relative humidity, speed and purity corresponding to the environmental comfort desired.
The Eurapo UCS cassette units are able to give a balanced response to all these needs: the outlet air is spread
like a classic four-way ceiling diffuser, with distribution from two to four orthogonal directions.
This system takes full advantage of the Coanda effect, greatly reducing the air flow direct to people, with
positive consequences for their comfort.
Overview of the fundamental roles in Hydropower generation and the components involved in wider Electrical Engineering.
This paper presents the design and construction of hydroelectric dams from the hydrologist’s survey of the valley before construction, all aspects and involved disciplines, fluid dynamics, structural engineering, generation and mains frequency regulation to the very transmission of power through the network in the United Kingdom.
Author: Robbie Edward Sayers
Collaborators and co editors: Charlie Sims and Connor Healey.
(C) 2024 Robbie E. Sayers
NO1 Uk best vashikaran specialist in delhi vashikaran baba near me online vas...Amil Baba Dawood bangali
Contact with Dawood Bhai Just call on +92322-6382012 and we'll help you. We'll solve all your problems within 12 to 24 hours and with 101% guarantee and with astrology systematic. If you want to take any personal or professional advice then also you can call us on +92322-6382012 , ONLINE LOVE PROBLEM & Other all types of Daily Life Problem's.Then CALL or WHATSAPP us on +92322-6382012 and Get all these problems solutions here by Amil Baba DAWOOD BANGALI
#vashikaranspecialist #astrologer #palmistry #amliyaat #taweez #manpasandshadi #horoscope #spiritual #lovelife #lovespell #marriagespell#aamilbabainpakistan #amilbabainkarachi #powerfullblackmagicspell #kalajadumantarspecialist #realamilbaba #AmilbabainPakistan #astrologerincanada #astrologerindubai #lovespellsmaster #kalajaduspecialist #lovespellsthatwork #aamilbabainlahore#blackmagicformarriage #aamilbaba #kalajadu #kalailam #taweez #wazifaexpert #jadumantar #vashikaranspecialist #astrologer #palmistry #amliyaat #taweez #manpasandshadi #horoscope #spiritual #lovelife #lovespell #marriagespell#aamilbabainpakistan #amilbabainkarachi #powerfullblackmagicspell #kalajadumantarspecialist #realamilbaba #AmilbabainPakistan #astrologerincanada #astrologerindubai #lovespellsmaster #kalajaduspecialist #lovespellsthatwork #aamilbabainlahore #blackmagicforlove #blackmagicformarriage #aamilbaba #kalajadu #kalailam #taweez #wazifaexpert #jadumantar #vashikaranspecialist #astrologer #palmistry #amliyaat #taweez #manpasandshadi #horoscope #spiritual #lovelife #lovespell #marriagespell#aamilbabainpakistan #amilbabainkarachi #powerfullblackmagicspell #kalajadumantarspecialist #realamilbaba #AmilbabainPakistan #astrologerincanada #astrologerindubai #lovespellsmaster #kalajaduspecialist #lovespellsthatwork #aamilbabainlahore #Amilbabainuk #amilbabainspain #amilbabaindubai #Amilbabainnorway #amilbabainkrachi #amilbabainlahore #amilbabaingujranwalan #amilbabainislamabad
Sachpazis:Terzaghi Bearing Capacity Estimation in simple terms with Calculati...Dr.Costas Sachpazis
Terzaghi's soil bearing capacity theory, developed by Karl Terzaghi, is a fundamental principle in geotechnical engineering used to determine the bearing capacity of shallow foundations. This theory provides a method to calculate the ultimate bearing capacity of soil, which is the maximum load per unit area that the soil can support without undergoing shear failure. The Calculation HTML Code included.
Saudi Arabia stands as a titan in the global energy landscape, renowned for its abundant oil and gas resources. It's the largest exporter of petroleum and holds some of the world's most significant reserves. Let's delve into the top 10 oil and gas projects shaping Saudi Arabia's energy future in 2024.
CFD Simulation of By-pass Flow in a HRSG module by R&R Consult.pptxR&R Consult
CFD analysis is incredibly effective at solving mysteries and improving the performance of complex systems!
Here's a great example: At a large natural gas-fired power plant, where they use waste heat to generate steam and energy, they were puzzled that their boiler wasn't producing as much steam as expected.
R&R and Tetra Engineering Group Inc. were asked to solve the issue with reduced steam production.
An inspection had shown that a significant amount of hot flue gas was bypassing the boiler tubes, where the heat was supposed to be transferred.
R&R Consult conducted a CFD analysis, which revealed that 6.3% of the flue gas was bypassing the boiler tubes without transferring heat. The analysis also showed that the flue gas was instead being directed along the sides of the boiler and between the modules that were supposed to capture the heat. This was the cause of the reduced performance.
Based on our results, Tetra Engineering installed covering plates to reduce the bypass flow. This improved the boiler's performance and increased electricity production.
It is always satisfying when we can help solve complex challenges like this. Do your systems also need a check-up or optimization? Give us a call!
Work done in cooperation with James Malloy and David Moelling from Tetra Engineering.
More examples of our work https://www.r-r-consult.dk/en/cases-en/
1. ISSN(Online): 2319-8753
ISSN (Print): 2347-6710
International Journal of Innovative Research in Science,
Engineering and Technology
(A High Impact Factor, Monthly Peer Reviewed Journal)
Vol. 5, Issue 1, January 2016
Copyright to IJIRSET DOI:10.15680/IJIRSET.2015.0501001 1
Computer-Aided Thermal Design Optimisation
Mohamed M. El-Awad
Associate Professor, Department of Engineering, Sohar College of Applied Sciences, Sohar, Oman
ABSTRACT: The aim of this paper is to demonstrate by means of relevant examples the usefulness of Excel as a tool
for introducing computer-aided design optimisation to engineering students.The performance of thermal systems is
strongly influenced by the cost of energy which constitutes a major part of their running cost.Thermal design, which
must take into consideration operating costs as well as initial costs, offers good examples of design optimisation.
Moreover, design optimisation of thermal systems can easilybe performed by using Excel. The examples considered in
the paper deal with insulated conduits carrying hot or cold air with respect to initial and energy costs. Unlike analytical
optimisation that can only be used for simple situations with a single design parameter, Excel can deal with thermal
designs that involve multiple design factors and elaborate analytical models.
KEYWORDS: Thermal-fluid systems, design optimisation; Excel, Solver.
I. INTRODUCTION
Thermal-fluid systems,or simply thermal systems,are mechanical-engineering systems that are used for the transfer and
utilisation of thermal energy in industrial, residential, and many other applications. Thermal design refers to the design
of these systems that is based on the principles of thermal sciences (thermodynamics, fluid mechanics, and heat
transfer). The design of thermal system is strongly influenced by the cost of energy as well as environmental
regulations that vary with location and time. Therefore, the acceptability of a thermal system does not depend only on
its initial cost, but also on its running cost. Thermal design can be used to illustrate the concept of design optimisation
more effectively than conventional types of mechanical-engineering design [1]. Like conventional design, thermal
design is an iterative process that requires the use of computers and computer software. In order to deal with design
assignments, standard textbooks in the field of thermal engineering now use relevant computer software[2,3]. By
eliminating the tedium of property tables and charts, computer software helps the students to improve their designs by
performing sensitivity and optimisation analyses that lead to more efficient systems with less energy consumption and
lower impact on the environment. Unfortunately, such applications are usually protected by proprietary rights and,
therefore, they are inaccessible for many engineering students particularly in developing countries.
Microsoft Excel,which comes as part of the widely-distrbuted Microsoft Office software, is is a general-purpose
spreadsheet application that is usually taught to junior engineering students within an introductory course in computer
application. Although Excel is an extremely versatile application,itismostly used only for data analysis and
presentation. However, Excelis equipped it with the necessary tools that allow students to perform design optimisation
analyses. Moreover, the computational capabilities of Excel as a modelling platform for engineering analyses can be
extended significantly by taking advantage of Visual Basic for Applications (VBA), which is a well-equipped
programming language that also comes as part of Microsoft Office. VBA can be used for developing additional user-
defined functions as required by thermal analyses [4]. With the wide availability of personal computers nowadays,
Excel can be a useful modelling platform for mechanical engineering students and practicing engineers alike. Ithas
already been used as an effective educational tool for introducing the basic concepts of thermal sciences[5-8]. The
present paper focuses on using Excel for design optimisation of thermal systems. By means of relevant examples, the
paper demonstrates the adequacy of Excel, together with its Solver add-in,as a modelling platform for thermal design
optimisation. The paper also highlights the advantages of computer-aided optimisation compared to analytical
optimisation of thermal systems design.
II. ANALYTICAL VERSUS COMPUTER-AIDED OPTIMISATION
To illustrate the methodologies of analytical and computer-aided optimisation, consider the following example
which was given by Janna [1]. In this example it is required to install insulation around a pipe that is carrying a heated
fluid as illustrated in Fig. 1. Due to space limitations, the outside diameter of the insulation D2 cannot exceed 12 cm.
2. ISSN(Online): 2319-8753
ISSN (Print): 2347-6710
International Journal of Innovative Research in Science,
Engineering and Technology
(A High Impact Factor, Monthly Peer Reviewed Journal)
Vol. 5, Issue 1, January 2016
Copyright to IJIRSET DOI:10.15680/IJIRSET.2015.0501001 2
On the one hand, we would like to install as large a pipe as possible so that the cost of pumping is not excessive. On the
other hand we would like to use an insulation that is as thick as possible in order to reduce the heat loss.
Fig. 1. Dimensions of the insulated pipe to be optimised
The cost of pumping the fluid through the pipe (Cp) is given by:
5
1
6
10
3
D
C p
(1)
Where D1 is in m, and the cost is in $/year. The cost of heating the fluid (Ch) is given by:
s
h
t
C
9
(2)
In which ts is the insulation thickness (ts= D2 – D1), in meters, and the cost is again in $/year.
The total cost (CT) is given by the summation of the pumping and heating costs:
s
T
t
D
C
9
10
3
5
1
6
=
1
2
5
1
6
9
10
3
D
D
D
(3)
By imposing the requirement that the maximum diameter D2 should not exceed 0.12 m, the total cost becomes;
1
5
1
6
12
.
0
9
10
3
D
D
CT
(4)
Differentiating Eq. (4) with respect to D1and equating the result to zero, Janna [1] obtained the following equation:
6
/
1
2
1
6
1 12
.
0
10
67
.
1 D
D
(5)
Eq. (5) requires an iterative solutionand the answer obtained by Janna [1] wasD1 = 0.045 m or 4.5 cm. The example
will now be solved by using Excel. Fig. 2 shows the Excel sheet developed for this example. Note that the sheet shows
the formulae used in the calculations in which cell labelling has been used. The sheet gives the total cost for a guessed
inner diameter D1 of 0.1 m. At this guessed diameter, the insulation thickness is 2 cm and the total cost is 450.3$.
D1
D
2
3. ISSN(Online): 2319-8753
ISSN (Print): 2347-6710
International Journal of Innovative Research in Science,
Engineering and Technology
(A High Impact Factor, Monthly Peer Reviewed Journal)
Vol. 5, Issue 1, January 2016
Copyright to IJIRSET DOI:10.15680/IJIRSET.2015.0501001 3
Fig. 2. Excel sheet forthe optimisation of insulated pipe
The diameter that minimises the total cost can be found by using the Solver add-in, which is an iterative “What-if
analysis” tool developed by Frontline Systems [9]. Found in the “Data” tab, Solver can be used to find the maximum or
minimum value of the function in a “target cell”. Solver can adjust the values of a group of cells - called the “adjustable
cells” - that are related either directly or indirectly to the formula in the target cell- to produce a specified value for the
formula in the target cell. Fig. 3 shows the dialog box for Solver set-up for finding the value of D1 (in the adjustable
cell) that minimises the total cost (in the target cell).Fig. 4 shows the sheet with the solution found by Solver. Excel’s
solution, which is 0.045763 m, agrees well with the value given by Janna [1].
Fig. 3. Solver set-up for insulated pipe optimisation
4. ISSN(Online): 2319-8753
ISSN (Print): 2347-6710
International Journal of Innovative Research in Science,
Engineering and Technology
(A High Impact Factor, Monthly Peer Reviewed Journal)
Vol. 5, Issue 1, January 2016
Copyright to IJIRSET DOI:10.15680/IJIRSET.2015.0501001 4
Fig. 4. Optimised solution for insulated pipe
One of the advantages of computer-aided optimisation compared to analytical optimisation,which is illustrated by
this example, is that itinvolves the basic equations without differentiation. However, the really significant advantage of
the computer-aided procedure is realised when the optimisation process involves multiple parameters and not just a
single parameter likeD1 in this example.We can also apply constraints on the solution which refer to other cells that
affect the formula in the target cell directly or indirectly. As the following example demonstrates, thecomputer-aided
method can also be applied even whenthe mathematical model is more elaborate and involves lengthy calculationsthat
make the optimisation problems impossible to solve analytically.
III. OPTIMISATION OF AN INSULATED AIR-CONDITIONING DUCT
Heated air enters the 30-m air-handling duct shown in Fig.5 at P1 = 100 kPa and T1 =80o
C. The flow rate at the
entrance is Q1 = 0.7 m3
/s, part of whichis discharged at a point 16 m downstream of the duct entrance(Q3=0.3 m3
/s).
The remaining part is discharged at the end (Q2 = 0.4 m3
/s). The air duct is to be assembled from 1-m-long
prefabricated units made of galvanized sheet metal and, in order to minimise heat losses to the surroundings, it is
desired to insulate the duct. Determine the diameters of the two duct sections (D1 and D2) and the thickness of
insulation on both sections (ts,1 and ts,2) that minimise the total owning cost based on the data provided below.
Fig. 5. The uninsulated air-conditioning duct
Air data:
Ambient temperature (T∞2) = 15o
C
Outside heat-transfer coefficient h2 = 30 W/m2
. o
C
Duct data:
Length of first section(L1) = 14 m
Length of second section(L2) = 16 m
Duct thickness (td) = 3 mm
5. ISSN(Online): 2319-8753
ISSN (Print): 2347-6710
International Journal of Innovative Research in Science,
Engineering and Technology
(A High Impact Factor, Monthly Peer Reviewed Journal)
Vol. 5, Issue 1, January 2016
Copyright to IJIRSET DOI:10.15680/IJIRSET.2015.0501001 5
Thermal conductivity (kd) = 18 W/m.o
C
Roughness height (ε) = 0.045mm
Cost of 1-m unit (cd) is as shown in Table 1
Insulation data:
Type: fiberglass
Thermal conductivity (ks) = 0.04 W/m.o
C
Insulation cost (cs1): 30 $/m2
per cm of insulation
Labour cost (cs2): 10 $/m2
(irrespective of thickness)
Table 1. Unit cost of the duct body [10]
Diameter Cost per 1 m
(Di) in m length ($)
0.1 9
0.15 11.5
0.2 14.5
0.25 17
0.3 22.5
0.35 29
0.4 34
0.45 40
0.5 50
Operation data:
365 days per year 24 hours per day
Energy costs:
Cost of electricity (cE): 0.12 $/kWh
Cost of fuel (cF): 0.5 $/therm (1 therm = 105500 kJ)
Capital recovery factor (i) = 0.15
IV.THE ANALYTICAL MODEL
The total annual costof the insulated air-duct (CTotal) consists of three components asexpressed by:
F
E
I
Total C
C
i
C
C
($) (6)
Where:
CI = initial cost which consists of the cost of the duct itself plus the cost of insulation
i = capital recovery factor
CE = cost of electricity consumed by the fan in order to overcome friction in the duct
CF = cost of fuel needed to make-up for the heat loss to the surrounding air
The analytical model describes how the three components of the total cost are evaluated.
a) Initial cost
The initial cost (CI) has two parts: (1) the cost of the duct itself (Cduct) and (2) the cost of insulation (Cins). The two
parts are given by:
Cduct = 2
2
,
2
1
1
,
1 L
c
D
L
c
D d
d
(7)
Cins =
2
2
2
1
1
1
2
,
2
2
1
,
1
1 s
s
s
s c
L
D
L
D
c
t
L
D
t
L
D
(8)
Where:
d
c = cost of 1-m duct unitwhich depends on the diameter ($/m)
1
,
s
c = cost of insulation per m2
that varies with insulation thickness ($/m2
.cm)
2
,
s
c = cost of labour per m2
that depends on insulated surface area only ($/m2
)
b) Annual cost of electricity:
6. ISSN(Online): 2319-8753
ISSN (Print): 2347-6710
International Journal of Innovative Research in Science,
Engineering and Technology
(A High Impact Factor, Monthly Peer Reviewed Journal)
Vol. 5, Issue 1, January 2016
Copyright to IJIRSET DOI:10.15680/IJIRSET.2015.0501001 6
)
.
/
($
)
(
)
( hr
kW
c
hr
time
kW
W
C E
fan
E
($) (9)
Where, fan
W
is the power consumed by the air-circulation fan and cE is the electricity tariff in $/kW.hr. The power
of the circulation fan depends on the friction head losses (hL)in both sections of the duct which are given by the
Darcy-Weisbach equation [11]:
g
V
D
L
f
hL
2
2
(m) (10)
Where fis the friction factor in each section of the duct which depends on the Reynolds number in the section and
can be obtained from the following equation [11].
2
9
.
0
10
Re
74
.
5
7
.
3
log
/
25
.
0
D
f
(11)
Where the roughness height (ε) is in m. The total power consumed by the air-circulation fan ( fan
W
) is then
determined from:
1000
2
2
,
1
1
, Q
h
Q
h
g
W
L
L
air
fan
(kW) (12)
c) Annual cost of fuel:
F
Total
F c
hr
time
W
Q
C
105500
1000
]
[
]
[
($) (13)
Where, cF is the cost of fuel in $/therm. The total heat loss ( Total
Q
) is the sum of the heat loss in both sections, i.e.
Total
Q
= 1
Q
+ 2
Q
, where the heat loss ( Q
) in each section is calculated according to the formula:
Total
R
T
T
Q 2
1
(W) (14)
Where T∞1 and T∞2 are the inside and outside air temperatures and RTotal is the total thermal resistance given by:
L
h
r
L
k
r
r
L
k
r
r
L
h
r
R
s
d
Total
2
3
2
3
1
2
1
1 2
1
2
/
ln
2
/
ln
2
1
(15)
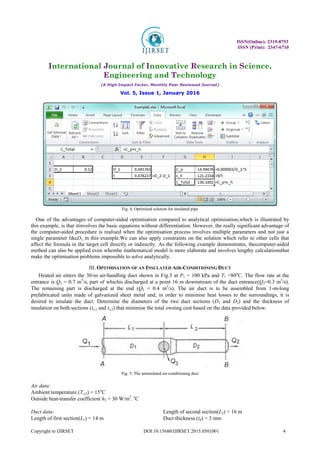
The radii r1, r2 and r3 used in Eq. (15) are as shown in Fig. 6.
Note that the value of the outside heat-transfer coefficient
(h2) is constant, but the inside heat-transfer coefficient
(h1),which depends on the air velocity, changes with the
inside diameter of the duct and therefore,has to be
determined from the Nusselt number (Nu):
Nu
D
k
h air
1
1 (W/m2
. o
C) (16)
7. ISSN(Online): 2319-8753
ISSN (Print): 2347-6710
International Journal of Innovative Research in Science,
Engineering and Technology
(A High Impact Factor, Monthly Peer Reviewed Journal)
Vol. 5, Issue 1, January 2016
Copyright to IJIRSET DOI:10.15680/IJIRSET.2015.0501001 7
For fully developed turbulent flow in smooth tubes, the
Nusselt number is calculated from the Dittus–
Boelterequation [12]:
3
.
0
8
.
0
Pr
Re
023
.
0 i
Nu (17)
Where Re and Pr are the Reynolds and Prandtl numbers,
respectively.
Fig. 6. Total thermal resistance of the insulated duct
V. EXCEL MODELAND SOLUTION
The Excel sheet developed for this example uses the relationships described in the previous section to determine the
total annual cost for guessed values of the diameters (D1and D2) and insulation thicknesses (ts,1andts,2) in the two
sections of the dutc. Solver is then used to find the optimum values of D1, D2, ts,1andts,2. The set-up box for Solver
requires it to minimise the total cost (C_total),which is the target cell, by changing the values of the two diameters (D1,
D2) and the two insulation thicknesses (ts,1, and ts,2), which are the adjustable cells. To allow Excel to automatically
calculate the cost of duct unit (cd) when the two duct diametersare changed, the following equation for cd was obtained
from the data shown in Table 1 by using Excel’s trendline:
2
91
.
169
7814
.
1
6881
.
7 D
D
cd
(18)
Properties of air at 80o
C were obtained from Cengel and Ghajar [12]. The optimised dimensions found by Solver are
shown in Table 2 which also shows the different cost involved. The nearest dimeters are D1=0.4m and D2=0.3 m. Both
insualtion thicknesses are ≈ 0.3 m. The total annual cost sums up to 479.7 $.
Table 2. Solver solution for the insulated duct
Values found
without Eq. (19) (m)
Values found with
Eq. (19) (m)
D1(m) 0.4142 0.4525
D2(m) 0.2951 0.2586
1
,
s
t (m) 0.2970 0.2953
2
,
s
t (m) 0.3023 0.3056
Cduct($) 128.5113 132.1191
Cins($) 95.7092 95.2828
CE ($) 182.7827 186.4329
CF ($) 72.6776 72.3330
CTotal($) 479.6808 486.1678
As a rule-of-thump,air-conditioning engineers frequently determine the duct areas from the ratio of flow rates.
Accordingly, the duct diameters D1 and D2are be related as follows:
8. ISSN(Online): 2319-8753
ISSN (Print): 2347-6710
International Journal of Innovative Research in Science,
Engineering and Technology
(A High Impact Factor, Monthly Peer Reviewed Journal)
Vol. 5, Issue 1, January 2016
Copyright to IJIRSET DOI:10.15680/IJIRSET.2015.0501001 8
1
1
3
2 / D
Q
Q
D
(19)
Let us now determine the optimum diameters and insulation thicknesses by applying Eq. (19). SinceD2 is related to D1
by Eq. (19), it cannot be used as an adjustable cell. The solution determined by Solver with D1, ts1 and ts2 as adjustable
cellsis also shown in Table 2.Compared to the solution obtained without Eq. (19),the rule-of-thump leads to a larger
D1and a smaller D2. Although the insulation thicknesses on the two section are only marginaly affected, the figures in
the table show that the total cost (486.2$) has increased due to increases in the initial cost of the duct (132.1$) as well
as the annual cost of electricity (186.4$).
By suitably adjusting the given data, the Excel sheet can be used to study the effects of electricity cost, fuel cost, or
capital recovery factor on the opimised solution.With minor modifications the sheet can also be used to optimise a duct
carrying cooled air instead of heated air. In this case, the fuel cost (CF) in Eq. (6) should be replaced by the cost of
electricity consumed by the refrigeration system (CE2) which can be calculated from:
E
Total
E c
COP
hr
time
W
Q
C
1000
]
[
]
[
2
(20)
Where COP is the coefficient of performance of the refrigeration system. Eq. (17) also has to be modified as follows:
4
.
0
8
.
0
Pr
Re
023
.
0 i
i
Nu (21)
VI. CONCLUSIONS
This paper demonstratesthe advantages ofcomputer-aided optimisation compared to analytical optimisation by
presenting two examples of thermal systemsthat use Microsoft Excel and its Solver add-in in the optimisation process.
The first exampleshows thatcomputer-aided optimisation,which doesn’t require differentiation, is simpler to apply than
analytical optimisation. Optimisation of the insulated duct considered in the second example can only be done with
computer-aided optimisationsince the analytical modelinvolves multiple parameters. Analyticaloptimisationcannot be
used in this example also becauseof the lengthy calculations and empirical equations involved.Moreover, once
developed the Excel sheet can be used to study the effect of various design parameters and operating conditions on the
design of thermal systems.
REFERENCES
[1] Janna, W.S., Design of Fluid Thermal Systems, 3rd
Edition, CENGAGE Learning, 2011.
[2] Cengel, Y.A. and Boles, M.A.,Thermodynamics an Engineering Approach, McGraw-Hill, 7th
Edition, 2007
[3] Moran,M.J. and Shapiro,H.N.. Fundamentals of Engineering Thermodynamics, 5th
edition, John Wiley & Sons Inc. 2006.
[4] El-Awad, M.M., Thermax: A Multi-Subject Excel Add-in for Thermal-Fluid Analyses. DOI: 10.13140/RG.2.1.5178.2482 Available online at
ResearchGate: https://www.researchgate.net/profile/Mohamed_El-Awad,2015.
[5] Holman,J.P. , Heat Transfer, 10th
edition, McGraw Hill, 2010.
[6] Schumack,M., “Use of a Spreadsheet Package to Demonstrate Fundamentals of Computational Fluid Dynamics and Heat Transfer”, Int. J.
Engng Ed. Vol. 20, No. 6, pp. 974-983, 2004.
[7] Karimi,A., “A compilation of Examples for using Excel in Solving heat transfer problems”, presented at 2009 Annual Conference &
Exposition of the American Society for Engineering Education (ASE), 2009, Austin Texas.
[8] Karimi,A., “Using Excel for the thermodynamic analyses of air-standard cycles and combustion processes”, ASME 2009 Lake Buena Vista,
Florida, USA.
[9] Frontline Systems, internet: http://www.Solver.com/(Last accessed November 23, 2015).
[10] The duct shop, https://www.theductshop.com/shop/catalog-galvanized-sheet-metal-duct-c-1_3.html, last accessed 24/12/2015.
[11] Crowe,C. T., Elger,D. F., Wiliams , B. C., and Roberson,J. A., Engineering Fluid Mechanics, 9th
edition, 2009.
[12] Cengel,Y. A. andGhajar, A. J.. Heat and Mass Transfer: Fundamentals and Applications. McGraw Hill, 2011.