This document describes a CFD simulation study of airflow and heat transfer in an electric bus to optimize the HVAC system. The author created 3D models of the bus and external environment in CAD software. CFD simulations were run using ANSYS to model airflow at steady state and during door opening/closing (transient). The simulations analyzed temperature distribution, airflow patterns, and energy loss. Several solutions were tested, including adding blowers at doors and adjusting diffusers. A new proposed solution is to add curved pads outside the doors to deflect incoming air when doors open, which will be designed and tested next. The goal is to minimize HVAC energy use by reducing unwanted air and heat transfer during passenger boarding/exiting.
CFD MODELLING OF FORMULA STUDENT CAR INTAKE SYSTEMBarhm Mohamad
Formula Student Car (FS) is an international race car design competition for students at universities of applied sciences and technical universities. The winning team is not the one that produces the fastest racing car, but the group that achieves the highest overall score in design, racing performance. The arrangement of internal components for example, predicting aerodynamics of the air intake system is crucial to optimizing car performance as speed changes. The air intake system consists of an inlet nozzle, throttle, restrictor, air box and cylinder suction pipes (runners). The paper deals with the use of CFD numerical simulations during the design and optimization of components. In this research article, two main steps are illustrated to develop carefully the design of the air box and match it with the suction pipe lengths to optimize torque over the entire range of operating speeds. Also the current intake system was assessed acoustically and simulated by means of 1-D gas dynamics using the software AVL-Boost. In this manner, before a new prototype intake manifold is built, the designer can save a substantial amount of time and resources. The results illustrate the improvement of simulation quality using the new models compared to the previous AVL-Boost models.
The results illustrate the improvement of simulation quality using the new models compared to the previous AVL-Boost models.
Comparison of CFD Simulation of a Hyundai I20 Model with Four Different Turbu...IJERA Editor
This article describes the CFD analysis of a Hyundai i20 car Model. The focus of this study is to investigate the
aerodynamics characteristics of Hyundai i20 car model and the flow obtained by solving the steady-state
governing continuity equations as well as the momentum conservation equations combined with one of four
turbulence models (1.Spalart-Allmaras 2.k-ε Standard 3.Transition k-kl-ω 4.Transition Shear Stress Transport
(SST)) and the solutions obtained using these different models were compared. Except transition k-kl-ω model,
other three models show nearly similar velocity variations plot. Pressure variation plot are almost similar with
K-ε and transition-SST models. Eddy viscosity plot are almost similar with K-ε and transition k-kl-ω models.
1D and 3D Modeling of Modern Automotive Exhaust ManifoldBarhm Mohamad
This paper presents the simulation of the multi-cylinder 4-stroke cycle spark-ignition engine
using a commercial simulation tool, AVL BOOST and Fire. Various models were examined to
select the appropriate models that would best serve to analyze the main components of the exhaust
systems: the plenum chamber, the muffler and the exhaust manifold branch junction. For the
plenum chamber and the muffler, the whole duct model was tested. In order to analyze the exhaust
manifold branch junction, a complicated model which reflects the actual shape and involves
pressure drops, velocity magnitude and sound pressure was compared to a simplified one.
However, the results from 1D and 3D model calculations compared with Honda K20B Engine
experimental data also show that both models are applicable with satisfying accuracy for exhaust
manifold branch junction. The simplified 1D model is recommended in regard to convenience in
modeling and efficiency in calculation.
Fluid dynamic and acoustic optimization methodology of a formula studeBarhm Mohamad
In this work a multilevel CFD analysis have been applied for the design of an engine exhaust system include manifold and muffler with improved characteristics of noise reduction and fluid dynamic response. The approaches developed and applied for the optimization process range from the 1D to fully 3D CFD simulation, exploring hybrid approaches based on the integration of a 1D model and 3D tools. Once the best configuration has been defined, the 1D-3D approach has been adopted to confirm the prediction carried out by means of the simplified approach, studying also the impact of the new configuration on the engine performances.
Exhaust System Muffler Volume Optimization of Light Commercial passenger Car ...Barhm Mohamad
Nowadays, the automotive industry is focused on weight and size reduction. Main advantage of this weight and size reduction are improving the fuel economy. The specific fuel consumption of a vehicle can be improved through e.g. downsizing area of heat loss, if we focus on vehicle with weight reduction. Weight reduction can be done by replacing material or by changing the size (dimensions) of components. In the present work we have focused on Audi A6 muffler, troubleshooting and optimizing the muffler by changing pipe length of inlet and outlet, also by replacing the original mesh plate to porous pipe. Based on optimization, prototype has been built with the help of 3D design tool CATIA V5 and the calculations of transmission loss (TL) have been performed by MATLAB. Plane wave-based models such as the transfer matrix method (TMM) can offer fast initial prototype solutions for muffler designers. The principles of TMM for predicting the transmission loss of a muffler was used. Result of this present study of an existing muffler has been analysed and then compared with vehicle level test observation data. Noise level have been optimized for new muffler design. Other literatures were played significant rule for validate our results.
Aerodynamic Drag Reduction for A Generic Sport Utility Vehicle Using Rear Suc...IJERA Editor
The high demand for new and improved aerodynamic drag reduction devices has led to the invention of flow control mechanisms and continuous suction is a promising strategy that does not have major impact on vehicle geometry. The implementation of this technique on sport utility vehicles (SUV) requires adequate choice of the size and location of the opening as well as the magnitude of the boundary suction velocity. In this paper we introduce a new methodology to identifying these parameters for maximum reduction in aerodynamic drag. The technique combines automatic modeling of the suction slit, computational fluid dynamics (CFD) and a global search method using orthogonal arrays. It is shown that a properly designed suction mechanism can reduce drag by up to 9%.
A Minimum Spanning Tree Approach of Solving a Transportation Probleminventionjournals
: This work centered on the transportation problem in the shipment of cable troughs for an underground cable installation from three supply ends to four locations at a construction site where they are needed; in which case, we sought to minimize the cost of shipment. The problem was modeled into a bipartite network representation and solved using the Kruskal method of minimum spanning tree; after which the solution was confirmed with TORA Optimization software version 2.00. The result showed that the cost obtained in shipping the cable troughs under the application of the method, which was AED 2,022,000 (in the United Arab Emirate Dollar), was more effective than that obtained from mere heuristics when compared
A Comparison Between Hybrid Method Technique and Transfer Matrix Method for D...Barhm Mohamad
Hybrid mufflers are now commonly equipped to decrease vehicle noise and are a crucial tool for regulation of the acoustic system. In order to ensure optimum engine efficiency, the system is intended to dump the strength of the acoustic pulses generated from the engine, and the back pressure created by these systems must be held to a minimum. Typically, modern mufflers have a complex structure of chambers and flow paths. There are a number of mechanisms for sound dampening that operate to silence the sound flowing through a muffler and piping device. This research introduces an important approach to optimize the transmission loss of hybrid muffler Formula student race car (FS) by using both experimental and analytical methods. For this analysis, two methods of calculation were chosen. The muffler has a complex partition located within the muffler chamber, which is a perforated pipe. For the creation of the Finite Element Analysis (FEA) model in AVL BOOST solver and another commercial advanced design software, the muffler CAD file was developed. Experi-mental measurements using a two-load method validated the FEA model. Reliable tests were conducted to verify the design parameters and optimize the muffler's transmission loss (TL) after the model was checked. The findings of experimental and machine analysis are included in the paper. For different measurement methods, recommendations are made for achieving optimum transmission loss curves.
Investigation of Perforated Tube Configuration Effect on the Performance of E...Barhm Mohamad
Using perforated tube in exhaust mufflers is known to improve transmission loss (TL) by improving their sound pressure level (SPL) at the orifice. The perforated tube should affect the muffler performance analogous to a shell-and-tube heat exchanger. To the authors’ knowledge, there are few previous assessments reported in literature of the effects that the perforated tube configuration has on acoustic response and pressure drop predicted. The effects of (i) the perforated tube length, (ii) the diameter of tube holes, and (iii) flow through perforated tube were investigated. To assess the perforated tube effect on flow, the SOLIDWORKS 2017 based on Computational Fluid Dynamics (CFD) tool was utilized using real walls approach model with a surface roughness of 0.5 micrometres (AISI 316 cold rolled stainless steel sheet (ss) Ra = 0:5 μm). Perforated tube was found to cause back pressure which may increase SPL about 10%.
A Minimum Spanning Tree Approach of Solving a Transportation Probleminventionjournals
: This work centered on the transportation problem in the shipment of cable troughs for an underground cable installation from three supply ends to four locations at a construction site where they are needed; in which case, we sought to minimize the cost of shipment. The problem was modeled into a bipartite network representation and solved using the Kruskal method of minimum spanning tree; after which the solution was confirmed with TORA Optimization software version 2.00. The result showed that the cost obtained in shipping the cable troughs under the application of the method, which was AED 2,022,000 (in the United Arab Emirate Dollar), was more effective than that obtained from mere heuristics when compared.
Finding shortest path on a terrain surface by using finite element method ( r...Gokhan ALTINTAS
The solution of the shortest path problem on a surface is not only a theoretical problem to be solved in the field of mathematics, but also problems that need to be solved in very different fields such as medicine, defense and construction technologies. When it comes to the land specific, solution algorithms for these problems are also of great importance in terms of determination of the shortest path in an open area where the road will pass in the field of civil engineering, or route determination of manned or unmanned vehicles for various logistic needs, especially in raw terrains.
In addition, path finding problems in the raw terrains are also important for manned and unmanned ground vehicles (UGV) used in the defense industry. Within the scope of this study, a method that can be used for instant route determinations within sight range or for route determinations covering wider areas is proposed. Although the examples presented within the scope of the study are land-based, the method can be applied to almost all problem types of similar nature. The approach used in the study can be briefly described as the mechanical analysis of a surface transformed into a structural load bearing system based on mechanical analogies.
In this approach, the determination of the shortest path connecting two points can be realized by following the stress-strain values that will occur by moving the points away from each other or by following a linear line that will be formed between two points during the mechanical analysis. If the proposed approach is to be carried out with multiple rigid body dynamics approaches instead of flexible bodies mechanics, it can be carried out easily and very quickly by determining the shortest path between two points or by tracking the forces. However, the proposed approach in this study is presented by simulating examples of flexible bodies using the finite element method. The approach used in this study is based on the approaches presented in Altintas [144].
Numerical Simulation and Modeling of UNSA91060 for Heat Transfer in Four-Stro...IJAEMSJORNAL
Heat transfer is one of a number of indispensable tools in studying of ICEs, due to its influence on decisive parameters of operation like temperature and pressure inside the cylinder. It is safe to say that modeling of the engine heat transfer is among the most complex problems for engineers. Application of numerical methods to predict the heat transfer in a cylinder of reciprocating ICEs is a process of high importance, which was recognized from the earliest stages of their development. This is done to examine performance optimization and design improvement in order to meet nowadays demands exhibited on the engines. This present study focuses on a 3-D transient state temperature distribution analysis on a gasoline engine model via formulated of models, simulating using FEM in-built in the COMSOL Multiphysics software 4.3a to determine the temperature distribution and gradient of the engine cylinder head model. The number of degrees of freedom solved for were 32685 in 383 s (12 minutes, 20 seconds) in the mesh optimization. From the result obtained it was discovered that the heat transfer in the combustion chamber of the ICE varies with time. Thus, it took the engine 10 minutes to complete a cycle vis-a-vis transfer of heat after combustion and that the heat transfer starts after 30 seconds of combustion. In addition, the temperature of the cylinder dropped from 1273.2 K to 301 K over a period of 10 minute.
Sustainable Urban Transport Planning using Big Data from Mobile PhonesDaniel Emaasit
In the past decades, there has been rapid urbanization as more and more people migrate into cities. The World Health Organization (WHO) estimates that by 2017, a majority of people will be living in urban areas. By 2030, 5 billion people—60 percent of the world’s population—will live in cities, compared with 3.6 billion in 2013. Developing nations must cope with this rapid urbanization. Transportation and urban planners must estimate travel demand for transportation facilities and use this to plan transportation infrastructure. Presently, the technique used for transportation planning uses data inputs from local and national household travel surveys. However, these surveys are expensive to conduct, cover smaller areas of cities and the time between surveys range from 5 to 10 years. This calls for new and innovative ways for Transportation Planning using new data sources.
In recent years, we have witnessed the proliferation of ubiquitous mobile computing devices in developing countries. These mobile phones capture the movement of vehicles and people in near real time and generate massive amounts of new data. My PhD research investigates how we can utilize anonymized mobile phone data ( i.e. Call Detail Records) and probabilistic machine learning to infer travel/mobility patterns. One of the objectives of this research is to demonstrate that these new “big” data sources are cheaper alternatives for transport modeling and travel behavior studies.
Review of Transport Models in Indian Context & their sustainiblity in Indiayoougal
Despite the high cost of model development, and their short shelf life, little review of their performance has been done in India.
The presentation includes the basic introduction of models with their application & pros & cons in Indian scenario.
Transportation planning is an integral part of overall urban planning and needs systematic approach.
Travel demand estimation is an important part of comprehensive transportation planning process.
However, planning does not end by predicting travel demand.
The ultimate aim of urban transport planning is to generate alternatives for improving transportation system to meet future demand and selecting the best alternative after proper evaluation.
Simulations Of Unsteady Flow Around A Generic Pickup Truck Using Reynolds Ave...Abhishek Jain
Above Research Paper can be downloaded from www.zeusnumerix.com
The research paper aims to replicate the wind tunnel test of General Motors pick-up truck using CFD analysis. The pickup is a blunt body and simulation reveals vortex shedding from the edges of the vehicle downstream. The unsteadiness of this phenomenon is seen in the oscillation of residue. The paper shows matching of velocity magnitude downstream of the vortex. Authors - Bahram Khalighi (GM, USA), Basant Gupta et al Zeus Numerix.
Optimization of Bajaj three wheeler carburetor fuel tube for better performancedbpublications
This paper presents the analysis of Bajaj three wheeler carburetor for better performance using Ansyss fluent computational fluid dynamics software. Carburetor is a device which mixes air and fuel before entering into the engine. If the mixture is not proper it results in excess fuel consumption, increase in pollution due to improper burning and also increase in running cost of the Bajaj. In this regard an effort has been made to optimize the design of the carburetor to minimize these problems. In Mettu town more than one thousand Bajaj three wheelers are running and it needs better optimization in order to achieve fuel saving thereby reducing the pollution. In this regard carburetor size was determined from the Bajaj three wheeler and it is simulated using Ansyss computational fluid dynamics software for different modification in fuel tube and size. Analysis has been done and different results were plotted, the results show there will be a better saving in fuel for modified design. The simulation has been done for different fuel tube size and modification of inlet obstacle. Modified design can be suggested to the manufacturer for the better performance thereby reducing the fuel consumption, environmental pollution and running cost of the Bajaj three wheeler.
Validation of Experimental and Numerical Techniques for Flow Analysis over an...IJERA Editor
The impact of improvement in vehicle aerodynamics mainly reflects in lower fuel consumption and lower carbon dioxide emissions into the atmosphere. The governments of many countries support continuous aerodynamics’ improvement programs as a way of mitigating the energy crisis and atmospheric pollution. This work has the main goal to validate experimental and numerical techniques for application in road vehicles. The experimental results were obtained through the analysis of the flow around a standard body with simple geometry called Ahmed Body, using hot wire anemometry from experiments in wind tunnel. It was also proposed a computational validation using a commercial software (Star CCM +) to further analyze the flow and to corroborate the experimental results. Both results were compared and allowed characterizing the flow around the vehicle. The results obtained analyzing the Ahmed Body aimed further application on aerodynamics of heavyduty vehicles, which is an ongoing research being developed at the Experimental Aerodynamics Research Center – CPAERO, in Brazil.
INVESTIGATION AND OPTIMIZATION OF THE ACOUSTIC PERFORMANCE OF FORMULA STUDENT...Barhm Mohamad
The University of Miskolc has previously designed and prototyped several race cars for the Formula Student (FS) competition. Unfortunately, none of these cars utilized air intake systems meeting all the requirements of regulations. Intake system are used to feed the engine with sufficient amount of air for complete combustion inside the combustion chamber to produce maximum power. The air flow during flowing produce sound waves due to rate of turbulence and boundary layer separation, and according to standard regulation this sound should be controlled minimum as possible. Recent advances in modelling procedures for accurate performance prediction have led to the development of modelling methods for practical intake system components in commercial design. Engine designers need simple and fast modelling tools, especially in the preliminary design evaluation stages. In this study, commercial software Solidworks and advanced design software Creo 4.0 were used in addition for that Computational Fluid Dynamics (CFD) analysis is performed. Frequency domain analysis is made to receive behaviour of the entire system under assumed conditions.
CFD Simulation for Flow over Passenger Car Using Tail Plates for Aerodynamic ...IOSR Journals
This work proposes an effective numerical model based on the Computational Fluid Dynamics
(CFD) approach to obtain the flow structure around a passenger car with Tail Plates. The experimental work of
the test vehicle and grid system is constructed by ANSYS-14.0. FLUENT which is the CFD solver & employed in
the present work. In this study, numerical iterations are completed, then after aerodynamic data and detailed
complicated flow structure are visualized.
In the present work, model of generic passenger car has been developed in solid works-10 and
generated the wind tunnel and applied the boundary conditions in ANSYS workbench 14.0 platform then after
testing and simulation has been performed for the evaluation of drag coefficient for passenger car. In another
case, the aerodynamics of the most suitable design of tail plate is introduced and analysedfor the evaluation of
drag coefficient for passenger car. The addition of tail plates results in a reduction of the drag-coefficient
3.87% and lift coefficient 16.62% in head-on wind. Rounding the edges partially reduces drag in head-on wind
but does not bring about the significant improvements in the aerodynamic efficiency of the passenger car with
tail plates, it can be obtained. Hence, the drag force can be reduced by using add on devices on vehicle and fuel
economy, stability of a passenger car can be improved.
Cooling of a truck cabin by vapour absorption refrigeration system using engi...eSAT Publishing House
IJRET : International Journal of Research in Engineering and Technology is an international peer reviewed, online journal published by eSAT Publishing House for the enhancement of research in various disciplines of Engineering and Technology. The aim and scope of the journal is to provide an academic medium and an important reference for the advancement and dissemination of research results that support high-level learning, teaching and research in the fields of Engineering and Technology. We bring together Scientists, Academician, Field Engineers, Scholars and Students of related fields of Engineering and Technology
1.Critically assess the aerodynamic characteristics of a vehicle.
2.Select and specify the most appropriate methods for wind tunnel testing of scale models and interpret the results of the test.
3.Analyse and critically evaluate the aerodynamic cooling systems.
FLUID FLOW ANALYSIS OF CENTRIFUGAL FAN BY USING FEMIAEME Publication
The forward backward curved (mixed) Centrifugal fan 630 has been analyzed aerodynamically for compare experimental results with simulation results by using ANSYS FLUENT (Finite Element Analysis Software). The material of the fan impeller was specified as ALUMINIUM. Boundary conditions on the Centrifugal fan-630 are taken from the reference. The flow distribution across the fan is obtained. The maximum static pressure at the inlet is known and the pressure distributions across the blade are obtained accordingly. The obtained results are compared with Experimental results is discussed. In final recommended the design of the centrifugal fan and results are tabulated. It’s observed that simulation results are nearer to the experimental results.
A combined cfd network method for the natural air ventilation - icwe13Stephane Meteodyn
The purpose of this work is to provide to designers a software devoted to calculate the wind on the buildings (CFD tools), to compute with a macroscopic method the exchange rate incoming to the building for each wind characteristics (incidence and velocity magnitude), and finally to give natural air ventilation statistics according to the wind statistics of the urban place considered. UrbaWind is an automatic computational fluid dynamics (CFD) code developed by Meteodyn to model the urban micro climate. In this context, the software Urbawind was upgraded to introduce the natural cross ventilation. The interface allows the computation of the flow rate incoming and outcoming across every air inlets and windows. The software first computes the pressure fields on the building envelope for every wind incidence with the wind reference velocity, then evaluates air exchanges rate for each climatology event and finally builds statistical data of the air exchanges useful for designers. The first step concerned a simple case, as detached house far from neighbor buildings, without internal fittings.The main objectives of this study are : 1 Extend the method to real complex buildings with many rooms and urban environment by introducing the climatology, 2 Include the indoor walls and doors into a simple network tool connected to the CFD software, 3 Produce data useful to assess the indoor thermal comfort: air change rate, indoor velocity.
Drag Reduction of Front Wing of an F1 Car using Adjoint Optimisationyasirmaliq
The Project Poster summarizes the aims and objectives of the Final Year Dissertation. The project starts with a detailed study on the parameters that tend to affect the performance of front wings of an F1 car and goes through designing the front wings(3) with endplates and wheel, meshing it, solving/analysing the flow and finally optimising the selected geometry using Fluent Adjoint Solver for efficient performance.
Adjoint optimisation technique is used to achieve optimal performance from the front wings. It's the most successful shape optimisation method as it's independent of the number of design variables exponentially reducing computational time and cost. The emphasis has been put on optimising the shape of the front wings using the Adjoint method as it’s the most efficient and computationally inexpensive method for design optimisation. The approach towards shape optimisation is downforce constrained drag minimization as it would result in keeping a constraint on downforce and reducing the drag at the same time, thus producing optima for a given downforce/drag value.
4. Ehinomhen (Nomen) Oseghale: E-bus: HVAC optimisation of an urban transport vehicle: a CFD model for the
evaluation of internal energy loss
4 | P a g e
Fig 3: Model bus door view
Fig 4: Model bus isometric view
Fig 5: Model bus isometric view
A new addition is introduced to the geometries. In
order to have an accurate result we need to
attach an outside geometry to the bus, with
appropriate spacing between both geometries.
We need to do this in order for the software to
specify what conditions are outside. This will
result in an accurate solution when the bus doors
are open. The outside world has a constant
temperature of 40C and 5m/s wind in X and Y
directions in two separate scenarios.
Outside geometry dimensions shown below;
Height – 20.0 m
Width (Extrusion) – 22.0 m
Length – 40.0 m
Fig 6: Bus and Outside geometries
Fig 6.1: Bus and Outside geometries
In fluid mechanics investigations, sub-scale
models are often used to reduce the cost and
time associated with full-scale systems. In this
experiment full scale model is used to generate
the most accurate result possible matching the
actual situation inside the real life bus. Air flow
data is taken in a full-scale model bus passenger
compartment, which are relatively the exact same
dimensions, curves, edges and placements of
partitions etc. of a typical full-size bus indoor
space. The full scale model is needed so that an
actual solution can be provided to clients
(BUSTECH) after thorough investigation has been
carried out.
In this study, although there is no heating
cooling by the ventilation air, there are several
heating sources inside and outside the bus. Due to
the complications of external heat sources the
most important dimensionless parameter to be
aware of it Reynold number and buoyancy. In
most situations, buoyancy effects from heating
loads influence the structure of the air flow and
5. Ehinomhen (Nomen) Oseghale: E-bus: HVAC optimisation of an urban transport vehicle: a CFD model for the
evaluation of internal energy loss
5 | P a g e
must be included, such effects are in this study
when dealing with outside air temperature, for
the purpose of accuracy and simplicity during the
simulation buoyancy was set to 1.2kg/m3 and
radiation heating source was turned off.
The sub-scale model room, as shown in Fig. 1,2,3
is made from fibre glass and has three plane glass
windows which provide adequate optical access;
the bus is 12.5m long, 2.4 m wide, and 2.8 m tall.
Four times 9 width 1.0 m long single inlet, 2.3 m
by 0.46 m outlet vent, both on the bus ceiling,
supply and remove ventilation air, windows on
both sides of the bus and a double door passenger
front door sitting at 1.2 m in width, height at 2.12
m and 3.5 m spacing from the front edge.
2.3 Meshing
Before ANSYS CFX can calculate for a solution, we
need to mesh the geometry so the boundary
condition can act as expected. The boundary
conditions needs less mesh element size in order
for the results to be much more accurate. In other
words the finer the mesh the more accurate the
results. In this case a fine quality mesh was used.
Fig 7: Mesh door view
Fig 8: Mesh side view
Fig 9: Mesh top view
Fig 9.1: Mesh top view (Bus and Outside)
Fig 9.2: Outside inlet 5m/s wind
As seen on fig 6, 7, 8 the diffusers, Doors, inside
bus partitions, Vent and body have been sized
appropriately. Re-sizing these portions result in a
much more accurate simulation results and
airflow.
2.4 Numerical solution procedure
For the model bus, using the ventilation
component constant flow rate of 4800L/s, and the
air buoyancy of 1.2kg/m3 therefore it requires an
inlet mass-flow rate of 1.1 kg/s, the inlet contains
a disturbed turbulent flow. The inlet section is
long enough for the boundary layers to converge,
so the majority of the inlet air velocity profile is
that of turbulent plug flow. The high mass-flow
rate makes the system essentially less sensitive to
small disturbances and thermal gradients that are
assumed to be negligible in the numerical
simulation. The fluctuations of temperature and
pressure in the inlet section are very small; the
inlet is built to behave like a jet like airflow.
The vent pressure was set as 0 Pa, initial
pressure is set to 101325 Pa this will make sure
there is equilibrium pressure in the bus at all
times. Windows are set as fiberglass with a heat
transfer coefficient of 0.96Wm^-2K^-1.
The door settings is a grey area that will be
fixed, the proposed solution for this is to create an
external geometry.
The high sensitivity to upstream disturbances
requires that the pressure regulation and
upstream conditioning of the inlet be closely
monitored. A bypass flow meter helps maintain a
6. Ehinomhen (Nomen) Oseghale: E-bus: HVAC optimisation of an urban transport vehicle: a CFD model for the
evaluation of internal energy loss
6 | P a g e
constant velocity and minimize pressure
perturbations. This bypass flow meter hasn’t been
created yet in this experiment, this could be the
cause of the inaccuracies. For the purpose of this
experiment the initial temperature is set to 30C
while the outside temperature is 40C
3. Results for Existing situation
Analysis
In this work, we set out several goals/objectives.
The passenger comfort and energy change is
analysed when the door is closed and when its
open. The thermo-hygrometric changes are also
investigated, as transient temperature and air
speed gradients, related to the bus stop with open
doors. The opening and closing doors phase
usually lasts for 20-30 seconds and substantially
change the internal thermo-fluid dynamic
conditions by creating strong air speed and
temperature gradients [1]. The passenger comfort
is lost especially in some areas of the vehicle
compartment [1]. Referring to the main aim which
is optimizing the HVAC system, 3 different
solutions have been presented and is still ongoing
testing. Firstly we accomplished a steady state
temperature, from initial temperature of 30C to a
steady state temperature of 20C in a total of 3.5
minutes.
Secondly, we analyse the change in
internal energy when the bus door is open. To do
this the outside boundary conditions and
temperature were set. The constant temperature
is 40C; the temperature was used to represent the
test area in summer (Queensland Australia).
3.1 Scenario 1: Internal temperature at
steady state (Door closed)
Firstly an internal steady state temperature was
calculated and analysed (temperature of bus
internal at steady state (To)). In this case the aim
is to monitor the change in temperature inside
the geometry after X-number of seconds and
when the temperature reached a steady state the
simulation is stopped. In this set-up it is important
to replicate a real life air conditioning system, as p
[the specified total pressure of the air dispensing
from the diffusers should equal the total pressure
of air been extracted by the ventilation system
{Pin = Pout}.
Fig 9.3: ZX Plane contour under diffuser (10
seconds)
Fig 9.3.1: ZX Plane contour under diffuser (60
seconds)
Fig 9.3.2: ZX Plane contour under diffuser (100
seconds)
Fig 9.3.3: ZX Plane contour under diffuser (300
seconds) (Steady state)
Fig 9.3.4: 1.5m YX Plane contour (100
seconds)(Steady state)
Fig 9.3.5: 1.5m YX Plane contour (100
seconds)(Steady state)
7. Ehinomhen (Nomen) Oseghale: E-bus: HVAC optimisation of an urban transport vehicle: a CFD model for the
evaluation of internal energy loss
7 | P a g e
Fig 10: Bus at steady state Top view
Fig 11: Bus at steady state side view
Fig 12: Temperature contour legend
Referring to fig 9.3, 9.3.1, 9.3.2 it relatively clear
that as time increases the temperature reduces,
due to the angled up bus internal it is noticeable
to see that the air temperature starts cooling
down from the back seats toward the front of bus.
This pattern is relatively accurate due to buoyancy
and total distance travelled by the cold fluid and
also air mixing modifications. In the bus the
temperature reduces from an initial temperature
of 30C to 19.3C in a span of 252 seconds.
Fig 13: XY Plane contour (1.5 m from bottom of
bus) (10 seconds)
Fig 14 XY Plane contour (1.5 m from bottom of
bus) (60 seconds)
Fig 15: XY Plane contour (1.5 m from bottom of
bus) (100 seconds)
Fig 16: XY Plane contour (1.5 m from bottom of
bus) (300 seconds)
As seen on fig 13, 14,15,16 at 1.5 meter about the
bus floor it is relatively clear that as time increases
the temperature reduces, due to the angled up
bus internal it is noticeable to see that the air
temperature starts cooling down from the back
seats toward the front of bus. This pattern is
relatively accurate due to buoyancy and total
distance travelled by the cold fluid and also air
mixing modifications. In the bus the temperature
reduces from an initial temperature of 30C to
19.3C in a span of 115 seconds.
Tim
e (s)
Monitor
Point: Back
passenger
1
(Temperatu
re)
Monitor
Point:
Behind
door 1
(Temper
ature)
Monitor
Point:
Disabled
seat
(Temper
ature)
Monitor
Point:
Driver
(Temper
ature)
0 30.0 30.0 30.0 30.0
12 29.1 29.4 29.1 30.0
24 25.6 27.7 27.1 30.0
36 24.3 27.3 25.1 28.7
48 23.7 23.7 23.9 26.8
60 22.8 23.0 24.6 26.2
72 22.5 23.2 23.2 25.5
84 22.3 22.2 22.4 24.3
96 22.2 21.7 21.6 23.5
108 21.7 21.3 21.1 22.8
8. Ehinomhen (Nomen) Oseghale: E-bus: HVAC optimisation of an urban transport vehicle: a CFD model for the
evaluation of internal energy loss
8 | P a g e
120 21.3 21.4 20.9 22.5
132 21.4 21.0 20.7 22.0
144 21.3 20.5 20.5 21.6
156 21.0 20.4 20.4 21.2
168 20.9 20.4 20.3 20.9
180 20.7 20.5 20.1 20.8
192 20.7 20.4 20.1 20.8
204 20.7 20.2 20.2 20.6
216 20.6 20.2 20.2 20.5
228 20.6 20.3 20.1 20.5
240 20.5 20.2 20.1 20.4
252 20.4 20.2 20.1 20.4
Avg 22.4 22.4 22.3 23.6
Table 1: Test points temperature over time.
Graph 1: Test points temperature (C) over time (s).
The graph above shows a realistic trend in
temperature changes when the diffusers are
turned on. It can be seen that the max
temperature is 30C (initial), after 4 minutes the
bus reaches a minimum steady state temperature
of 20C.
Fig 17: Airflow streamline of inlet and outlet (AC
on) (1 second)
Fig 18: Airflow streamline of inlet and outlet (AC
on)
Fig 19: Airflow streamline of inlet and outlet (AC
on)
As seen on fig 17, 18, 19 the internal airflow
streamline shows the airflow movement and
change in temperature as it moves through the
bus towards the vent. This pattern is relatively
accurate as the diffuser cools the bus the vent
19.00
21.00
23.00
25.00
27.00
29.00
31.00
0 30 60 90 120 150 180 210 240
Temperature(C)
STEADY STATE
Monitor Point:
Back passenger 1
(Temperature)
Monitor Point:
Behind door 1
(Temperature)
Monitor Point:
Disabled seat
(Temperature)
Monitor Point:
Driver
(Temperature)
10. Ehinomhen (Nomen) Oseghale: E-bus: HVAC optimisation of an urban transport vehicle: a CFD model for the
evaluation of internal energy loss
10 | P a g e
Fig 22: Door open top view(X direction)
Fig 23: Door open door view (after 3s) (X
direction)
Fig 24: Door open door view (after 9s) (X
direction)
Fig 25: Door open door view (after 45s) (X
direction)
Fig 26: Door open door view (after75s) (X
direction)
Fig 27: Door open top view (after75s) (X
direction)
Figure 22 clearly illustrates the top view of both
the bus and outside domains. It shows that the
outside has a constant 40C degree temperature.
Fig 23 After 3 seconds, it proves that the doors
and outside domains are in perfect sync; this can
be confirmed by looking at the hot air rise above
the colder air, therefore the hot air blows into the
bus through the top of the door and the cold air
escapes through the bottom, this validates the
laws of physics. The hot air has lower buoyancy
(1.12kgm3) while the cold air-conditioned air has
a buoyancy of 1.2kgm3. These buoyancy values
are not constant, the buoyancy value changes
with temperature. Figure 24 shows the
temperature contour the door after 9 seconds.
Figures 25, 26, & 27 shows that after 45 seconds
and 75 seconds respectively, the hot air goes into
the bus through the front door and the keep an
equilibrium pressure the air-conditioned air goes
out through the back door. Figures 28 & 29
displays streamlines at the bus doors, showing air
going in and out of the bus.
Fig 28: 1.5m XY Plane Door open top view (after
0s) (Wind X direction)
Fig 29: 1.5m XY Plane Door open top view (after
9s) (Wind X direction)
Fig 30: 1.5m XY Plane Door open top view (after
45s) (Wind X direction)
Fig 31: 1.5m XY Plane Door open top view (after
75s) (Wind X direction)
Figure 28 shows the bus at a height of 1.5 meters
from the top of bus at time 0 seconds (Door just
opens). Figure 29 clearly shows the results when
the bus doors are open, it can clearly be seen that
the air goes in through the front door at a higher
11. Ehinomhen (Nomen) Oseghale: E-bus: HVAC optimisation of an urban transport vehicle: a CFD model for the
evaluation of internal energy loss
11 | P a g e
rate and velocity that the back door. Reason for
this is due to the fact that the vent is located close
to the front door. Therefore the air that goes into
the bus is relatively sucked through the vent to
keep an equilibrium pressure and stable
temperature inside the bus. Figure 30 & 31 shows
the progression of the airflow in respect to time
45 seconds and 75 seconds respectively.
Fig 32: 2.1m XY Plane Door open top view (after
9s) (Wind X direction)
Fig 33: 2.1m XY Plane Door open top view (after
45s) (Wind X direction)
Fig 34: 2.1m XY Plane Door open top view (after
75s) (Wind X direction)
Figure 32, 33 & 34 shows the bus at a height of
2.1 meters from the top of bus at time 9, 45 and
75 seconds respectively.
Tim
e (s)
Back
pass
enge
r (C)
Behi
nd
rear
door
(C)
Behi
nd
front
door
(C)
Disa
bled
seat
(C)
Drive
r (C)
Outsi
de
(C)
0 20.0 20.0 20.0 20.0 20.0 40.0
3 20.0 20.0 20.0 20.0 20.0 40.0
6 20.0 20.0 20.3 20.1 20.7 40.0
9 20.0 20.0 20.3 20.9 20.7 40.0
12 20.0 20.0 20.3 22.3 24.2 40.0
15 20.1 20.0 20.2 23.5 27.1 40.0
18 20.4 20.0 21.2 22.8 24.5 40.0
21 20.9 20.1 21.8 22.1 24.5 40.0
24 21.7 20.1 22.3 22.7 27.6 40.0
27 22.2 20.1 23.2 23.8 27.5 40.0
30 22.1 20.3 23.5 24.0 27.1 40.0
33 22.5 20.4 23.2 24.9 26.5 40.0
36 23.4 20.4 23.5 25.3 26.2 40.0
39 24.0 20.5 23.7 24.6 26.6 40.0
42 24.5 20.5 23.6 24.5 26.6 40.0
45 24.6 20.6 23.5 24.4 26.5 40.0
48 24.2 20.7 24.2 24.4 27.6 40.0
51 23.6 20.8 24.8 24.2 27.1 40.0
54 23.3 21.0 26.4 24.0 26.4 40.0
57 23.2 21.1 25.8 24.3 26.4 40.0
60 23.3 21.2 23.5 24.4 27.4 40.0
63 23.3 21.3 22.7 24.2 28.4 40.0
66 23.4 21.3 23.1 24.9 27.5 40.0
69 23.4 21.3 23.7 26.0 27.0 40.0
72 23.4 21.3 24.1 26.2 27.0 40.0
75 23.9 21.4 24.0 25.5 29.2 40.0
Avg 22.4 20.6 22.8 23.6 25.8 40.0
Table 2: Test points temperature over time when
door is open for 75 seconds (Wind in X-direction).
12. Ehinomhen (Nomen) Oseghale: E-bus: HVAC optimisation of an urban transport vehicle: a CFD model for the
evaluation of internal energy loss
12 | P a g e
Graph 2: Test points temperature (C) over time (s).
Table 2 shows that the driver hits a maximum
temperature of 29.9C at time 75 seconds. The
passenger behind the rear door has a record low
average temperature of 20.6C followed by the
back passenger 22.4C. The driver records the
highest temperature of 25.8C. This temperature
change inside the bus proves the fact that energy
is been lost and gained when the doors are open.
It also solidifies the outside domain working as
intended.
Test 2: Door Open wind in Y-direction
Initial temperature inside bus – 20C
Initial temperature outside bus – 40C
Constant wind velocity and direction –
5m/s towards bus (Y direction)
Bus inlet temperature – 20C (Constant)
Door open at– 5s
Door open total time – 75s (1.15 mins)
Fig 35: Door open door view (after 9s) (Y
direction)
Fig 36: Door open door view (after75s) (Y
direction)
Fig 37: Door open top view (after75s) (X
direction)
As seen on figures 35, 36 & 37 it can be seen
that the result’s looks as expected. At 9
seconds the hot 5m/s air will blow in through
the rear door that and the makes it way to
the front door where the vent is located.
Fig 38: 1.5m XY Plane Door open top view (after
0s) (Wind Y direction)
15.00
20.00
25.00
30.00
35.00
40.00
1 2 3 4 5 6 7 8 9 10 11 12 13 14 15 16 17 18 19 20 21 22 23 24 25 26
Temperature(C)
AC ON Door Open (Wind from back)
Monitor Point: Back
passenger 1 (Temperature)
Monitor Point: Back
passenger (Temperature)
Monitor Point: Behind
door 2 (Temperature)
Monitor Point: Behind
front door (Temperature)
Monitor Point: Disabled
seat (Temperature)
Monitor Point: Driver
(Temperature)
Monitor Point: Outside
(Temperature)
13. Ehinomhen (Nomen) Oseghale: E-bus: HVAC optimisation of an urban transport vehicle: a CFD model for the
evaluation of internal energy loss
13 | P a g e
Fig 39: 1.5m XY Plane Door open top view (after
9s) (Wind Y direction)
Fig 40: 1.5m XY Plane Door open top view (after
45s) (Wind Y direction)
Fig 41: 1.5m XY Plane Door open top view (after
75s) (Wind Y direction)
Overall looking at the temperature contour, and
tables it can be seen that the internal
temperature is slightly higher when the wind
comes from the Y-direction (Back of bus).
Fig 42: 2.1m XY Plane Door open top view (after
9s) (Wind Y direction)
Fig 43: 2.1m XY Plane Door open top view (after
45s) (Wind Y direction)
Fig 44: 2.1m XY Plane Door open top view (after
45s) (Wind Y direction)
Figure 42, 43 & 44 shows the bus at a height of
2.1 meters from the top of bus at time 9, 45 and
75 seconds respectively.
Tim
e (s)
Back
pass
enge
r (C)
Behi
nd
rear
door
(C)
Behi
nd
front
door
(C)
Disa
bled
seat
(C)
Drive
r (C)
Outsi
de
(C)
0 20.0 20.0 20.0 20.0 20.0 40.0
3 20.0 20.0 20.0 20.0 20.0 40.0
6 20.0 20.0 20.0 20.2 20.0 40.0
9 20.3 20.0 20.0 23.0 20.0 40.0
12 20.1 20.0 22.0 24.3 21.2 40.0
15 20.3 20.9 27.0 23.1 25.9 40.0
18 21.9 22.5 29.7 22.4 28.6 40.0
21 25.3 22.7 29.4 23.8 30.4 40.0
24 26.8 22.4 29.2 25.3 31.9 40.0
27 26.9 21.2 29.8 25.4 32.3 40.0
30 26.4 20.5 28.9 24.7 32.2 40.0
33 25.6 20.5 27.6 25.1 32.5 40.0
36 25.2 20.7 27.2 25.5 32.1 40.0
39 25.3 20.8 27.0 25.7 31.4 40.0
42 25.5 20.8 26.8 25.6 31.2 40.0
45 25.4 20.8 26.4 25.5 31.5 40.0
48 25.4 20.9 25.9 25.7 31.7 40.0
51 25.6 21.1 25.4 26.2 31.2 40.0
54 25.7 21.3 24.9 26.2 29.7 40.0
57 25.7 22.1 24.7 25.7 28.6 40.0
60 25.7 22.1 24.4 26.1 28.9 40.0
63 25.6 21.8 23.9 26.3 29.6 40.0
66 25.4 21.9 23.8 25.7 29.8 40.0
69 25.2 22.0 25.5 25.5 30.1 40.0
72 25.4 22.1 27.1 26.1 30.0 40.0
75 25.7 22.2 26.9 26.0 29.8 40.0
Avg 24.2 21.2 25.5 24.6 28.5 40.0
Table 3: Test points temperature over time when
door is open for 75 seconds (Wind in Y-direction).
14. Ehinomhen (Nomen) Oseghale: E-bus: HVAC optimisation of an urban transport vehicle: a CFD model for the
evaluation of internal energy loss
14 | P a g e
Graph 3: Test points temperature (C) over time (s).
Table 3 shows that the driver hits a maximum
temperature of 28.5C, (10.5% more that wind in
X- direction) at time 75 seconds. The passenger
behind the rear door has a record low of an
average temperature of 21.2C, (3.9% more than
wind in X-direction), Followed by the back
passenger 24.2C, (8.5% more than wind in X-
direction). The driver records the highest
temperature of 28.5C. This temperature change
inside the bus proves the fact that energy is been
lost and gained when the doors are open. It also
solidifies the outside domain working as intended.
Comparing wind in both X and Y directions shows
a common trend, the hottest passenger in both
scenarios is the driver followed by the passenger
behind the front door, then disabled seat, back
passenger & behind front door passenger.
3.4 Wind from back vs Wind from
front (Original setup)
Below is the average change in temperature when
the door is open with wind in both X and Y
directions respectively.
Test Point X-
direction
(C)
Y-
direction
(C)
%
Difference
(C)
Back
passenger
22.4 24.2 7.72
Behind rear
door
20.6 21.2 2.87
Behind
front door
22.8 25.5 11.18
Disabled
seat
23.6 24.6 4.15
Driver 25.8 28.5 9.94
Table 4: Test points average temperature
percentage difference over time when door is
open for 75 seconds (Wind in X&Y-direction).
Table 4 shows that the back passengers achieved
the lowest temperature in both scenarios and
they also record the lowest temperature
difference. Although the drivers have the highest
average temperature for both test scenarios, they
have a 9.9% difference in average temperature
(second highest % difference). The highest
temperature difference is recorded at the
passenger behind the front door. This figure
15.00
20.00
25.00
30.00
35.00
40.00
0 12 24 36 48 60 72
Temperature(C)
AC ON Door Open (Wind from Front) Monitor Point: Back
passenger 1
(Temperature)
Monitor Point: Back
passenger
(Temperature)
Monitor Point: Behind
door 2 (Temperature)
Monitor Point: Behind
front door
(Temperature)
Monitor Point:
Disabled seat
(Temperature)
Monitor Point: Driver
(Temperature)
Monitor Point:
Outside (Temperature)
15. Ehinomhen (Nomen) Oseghale: E-bus: HVAC optimisation of an urban transport vehicle: a CFD model for the
evaluation of internal energy loss
15 | P a g e
proves that the model works as expected.
Now with these concrete results of the change
in temperature inside the bus when the door is
open, innovative and realistic solutions are
simulated. Several ideas failed and 2 proposed
solutions produced positive results.
4. Solution 1 (Change diffuser
mount position)
The aim here is to reduce the average
temperature change inside the bus when the door
is open for a total time of 75 seconds. The tested
solution is to turn off the RHS diffusers and extend
the LHS diffusers forward coinciding with the front
door, essentially the diffusers runs across the
front door. Only the LHS diffuser is turned on and
its mass flow rate increases from 0.555kg/m^2 to
1.11kg/m^2. This idea of turning off the RHS
diffusers is to see if there is a noticeable
difference when the LHS diffusers mass flow rate
is increased, (RHS diffusers = 0kg/m^2, LHS
diffusers = 1.11kg/m^2). Applying more air-
conditioned air and pressure to the door area
should reduce the total energy going into the bus
Test 3: Diffuser extension Door Open wind in
X-direction (Solution)
Fig 45: 1.5m XY Plane Door open top view (after
0s) (Wind X direction)
Fig 46: 1.5m XY Plane Door open top view (after
9s) (Wind X direction)
Fig 47: 1.5m XY Plane Door open top view (after
45s) (Wind X direction)
Fig 48: 1.5m XY Plane Door open top view (after
75s) (Wind X direction)
Figure 45 shows the bus at a height of 1.5 meters
from the top of bus at time 0 seconds (Door just
opens). Figure 46 clearly shows what happens
when the bus doors are open, it can be seen that
the air goes in through the front door at a higher
rate and velocity than the back door. Reason for
this is due to the fact that the vent is located close
to the front door. Therefore the air that goes into
the bus is relatively sucked through the vent to
keep an equilibrium pressure and stable
temperature inside the bus. Figure 47 & 48 shows
the progression of the airflow in respect to time
45 seconds and 75 seconds respectively.
Fig 49: 2.1m XY Plane Door open top view (after
9s) (Wind X direction)
Fig 50: 2.1m XY Plane Door open top view (after
45s) (Wind X direction)
Fig 51: 2.1m XY Plane Door open top view (after
75s) (Wind X direction)
Figure 49, 50 & 51 shows the bus at a height of
2.1 meters from the top of bus at time 9, 45 and
75 seconds respectively.
16. Ehinomhen (Nomen) Oseghale: E-bus: HVAC optimisation of an urban transport vehicle: a CFD model for the
evaluation of internal energy loss
16 | P a g e
Ti
me
(s)
Back
passen
ger (C)
Behi
nd
rear
door
(C)
Behi
nd
front
door
(C)
Disa
bled
seat
(C)
Drive
r (C)
Outsi
de
(C)
0 20.0 20.0 20.0 20.0 20.0 40.0
3 20.0 20.0 20.0 20.0 20.0 40.0
6 20.0 20.0 20.0 20.0 20.6 40.0
9 20.0 20.0 20.3 20.5 23.2 40.0
12 20.0 20.2 21.7 21.6 25.6 40.0
15 20.0 21.1 23.0 21.9 25.5 40.0
18 20.0 22.4 22.7 22.9 27.4 40.0
21 20.0 23.1 22.5 23.3 27.6 40.0
24 20.0 23.0 22.8 23.9 26.8 40.0
27 20.1 22.7 23.3 26.4 26.8 40.0
30 20.1 23.0 23.7 26.1 27.0 40.0
33 20.2 23.6 23.5 24.1 27.1 40.0
36 20.3 23.8 22.9 23.4 26.8 40.0
39 20.9 23.4 22.6 24.0 26.4 40.0
42 21.6 23.4 22.7 24.9 26.1 40.0
45 21.3 24.1 23.1 25.4 26.0 40.0
48 21.1 24.7 23.3 25.7 25.9 40.0
51 21.1 24.8 23.3 25.8 25.9 40.0
54 21.2 25.1 23.3 25.8 25.9 40.0
57 21.5 26.0 23.6 25.8 26.0 40.0
60 22.0 26.1 23.9 25.9 26.3 40.0
63 22.2 25.7 24.1 26.3 26.6 40.0
66 22.3 25.8 24.0 27.3 26.7 40.0
69 22.4 25.8 23.6 28.3 26.9 40.0
72 22.3 26.1 23.6 28.5 26.9 40.0
75 22.1 26.7 24.1 27.2 26.9 40.0
Av
g
20.9 23.5 22.7 24.4 25.6 40.0
Table 4: Test points temperature over time when
door is open for 75 seconds (Wind in X-direction).
Graph 4: Test points temperature (C) over time (s).
Table 4 shows that the disabled seat passenger
hits a maximum temperature of 25.6C at time 72
seconds. The passenger behind the rear door has
a record low of an average temperature of 20.9C
followed by the back passenger 22.7C. The
disabled seat passenger records the highest
temperature of 25.6C. This temperature change
inside the bus proves the fact that energy is been
lost and gained when the doors are open. It also
solidifies the outside domain working as intended.
15.0
20.0
25.0
30.0
35.0
40.0
0 12 24 36 48 60 72
Temperature(C)
LHS Diffuser only. Wind from back
Monitor Point: Back passenger
(Temperature)
Monitor Point: Behind door 1
(Temperature)
Monitor Point: Behind front
door (Temperature)
Monitor Point: Disabled seat
(Temperature)
Monitor Point: Driver
(Temperature)
Monitor Point: Outside
(Temperature)
17. Ehinomhen (Nomen) Oseghale: E-bus: HVAC optimisation of an urban transport vehicle: a CFD model for the
evaluation of internal energy loss
17 | P a g e
Test 4: Diffuser extension Door Open wind in
Y-direction
Fig 45: 1.5m XY Plane Door open top view (after
0s) (Wind X direction)
Fig 45: 1.5m XY Plane Door open top view (after
9s) (Wind X direction)
Fig 46: 1.5m XY Plane Door open top view (after
45s) (Wind X direction)
Fig 47: 1.5m XY Plane Door open top view (after
75s) (Wind X direction)
Figure 45 shows the bus at a height of 1.5 meters
from the top of bus at time 0 seconds (Door just
opens). Figure 46 clearly shows what happens
when the bus doors are open, it can be seen that
the air goes in through the back door at a higher
rate and velocity than the front door. Reason for
this could be due to the fact that the wind is
coming from the back of the bus. Figure 47 & 48
shows the progression of the airflow in respect to
time 45 seconds and 75 seconds respectively.
Fig 48: 2.1m XY Plane Door open top view (after
9s) (Wind X direction)
Fig 49: 2.1m XY Plane Door open top view (after
45s) (Wind X direction)
Fig 50: 2.1m XY Plane Door open top view (after
75s) (Wind X direction)
Figure 48, 49 & 50 shows the bus at a height of
2.1 meters from the top of bus at time 9, 45 and
75 seconds respectively.
Tim
e (s)
Back
pass
enge
r (C)
Behi
nd
rear
door
(C)
Behi
nd
front
door
(C)
Disa
bled
seat
(C)
Drive
r (C)
Outsi
de
(C)
0 20.0 20.0 20.0 20.0 20.0 40.0
3 20.0 20.0 20.0 20.0 20.0 40.0
6 20.0 20.0 20.0 20.7 20.0 40.0
9 20.0 20.0 20.0 25.6 20.2 40.0
12 20.0 20.0 22.3 28.6 21.1 40.0
15 20.9 22.1 24.0 26.1 22.4 40.0
18 21.8 25.0 24.5 24.3 25.6 40.0
21 22.2 25.0 24.0 24.4 30.5 40.0
24 22.1 25.0 24.4 25.6 29.4 40.0
27 22.8 26.0 25.3 25.7 27.1 40.0
30 23.8 25.4 24.9 25.9 27.1 40.0
33 22.9 24.5 24.4 26.4 26.3 40.0
36 21.6 24.1 24.3 26.7 25.3 40.0
39 22.1 24.3 24.0 26.7 25.3 40.0
42 23.0 24.6 24.2 25.4 25.6 40.0
45 23.0 24.7 24.5 24.9 26.2 40.0
48 23.0 24.8 25.0 25.8 28.7 40.0
51 23.3 24.9 25.2 26.4 28.6 40.0
54 23.5 24.6 24.7 26.4 27.5 40.0
57 23.4 24.7 24.0 26.1 26.4 40.0
60 23.3 24.8 23.7 25.7 25.4 40.0
63 23.4 24.8 23.5 25.2 25.3 40.0
66 23.8 25.0 23.7 25.0 26.0 40.0
69 24.2 25.3 24.0 25.0 26.0 40.0
72 24.5 25.5 23.6 25.2 26.1 40.0
75 25.0 25.3 23.5 25.5 26.4 40.0
Avg 22.4 23.9 23.5 25.1 25.3 40.0
Table 5: Test points temperature over time when
door is open for 75 seconds (Wind in Y-direction).
18. Ehinomhen (Nomen) Oseghale: E-bus: HVAC optimisation of an urban transport vehicle: a CFD model for the
evaluation of internal energy loss
18 | P a g e
Graph 5: Test points temperature (C) over time(s)
.
Table 5 shows that the driver hits a maximum
temperature of 30.5C after 21 seconds. The back
passenger has a record low of an average
temperature of 22.4C followed by the passenger
behind front door 23.5C. The driver records the
highest temperature of 30.5C. This temperature
change inside the bus proves the fact that energy
is been lost and gained when the doors are open.
It also solidifies the outside domain working as
intended.
3.4 Diffuser extension solution vs
Current data
Below is the average change in temperature when
the door is open with wind in both X and Y
directions respectively for the current accurate
simulation results and the solution (diffuser
extension).
Wind from Front (X-direction):
Test Point X-
direction
(C)
(Current)
X-
direction
(C)
(Solution)
%
Difference
(C)
Back
passenger
22.4 20.1 10.82
Behind rear
door
20.6 23.5 13.15
Behind
front door
22.8 22.7 0.44
Disabled
seat
23.6 24.4 3.33
Driver 25.8 25.6 0.78
Table 6: Test points average temperature
percentage difference over time when door is
open for 75 seconds (Wind in X-direction).
Table 6 shows the passenger behind the front
door recorded the lowest temperature change of
0.44%. The highest temperature difference is
recorded at the passenger behind the rear door
13.15%. This figure proves that the model works
as expected.
Now with these concrete results of the change
in temperature inside the bus when the door is
open, innovative and realistic solutions are
15.0
20.0
25.0
30.0
35.0
40.0
1 5 9 13 17 21 25
Temperature(C)
LHS Diffuser only. Wind from back
Monitor Point: Back
passenger (Temperature)
Monitor Point: Behind door
1 (Temperature)
Monitor Point: Behind door
2 (Temperature)
Monitor Point: Behind front
door (Temperature)
Monitor Point: Disabled
seat (Temperature)
Monitor Point: Driver
(Temperature)
Monitor Point: Outside
(Temperature)
19. Ehinomhen (Nomen) Oseghale: E-bus: HVAC optimisation of an urban transport vehicle: a CFD model for the
evaluation of internal energy loss
19 | P a g e
simulated. Several ideas failed and 2 proposed
solutions produced positive results.
Wind from Front (Y-direction):
Test Point Y-
direction
(C)
(Current)
Y-
direction
(C)
(Solution)
%
Difference
(C)
Back
passenger
24.2 22.4 7.72
Behind rear
door
21.2 23.9 11.97
Behind
front door
25.5 23.5 8.16
Disabled
seat
24.6 25.1 2.01
Driver 28.5 25.3 11.89
Table 7: Test points average temperature
percentage difference over time when door is
open for 75 seconds (Wind in Y-direction).
Table 7 shows the disabled seat passenger
recorded the lowest temperature change of
2.01%. The highest temperature difference is
recorded at the passenger behind the rear door
11.97%. This figure proves that the model works
as expected. Now with these concrete results of
the change in temperature inside the bus when
the door is
5. Solution 2 (Mechanical
addition to outside of doors
when open)
This solution is potentially going to produce more
accurate results. The plan is to create a curve pad
across the door (Y direction); this curved pad will
open when the door is open. So when the wind
blows the air curves across the door and
potentially less air goes into the bus through the
doors.
6. Conclusion
The main aim is to use modern simulation
techniques and sound engineering principles to
minimise energy wastage through the HVAC
system of an electric bus. Due to the energy
density difference, this work is applicable for
lithium ion electric bus rather than diesel buses.
The geometry used for this study has all necessary
components (Front and Rear doors, Ventilation
unit and diffusers). This geometry equals modern
day busses.
The research undertaken so far suggests that
the results are accurate. This article showcases
the results from this study. With the main aim in
mind, three objectives were required to be
completed. Firstly a successfully simulation was
carried out to investigate the airflow inside the
bus when the doors were closed (steady state).
This result established the current steady state
temperature and air quality inside the bus in real
life scenario. We assumed the initial temperature
is 30C while the outside temperature is 40C
constant. Turning on the air diffusers released
cold air-conditioned air into the bus; this air
refrigerates the bus to a steady state of 20C in a
total of 3.5mins. Also noted is the ventilation unit
as it works as expected; it constantly sucks out
excess contaminated air from inside the bus and
returns the air as cool air-conditioned air. This is
known as the refrigeration cycle. To simulate and
achieve the best results, a second geometry
needed to be designed; this geometry acts as an
outside world. It has a constant temperature of
40C and wind in both X (Front of bus) and –X
(Back of bus) directions, replicating different
weather conditions. This outside domain enabled
simulating the airflow with the bus doors open
possible and an accurate result was achieved.
Analysing the resultant data from the airflow
simulation of the change in energy inside the bus
when the door is open proves that there is a
possible solution to be implemented. Several
solutions were tested to reduce the volume of hot
air going into the bus. Such solution include
turning off the RHS diffusers and doubling the
20. Ehinomhen (Nomen) Oseghale: E-bus: HVAC optimisation of an urban transport vehicle: a CFD model for the
evaluation of internal energy loss
20 | P a g e
mass flowrate of the LHS diffusers, so the cold air
mixes the hot air before it travels far into the bus.
As shown in this article that solution didn’t
produce significant result. To achieve the aim,
geometry modifications needed to be applied to
the bus. The proposed solution is to create curve
pads across the doors (Y direction); these curved
pads will open when the door is open. So when
the air blows it curves over the curved pads across
the door and potentially deflects the air from
going into the bus through the doors. This new
proposed solution is been designed and tested. At
this point in time a definite conclusion cannot be
made due to the errors already encountered.
However based on these results, the internal
steady temperature proves to be accurate; also
the second scenario (door open) proves to be
accurate. The new solution involves Mechanical
addition to outside of doors when open, this
solution is potentially going to produce more
accurate results.
Furthermore, looking back at all the time and
expertise applied in the simulations it can be
noted that three out of four objectives have been
successfully achieved and a realistic idea of the
next proposed solution has been design and
undergoing simulation/testing. The ultimate goal
of reducing the energy wastage inside the electric
bus is relatively within reach.
Nomenclature
𝐾 𝑃 =
[𝑃𝐶] 𝐶
× [𝑃 𝐷] 𝑑
[𝑃𝐴] 𝑎 × [𝑃𝐵] 𝑏
𝑚′
= 𝜌 × 𝑉′
𝑚′
= 𝜌 × 𝑣 × 𝐴
𝜌 =
𝑃
𝑅 × 𝑇
References
[1] Roberto de Lieto Vollaro. Indoor Climate
Analysis for Urban Mobility Buses: a CFD
Model for the Evaluation of thermal
Comfort. International Journal of
Environmental Protection and Policy . Vol.
1, No. 1, 2013, pp. 1-8. doi:
10.11648/j.ijepp.20130101.11
[2] Posner J.D., Buchanan C.R., Dunn-Rankin
D. 2003. Measurement and prediction of
indoor air flow in a model room. Energy
and Buildings, Vol.35, Issue 5, pp.515–
526.
[3] J.D. Posner, C.R. Buchanan, D. Dunn-
Rankin, Department of Mechanical and
Aerospace Engineering, University of
California, 4200 Engineering Gateway,
Irvine, CA 92697-3975, USA Received 2
January 2002, Accepted 6 September
2002, Available online 23 October 2002
[4] Ltd, B.P. (2015) XDi 12.5 metre. Available
at: http://bustech.net.au/products/xdi-
12-5 metre/ (Accessed: 10 April 2016).
[5] E. Karden, S. Ploumen, B. Fricke, T. Miller,
K. Snyder Energy storage devices for
future hybrid electric vehicles Journal of
Power Sources, 168 (2007), pp. 2–11
[6] Energy density - Energy Education. 2016.
Energy density - Energy Education.
[ONLINE] Available at:
http://energyeducation.ca/encyclopedia/
Energy_density. [Accessed 23 May 2016].
[7] C. Dillon. (2009, October). How Far Will
Energy Go? - An Energy Density
Comparison [Online]. Available:
http://www.cleanenergyinsight.org/intere
sting/how-far-will-your-energy-go-an-
energy-density-comparison/
[8] A. Golnik and G. Elert. (2003). Energy
Density of Gasoline [Online]. Available:
http://hypertextbook.com/facts/2003/Art
hurGolnik.shtml.
[9] Uni. South Carolina. (2003, October).
Description of Energy and Power [Online].
Available:
21. Ehinomhen (Nomen) Oseghale: E-bus: HVAC optimisation of an urban transport vehicle: a CFD model for the
evaluation of internal energy loss
21 | P a g e
http://www.che.sc.edu/centers/RCS/desc
_e_and_p.htm
[10] Absolute, Dynamic and Kinematic
Viscosity . 2016. Absolute, Dynamic and
Kinematic Viscosity . [ONLINE] Available
at:
http://www.engineeringtoolbox.com/dyn
amic-absolute-kinematic-viscosity-
d_412.html. [Accessed 26 May 2016].
[11] WhatIs.com. 2016. What is computational
fluid dynamics (CFD)? - Definition from
WhatIs.com. [ONLINE] Available at:
http://whatis.techtarget.com/definition/c
omputational-fluid-dynamics-CFD.
[Accessed 27 May 2016].
[12] Shyu, C.-W. (2014). "Ensuring access to
electricity and minimum basic electricity
needs as a goal for the post-MDG
development agenda after 2015." Energy
for Sustainable Development 19(0): 29-38.
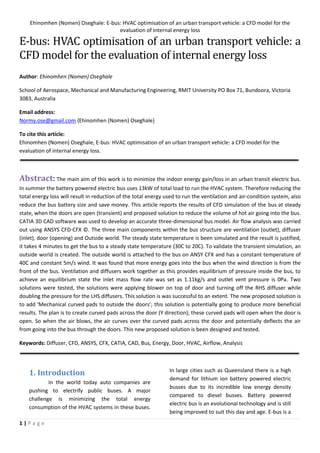
![Ehinomhen (Nomen) Oseghale: E-bus: HVAC optimisation of an urban transport vehicle: a CFD model for the
evaluation of internal energy loss
2 | P a g e
bus that is driven by an electric motor and two
tonne battery and its’ energy is obtained as does
by an electric car. Electric busses are of vital
importance socially and economically, its
importance affects public transport uses globally.
The idea of energy loss in public transport arises
from the somewhat frequent door opening of
these busses. The internal temperature humidity
conditions are an important factor for the
comfort, health and safety of passengers and
drivers. To recreate this pattern it is a must that
the physical aspects are accurate. Air flows from
a region at high pressure to a region at low
pressure. As long as there is a pressure difference,
there is an air flow and in this case, the bus
interior is at a low pressure and the exterior is at a
high pressure (initially). Air flows in through the
diffusers. As air molecules accumulate inside the
bus, the pressure inside increases at a certain
rate. At one instant, equilibrium is reached and
the air stops flowing. Now, the air molecules can
only flow out of the bus if the pressure outside
drops to a low value such that, there is a pressure
difference. In this case, the interior is at a high
pressure when compared to the exterior. It's only
in this case that the air molecules flow out of the
bus. For this reasons the automotive industry has
developed ways to model the internal of the bus
and door structure to keep the loss of internal
energy to a minimum. If this goal is achieved, then
the energy loss actual value will be valid.
In this experiment, in order make adequate
progression, with the aid of CFD several
computational simulation scenarios will be carried
out to determine the airflow changes in the bus
internal.
3. CFD model
Simulations are performed with the commercial
CFD software CFX-PRE [3]. Although this software
is used because it provides state of the art grid
generation and flow modelling capabilities,
comparable results could be obtained with any of
the many similar numerical commercial models
available. Three different representations of the
fluid flow in the room are used: laminar flow,
turbulent flow using the standard k–ε turbulence
model, and turbulent flow using the RNG k–ε
turbulence model. In a relatively recent study,
Chen [4] compared the performance of five
different models for simulating simple indoor air
flows and found that the standard and RNG k–ε
predicted actual flow patterns best. The RNG
model was found to perform slightly better than
the standard model in some situations [5] and [7].
The validity of the RNG k–ε model is not yet
assured, however, due to its entirely theoretical
development and lack of widespread application
[8] and [11], but there is particular interest in its
performance with complex indoor air flows.
2. Numerical Analysis
The mathematical model, implemented for the
optimization of the air distribution system, inside
the compartment of a bus, was built using CFD
numerical analysis software (CFX-PRE ©).
The CFD, Computational Fluid Dynamics,
software identifies the method which, through
numerical algorithms, leads to the solution of the
equations which could be the laminar, or a fluid’s
turbulent motion and of the related thermo-
dynamic processes within a specified geometry.
The 3 contributors to the bus internal heat gain
are;
Radiation (1kW/m^2 @ 12 noon in
summer)
Convection
Conduction
3. Existing situation Analysis
To make adequate progress towards achieving the
aims and objectives, certain adequate
experiments have to be taken and resulting data
must be analysed to full potential. Below is the 2
main simulations done to make adequate
progress towards the aim and objectives.](data:image/gif;base64,R0lGODlhAQABAIAAAAAAAP///yH5BAEAAAAALAAAAAABAAEAAAIBRAA7)