Download to read offline
![Signal & Image Processing : An International Journal (SIPIJ) Vol.7, No.3, June 2016
46
section and matching section. Face database images are acquired using sensors and features are
extracted using spatial or transform domain techniques.
Contribution: In this paper Compression based Face Recognition using DWT and SVM is
proposed. The novel concept of converting many images of person into one image is introduced.
The face images are compressed using DWT and SVM. The features are extracted by fusing LL
band coefficients with Support Vectors of LL band.
Organisation: The remaining sections of this paper are structured as follows. Section 2 explains
the literature survey of existing techniques. Section 3 describes the proposed face recognition
model. The proposed algorithm is given in section 4. The performance analysis is discussed in
section 5.Conclusion is given Section 6.
2. LITERATURE SURVEY
In this section, the existing various techniques of biometrics are discussed. Thai Hoang Le et and
Len Bui [1] proposed a model on Face Recognition Based on Support Vector Machine (SVM)
and 2-Dimensional Principle Component Analysis (2DPCA). In this model feature vectors are
obtained using 2DPCA technique and then different classifiers like Multi Layer Perception
(MLP), K-Nearest Neighbor (K-NN) and SVM are used for recognition. The experiment result
shows that the combination of 2DPCA and SVM yields a greater accuracy. Saeid Fazli et al., [2]
proposed JPEG2000 Image Compression using SVM and DWT. Initially the images are DC level
shifted by subtracting 128 from each pixel. The shifted images undergo five levels of DWT using
9/7 filter bank to get LL band. Then SVM is applied for further compression ie., SVM selects the
desired features out of obtained features and it is called Support Vectors. Finally the images are
scalar quantized followed by Huffman encoding. Harin Sellahewa and Sabah A. Jassim [3]
proposed Image-Quality-Based Adaptive Face Recognition. This model presents an approach to
overcome one of the main constraints like varying lighting conditions. Image quality (Q) is
measured in terms of illumination distortion in comparison to known reference image. Reference
image is obtained by averaging images of 38 individual faces. Later Global luminance distortion
in Q (GLQ) is calculated for each image. If GLQ is less than a predefined threshold,
normalization is performed. Later wavelet transform like Pyramid Scheme is applied for feature
extraction. At a resolution level of k, the pyramid scheme decomposes an image I into 3k + 1. The
highest identification accuracy is achieved by fusing the similarity scores of LH and HL sub-
bands.
Vinoda Yaragatti and Bhaskar [4] proposed face recognition using neural network. In this
approach, features of images are obtained by fusing the Dual Tree Complex Wavelet Transform
(DTCWT) coefficients and Principle Component Analysis (PCA) coefficients. Finally these
features are compared with the features of database which are already trained in Artificial Neural
Network (ANN). Idan Ram et al., [5] Proposed Facial Image Compression using Patch-Ordering
Based Adaptive Wavelet Transform. A Compression algorithm using Redundant Tree Based
Wavelet Transform (RTBWT) is implemented. Images are compressed by applying sparse coding
using RTBWT, then quantizing the result and applying the encoding and a post processing filter
for further improvement of the results. Sonja Grgic and Grgic [6] Proposed Performance Analysis
of Image Compression Using Wavelets. Discrete Wavelet transform based compression technique
with different type of the wavelets are used analyze the signal to noise ratio. Also discrete cosine
transform compression also considered for the SNR ratio and observing the result. Michael Elad
et al., [7] Proposed a Low Bit-Rate Compression of Facial Images. Geometrically deform the
image into canonical form by mapping each facial feature into corresponding spatial location.
Then images are converted into tiles and model these tiles in a compact manner. Using bit
allocation and vector tree quantization a lossy compression is achieved on these tiles, resulting](https://image.slidesharecdn.com/7316sipij04-160708052517/85/COMPRESSION-BASED-FACE-RECOGNITION-USING-DWT-AND-SVM-2-320.jpg)
![Signal & Image Processing : An International Journal (SIPIJ) Vol.7, No.3, June 2016
47
very low bit rate output image. Kai Dong-Hyuk Shin et al., [8] proposed using Adaptive Gaussian
Filtering. The standard deviation that used for the filter is found out from the input noisy image.
For calculating the noise level, image is divided into blocks and selects the smooth blocks.
Standard deviation is calculated from difference of smooth blocks of input image and filtered
image. Munawar Hayat et al., [9] proposed the deep reconstruction model for image set
classification. These are mainly used in networks such as multi-view cameras, personal albums.
This paper represents the deep reconstruction of samples given and detects the geometric
structures automatically; here they have used Template Deep Reconstruction Model (TDRM),
which takes place initialization of performance by Gaussian Restricted Boltzmann Machines
(GRBMS). Zhao-Rong Lai et al., [10] proposed the Discriminative and Compact Coding for
Robust Face Recognition. Discriminative and Compact Coding (DCC) is introduced for multiple
error measurements into regression models. There are two types of proposed models viz., (i)
Multi-scale error measurements. (ii)Inspire within-class collaborative representation. DCC is
robust method to produce the stable regression residual, which is more important for
classification. Xiaobing Pei et al.,[11] proposed Manifold Adaptive Label Propagation (MALP)
for Face Clustering. The model deals with the semi-supervised clustering problems. MALP tries
to find graph weight matrix along with the graph edges of the given data set and integrates sparse
representation constraint into regular framework of Label Propagation (LP), which can enhance
the performance of LP in face clustering problem. The algorithm is tested on datasets like ORL,
YALE, Extended YALEB and PIE. Randa Atta and Ghanbar [12] Proposed An Efficient Face
Recognition System Based on Embedded DCT Pyramid. Each face image is decomposed into
non-overlapping blocks of approximation sub bands and a set of reversed L-shape blocks with
high frequency coefficients in the detailed sub bands. Inter dependency among the sub bands are
computed using composite spatial orientation tree of the blocks and efficient coefficients of the
DCT pyramid is selected by Set Partitioning in Hierarchal Trees (SPIHT). These coefficients are
used as the features for the face recognition. Nearest Neighbor and Euclidean distance methods
are used to classify the similar images of the database and test images.
3. PROPOSED MODEL
In this section the face recognition model is discussed based on novel concept of converting many
images of single person into one image and features are extracted using DWT and SVM. The
block diagram of the model is shown in Figure 1.
3.1 Face Databases
The various databases such as ORL, JAFFE, Indian Male, Indian Female and L-speck are used to
test the model for performance analysis.
3.1.1 Olivetti Research Laboratory (ORL) [13]
The database has forty persons with ten images per person i.e., it has four hundred images in total.
The face images are captured with different lighting conditions, facial expressions, timings and
angles, the face image samples of a person are shown in Figure 2, with each image of 92*112.
3.1.2 Japanese Female Facial Expressions (JAFFE) [14]
The database consists of ten persons with twenty images per person i.e., it has two hundred
images in the database. The images are captured based on expressions such as emotional, happy,
disgust, angry, natural movement, surprise etc. Each image is of size 256*256 with grey scale
format. The face image samples are shown in Figure 3.](https://image.slidesharecdn.com/7316sipij04-160708052517/85/COMPRESSION-BASED-FACE-RECOGNITION-USING-DWT-AND-SVM-3-320.jpg)

![Signal & Image Processing : An International Journal (SIPIJ) Vol.7, No.3, June 2016
49
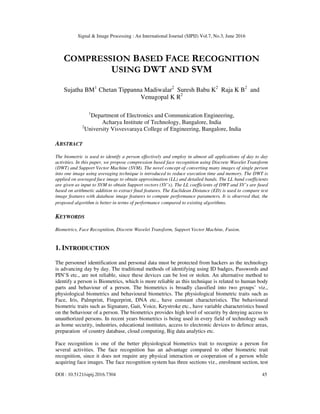
3.1.3 Indian Female [15]
The database has eleven persons with twenty two images per person i.e., it has two hundred forty
images in total. The images of size 640*480 are captured based on facial orientations with
different emotional expressions. The samples of images are shown in Figure 4.
Figure 4. Samples of Indian Female images
3.1.4 Indian Male [15]
The face database has twenty persons with eleven images per persons. The face images are
captured on different orientation angles with various expressions. Each image is of size 640*480
and the face image samples are shown in Figure 5.
Figure 5. Samples of Indian Male images
3.1.5. L-Speck Face Database [16]
The database has one hundred and twenty persons with nineteen images per person ie., it has two
thousand two hundred and eighty images. The database has image size of 320*280 with BMP
format. The images are captured with different expressions of a person. The samples of face
images are shown in the Figure 6.
Figure 6. Samples of L-Speck Face Database images](https://image.slidesharecdn.com/7316sipij04-160708052517/85/COMPRESSION-BASED-FACE-RECOGNITION-USING-DWT-AND-SVM-5-320.jpg)


![Signal & Image Processing : An International Journal (SIPIJ) Vol.7, No.3, June 2016
3.3 Gaussian Filter
The Gaussian smoothing operator is a 2
remove detail noise. The Gaussian filter function is given by equation (3) with mean distribution
of zero.
ܩሺ,ݔ ݕሻ=
ଵ
ଶగఙమ ݁ି ௫మశమ
ଶఙమ
Where, σ is the standard deviation of the distribution.
Gaussian filters are linear low pass filters which masks perfectly simulate optical blur
the details of the image. The degree of the smoothing is controlled by the
smoothing will be more. In the spatial domain the image is multiplied by appropriate kernel but in
the frequency domain an image and a filter function
filtered output in Figure 11.
(a) Original image
3.4 Discrete Wavelet Transform [
The transformation is used to obtain
high frequencies respectively. The DWT divides an image into approx
bands as shown in figure 12. The approximation sub band has significant information of an
image. The detailed sub band has information on horizontal, vertical and diagonal details. The
low pass filters and high pass filters are used to generate approximation and detailed sub bands
respectively. The four sub bands such as LL band formed by low pass filter and lo
LH band formed by low pass and high pass filter, HL band is formed by high pass filter and low
pass filter, HH band is formed by high pass filter and high pass filters.
Signal & Image Processing : An International Journal (SIPIJ) Vol.7, No.3, June 2016
The Gaussian smoothing operator is a 2-D convolution operator i.e., used to blur images and
. The Gaussian filter function is given by equation (3) with mean distribution
is the standard deviation of the distribution.
Gaussian filters are linear low pass filters which masks perfectly simulate optical blur
the details of the image. The degree of the smoothing is controlled by the ࣌,
smoothing will be more. In the spatial domain the image is multiplied by appropriate kernel but in
the frequency domain an image and a filter function are multiplied pixel by pixel to obtain the
a) Original image (b) Gaussian filtered image, ߪ ൌ 2
Figure11. Gaussian filter image
Discrete Wavelet Transform [17]
The transformation is used to obtain frequency resolution and temporal resolution for low and
high frequencies respectively. The DWT divides an image into approximation and detailed sub
The approximation sub band has significant information of an
ed sub band has information on horizontal, vertical and diagonal details. The
low pass filters and high pass filters are used to generate approximation and detailed sub bands
respectively. The four sub bands such as LL band formed by low pass filter and lo
LH band formed by low pass and high pass filter, HL band is formed by high pass filter and low
pass filter, HH band is formed by high pass filter and high pass filters.
Figure 12. One level 2D-DWT
Signal & Image Processing : An International Journal (SIPIJ) Vol.7, No.3, June 2016
52
i.e., used to blur images and
. The Gaussian filter function is given by equation (3) with mean distribution
ሺ3ሻ
Gaussian filters are linear low pass filters which masks perfectly simulate optical blur and remove
larger the ࣌
smoothing will be more. In the spatial domain the image is multiplied by appropriate kernel but in
are multiplied pixel by pixel to obtain the
frequency resolution and temporal resolution for low and
imation and detailed sub
The approximation sub band has significant information of an
ed sub band has information on horizontal, vertical and diagonal details. The
low pass filters and high pass filters are used to generate approximation and detailed sub bands
respectively. The four sub bands such as LL band formed by low pass filter and low pass filter,
LH band formed by low pass and high pass filter, HL band is formed by high pass filter and low](https://image.slidesharecdn.com/7316sipij04-160708052517/85/COMPRESSION-BASED-FACE-RECOGNITION-USING-DWT-AND-SVM-8-320.jpg)
![Signal & Image Processing : An International Journal (SIPIJ) Vol.7, No.3, June 2016
53
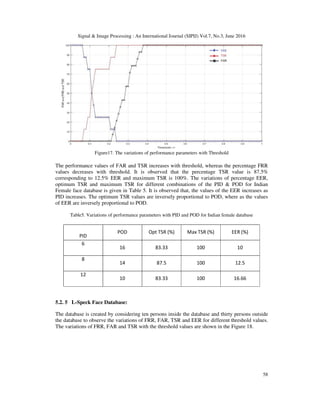
3.5 Support Vector Machine [18]
It is used to find the position of the feature vectors, image compression and to classify the data.
The support vectors are the data points located near to the hyper-plane shown in figure 13.
Figure13. SVM classification
The classifier divides into two groups using hyper-plane as class 1 and class 2 i.e., plus plane is
X: W.X+b= 1and minus plane is X: W.X+b= -1. Where the W is the weight vector and it is
perpendicular to the hyper-plane, X is the feature vector and b is the position of the feature vector.
The proposed method uses SVM for data compression. The support vectors of LL band
coefficients are considered and fused with LL band coefficients to derive final features.
3.6 Euclidean-Distance
The final features of test images are compared with final features of images in the data base using
Euclidian Distance (ED) to identify a person using equation (4).
E D = ට ሺPi − qi ሻ2
ெ
ୀଵ
------------------------------------------------------------ - (4)
Where, M = No of coefficients in a vector.
Pi = Coefficients values of vectors in database.
qi = Coefficient values of vectors in test image
4. ALGORITHM
Problem Definition: The novel face recognition algorithm is developed based on compression of
spatial domain images and final features are generated using fusion of LL band co-efficients of
DWT and Support Vectors of LL band to save memory and execution time. The algorithm is as
shown in Table 1.
Objectives: The face recognition is used
(i) To identify a person effectively.
(ii) To reduce errors viz., FRR, FAR and EER.
(iii) To increase the value of TSR.](https://image.slidesharecdn.com/7316sipij04-160708052517/85/COMPRESSION-BASED-FACE-RECOGNITION-USING-DWT-AND-SVM-9-320.jpg)


![Signal & Image Processing : An International Journal (SIPIJ) Vol.7, No.3, June 2016
59
Figure18. The variations of performance parameters with threshold
The performance values of FAR and TSR increases with threshold, whereas the percentage FRR
values decreases with threshold. It is observed that the percentage TSR value is 100%
corresponding to 0% EER and maximum TSR is 100%. The variations of percentage EER,
optimum TSR and maximum TSR for different combinations of the PID & POD for L-Speck face
database is given in Table 6. It is observed that, the values of the optimum TSR decreases and
EER increases as PID increases. The optimum TSR values are directly proportion to POD,
whereas the values of EER are inversely proportional to POD.
Table 6.Variations of performance parameters with PID and POD for L-Speck database
PID POD Opt TSR (%) Max TSR (%) EER (%)
10 40 100 100 0
20 30 90 95 0.066
30 20 90 93.33 0.08
5.3 Comparison of Proposed algorithm with Existing algorithms for ORL Face
database
The performance parameters viz., optimum TSR and maximum TSR of the proposed method is
compared with existing methods presented by D Murugan et al.,[19] Pallavi D.Wadkar et al.,[20]
and Sujatha B M et al.,[21] is shown in Table 7. It is observed that the values of the optimum
TSR and maximum TSR values are high in the case of proposed algorithm compared to existing
algorithms. The proposed algorithm is superior compared to existing algorithms for the following
reasons.](https://image.slidesharecdn.com/7316sipij04-160708052517/85/COMPRESSION-BASED-FACE-RECOGNITION-USING-DWT-AND-SVM-15-320.jpg)
![Signal & Image Processing : An International Journal (SIPIJ) Vol.7, No.3, June 2016
60
(i) The novel concept of converting many images per person into single image using averaging
technique.
(ii)The SVM is applied on LL band of DWT and the support vectors (SV’s) are considered.
(iii)The LL band coefficients are fused with SV’s to generate final feature set.
(iv)The algorithm is very useful as the images are compressed based on Image averaging
technique, DWT and SVM.
Table 7. Comparison of performance parameters of proposed method with existing methods
SL. No. Authors Technique used Opt TSR(%) Max TSR (%)
1 D Murugan et al [19]., Gabor filter+DWT 84.8 92
2 Pallavi D.Wadkar et al [20]., DWT 82.85 90
3 Sujatha B M et al [21]., DWT+FFT+CLBP 80 93.33
4 Proposed Model DWT+SVM 90 100
6. CONCLUSION
Face recognition is an effective biometric to identify a person. In this paper, we proposed
compression based face recognition using DWT and SVM. Many images of a person are
compressed to one image per person using averaging technique. The DWT is applied on face
images to compress it by considering only approximation i.e., LL band only. The LL band
coefficients are applied to SVM to generate SV’s. The LL band coefficients and SV’s are fused to
derive final features. The ED is used to compare database features with test image features to test
the performance of an algorithm. It is observed that, the performance of the proposed method is
better compared to existing methods. In future, the algorithm can be implemented using hardware.
REFERENCES
[1] Thai Hoang Le and Len Bui “Face Recognition based on SVM and 2DPCA” International Journal
of signal processing, Image processing and Pattern Recognition, Vol. 4, No. 3, September, 2011
[2] Saeid Fazli, Siroos Toofan, and Zahra Mehrara,“JPEG2000 Image Compression using SVM and
DWT”, International Journal of Science and Engineering Investigations, vol. 1, pp. 54-57, issue 3,
April 2012.
[3] Harin Sellahewa and Sabah A. Jassim, “Image-Quality-Based Adaptive Face Recognition”, IEEE
Transactions on Instrumentation and Measurements, Vol. 59, No. 4, pp. 805-813. April 2010.
[4] Vinoda Yaragatti and Bhaskar B, “Face Recognition using Neural Networks”, International Journal of
Electrical, Electronics Engineering and Telecommunications, Vol. 3, pp. 123-130, No. 3, July 2014.](https://image.slidesharecdn.com/7316sipij04-160708052517/85/COMPRESSION-BASED-FACE-RECOGNITION-USING-DWT-AND-SVM-16-320.jpg)
![Signal & Image Processing : An International Journal (SIPIJ) Vol.7, No.3, June 2016
61
[5] Idan Ram, Israel Cohen, and Michael Elad, “Facial Image Compression using Patch-Ordering Based
Adaptive Wavelet Transform”, IEEE Transaction on Signal Processing, Vol. 21, No. 10, pp. 1270-
1274, October 2014.
[6] S. Grgic and M. Grgic, “Performance of Image Compression using Wavelet”, IEEE Transaction on
Industrial Electronics, Vol. 48, No. 3, pp. 682-695, June 2001.
[7] Michael Elad, Roman Goldenberg, and Ron Kimmel, “Low Bit-Rate Compression of Facial Images”,
IEEE Transaction on Image Processing, Vol. 16, No. 9, pp. 2379-2383, September 2007.
[8] Kai Dong-Hyuk Shin, Rae-Hong Park, Seungjoon Yang and Jae-Han Jung, “Block-Based Noise
Estimation using Adaptive Gaussian Filtering”, IEEE Transactions on Consumer Electronics, Vol. 51,
No. 1, pp. 218-226, February 2005.
[9] Munawar Hayat, Mohammad Bennamoun and Senjian An, ” Deep Reconstruction Models for Image
Set Classification “, IEEE Transactions on Pattern analysis and Machine Intelligence, pp.1-15, April
2014.
[10] Zhao-Rong Lai, Dao-Qing Dai, Chuan-Xian Ren and Ke-Kun Huang ” Discriminative and Compact
Coding for Robust Face Recognition” IEEE Transaction on Cybernetics, Vol. 45, No.9, pp.1900-
1912, September 2015.
[11] Xiaobing Pei, Zehua Lyu, Changqing Chen and Chuanbo Chen “Manifold Adaptive Label
Propagation for Face Clustering” IEEE Transactions on Cybernetics, Vol. 45, No.8, pp. 1681-1691,
August 2015
[12] R. Atta and M. Ghanbar, “An Efficient Face Recognition System Based on Embedded DCT
Pyramid”, IEEE Transactions on Consumer Electronics, Vol. 58, No.4, pp.1285-1293, November
2012.
[13] ORL database, http://www.camrol.co.uk
[14] Jaffe Database, http://www.kasrl.org/jaffe_download.html.
[15] Indian Face Database, http://viswww.cs.umass.edu/~vidit/Indian Face Database.
[16] L-spacek databasehttp://cswww.essex.ac.uk/mv/allfaces
[17] Satish Bhairannawar, SayatamSarkar, Anand Y R, Raja K B and Venugopal K R, “An EfficientVLSI
Architecture for Fingerprint Recognition using O2D-DWT architecture and Modified CORDIC-
FFT”, IEEE International Conference on Signal Processing, Informatics Communication and Energy
Systems, pp. 1-5, Calicut (NITC), 2015.
[18] Christopher J.C. Burges, “A Tutorial on Support Vector Machines for Pattern Recognition”, Kluwer
Academic Publishers, pp. 1-43, 1998
[19] D Murugan, S Arumugam, K Rajalakshmi and Manish T, “Performance Evaluation of Face
Recognition using Gabor Filter, Log Gabor filter and Discrete Wavelet Transform,” International
Journal of computer science and Information Technology, vol. 2, No.1, pp. 125-133, 2010.
[20] Pallavi D.Wadkar and Megha Wankhade, “Face Recognition using Discrete Wavelet Transforms,”
International Journal of Advanced Engineering Technology, vol. 3, pp. 239-242, 2012.
[21] Sujatha B M, K Suresh Babu, K B Raja, Venugopal K R, “Hybrid Domain based Face Recognition
using DWT, FFT and Compressed CLBP” International Journal of Image processing (IJIP), Volume
(9) , Issue (5) , pp. 283-303, 2015.](https://image.slidesharecdn.com/7316sipij04-160708052517/85/COMPRESSION-BASED-FACE-RECOGNITION-USING-DWT-AND-SVM-17-320.jpg)


This paper presents a compression-based face recognition system using Discrete Wavelet Transform (DWT) and Support Vector Machine (SVM). The novel methodology involves averaging multiple images of a single person into one to enhance efficiency before applying DWT and SVM for feature extraction. The proposed algorithm demonstrates superior performance compared to existing face recognition techniques, ensuring enhanced security through biometric identification.