The paper presents a method for classifying blur types in images, specifically motion, defocus, and combined blur, utilizing curvelet transform features and a feed-forward neural network for classification. The approach addresses the challenge of identifying blur types accurately before applying blind restoration techniques. Experimental results validate the effectiveness of the proposed method using barcode image databases.
![Indonesian Journal of Electrical Engineering and Informatics (IJEEI)
Vol. 5, No. 2, June 2017, pp. 162~173
ISSN: 2089-3272, DOI: 10.11591/ijeei.v5i2.270 162
Received Dec 6, 2016; Revised April 21, 2017; Accepted May 7, 2017
A Pattern Classification Based Approach for Blur
Classification
Shamik Tiwari
CET, Mody University of Science & Technology, Lakshmangarh
e-mail: shamiktiwari@hotmail.com
Abstract
Blur type identification is one of the most crucial steps of image restoration. In case of blind
restoration of such images, it is generally assumed that the blur type is known prior to restoration of such
images. However, it is not practical in real applications. So, blur type identification is extremely desirable
before application of blind restoration technique to restore a blurred image. An approach to categorize blur
in three classes namely motion, defocus, and combined blur is presented in this paper. Curvelet transform
based energy features are utilized as features of blur patterns and a neural network is designed for
classification. The simulation results show preciseness of proposed approach.
Keywords: Blur, Motion, Defocus, Curvelet Transform, Neural Network.
1. Introduction
Barcoding is one of the automatic identification and data collection (AIDC) technology
which reduces human involvement in data entry and collection and in that way also dropping
error and time in the process. These days, a wide range of general purpose hand-held devices,
such as mobile phones, come with an optical imaging system. Enabling these general purpose
hand-held devices with the capability to recognize barcodes is a cost-effective alternative to
conventional barcode scanners [1, 2]. The availability of imaging phones provides people a
mobile platform for decoding barcode rather than the use of the conventional scanner which has
lack of mobility.
Unfortunately, sometimes the deprived quality of the images taken by digital cameras
makes it difficult to correctly decode barcodes. Barcode images are usually prone to number of
degradations. Image blurring is often a major factor influencing the performance of a barcode
recognition system. Image blurring is usually inevitable in a camera-based imaging system,
especially in the case of the camera that does not have auto focus or macro mode [3,4].
Although some high-end camera phones which integrate a high resolution and auto
focus/macro mode are available, the low-end camera phone user segment is still huge.
The objective of image restoration approach is to recover a true image from a degraded
version. This problem can be stated as blind or non-blind depending upon whether blur
parameters are known prior to the restoration process. Blind restoration deals with parameter
identification before deconvolution. Though there exists multiple blind restorations techniques
but blur type recognition is extremely desirable before application of any blur parameters
estimation approach [5].
While most previous work focuses on image deblurring, not as much research has been
done on blur classification, which is more practical because the type of blurs is usually unknown
in images. Based on the descriptor of blurs, there are a few blur classification methods.
Multilayer neural network is a neural network, which is based on the multi valued neurons
(MLMVN) with traditional feed forward architecture. The MLMVN is used by Aizenberg et al. [6]
to identify types of the blur, whose precise identification is essential for the image deblurring.
Chong et al. [7] have proposed a scheme that simultaneously detects and identifies blur. This
method is based on the analysis of extrema values in an image. The extrema of histograms are
first identified then analyzed in order to extract feature values in this method. Liu et al. [8] have
offered a framework for partial blur detection and classification i.e. whether some portion of the
image is blurred as well as what type of blur arises. They considered maximum saturation of
color, gradient histogram span and spectrum details as blur features. Aizenberg et al. [9]
presented a work which identifies blur type, estimates blur parameters and perform image](https://image.slidesharecdn.com/0930mar176dec16270barcodeblurclassifcationedit-171224135223/85/A-Pattern-Classification-Based-approach-for-Blur-Classification-1-320.jpg)
![Indonesian Journal of Electrical Engineering and Informatics (IJEEI)
Vol. 5, No. 2, June 2017, pp. 162~173
ISSN: 2089-3272, DOI: 10.11591/ijeei.v5i2.270 162
Received Dec 6, 2016; Revised April 21, 2017; Accepted May 7, 2017
A Pattern Classification Based Approach for Blur
Classification
Shamik Tiwari
CET, Mody University of Science & Technology, Lakshmangarh
e-mail: shamiktiwari@hotmail.com
Abstract
Blur type identification is one of the most crucial steps of image restoration. In case of blind
restoration of such images, it is generally assumed that the blur type is known prior to restoration of such
images. However, it is not practical in real applications. So, blur type identification is extremely desirable
before application of blind restoration technique to restore a blurred image. An approach to categorize blur
in three classes namely motion, defocus, and combined blur is presented in this paper. Curvelet transform
based energy features are utilized as features of blur patterns and a neural network is designed for
classification. The simulation results show preciseness of proposed approach.
Keywords: Blur, Motion, Defocus, Curvelet Transform, Neural Network.
1. Introduction
Barcoding is one of the automatic identification and data collection (AIDC) technology
which reduces human involvement in data entry and collection and in that way also dropping
error and time in the process. These days, a wide range of general purpose hand-held devices,
such as mobile phones, come with an optical imaging system. Enabling these general purpose
hand-held devices with the capability to recognize barcodes is a cost-effective alternative to
conventional barcode scanners [1, 2]. The availability of imaging phones provides people a
mobile platform for decoding barcode rather than the use of the conventional scanner which has
lack of mobility.
Unfortunately, sometimes the deprived quality of the images taken by digital cameras
makes it difficult to correctly decode barcodes. Barcode images are usually prone to number of
degradations. Image blurring is often a major factor influencing the performance of a barcode
recognition system. Image blurring is usually inevitable in a camera-based imaging system,
especially in the case of the camera that does not have auto focus or macro mode [3,4].
Although some high-end camera phones which integrate a high resolution and auto
focus/macro mode are available, the low-end camera phone user segment is still huge.
The objective of image restoration approach is to recover a true image from a degraded
version. This problem can be stated as blind or non-blind depending upon whether blur
parameters are known prior to the restoration process. Blind restoration deals with parameter
identification before deconvolution. Though there exists multiple blind restorations techniques
but blur type recognition is extremely desirable before application of any blur parameters
estimation approach [5].
While most previous work focuses on image deblurring, not as much research has been
done on blur classification, which is more practical because the type of blurs is usually unknown
in images. Based on the descriptor of blurs, there are a few blur classification methods.
Multilayer neural network is a neural network, which is based on the multi valued neurons
(MLMVN) with traditional feed forward architecture. The MLMVN is used by Aizenberg et al. [6]
to identify types of the blur, whose precise identification is essential for the image deblurring.
Chong et al. [7] have proposed a scheme that simultaneously detects and identifies blur. This
method is based on the analysis of extrema values in an image. The extrema of histograms are
first identified then analyzed in order to extract feature values in this method. Liu et al. [8] have
offered a framework for partial blur detection and classification i.e. whether some portion of the
image is blurred as well as what type of blur arises. They considered maximum saturation of
color, gradient histogram span and spectrum details as blur features. Aizenberg et al. [9]
presented a work which identifies blur type, estimates blur parameters and perform image](https://image.slidesharecdn.com/0930mar176dec16270barcodeblurclassifcationedit-171224135223/75/A-Pattern-Classification-Based-approach-for-Blur-Classification-1-2048.jpg)
![IJEEI ISSN: 2089-3272
A Pattern Classification Based approach for Blur Classification (Shamik Tiwari)
163
restoration using neural network. They considered four kinds of blur namely rectangular, motion,
defocus, and Gaussian blurs as a pattern classification problem. Yan et al. [10] made an
attempt to find a general feature extractor for common blur kernels with various parameters,
which is closer to realistic application scenarios and applied deep belief neural networks for
discriminative learning. In this method Fourier spectrum of blurred images is passed to the
neural network as input. However, utilizing spectrum as an input is not a good idea due to large
size of feature set. In the paper [11], Tiwari et al. use statistical features of blur patterns in
frequency domain and identified blur type with the use of feed forward neural network. Tiwari et
al. [12] used wavelet features for blur type recognition utilizing a neural network.
Curvelet features have been extensively used in object and texture classification.
However, we have not found any application of curvelet features for blur classification. In this
paper we extract curvelet features of blur patterns in frequency domain and use feed forward
neural network for blur classification. This paper is organized into seven sections including the
present section. In section two to four, we discuss the theory of image degradation model,
curvelet transform and feed forward neural network in that order. Section five describes the
methodology of blur classification scheme. Section six discusses experimental results and in the
final section seven, conclusion is presented.
2. Image Degradation Model
The image degradation process of an image can be modelled as the following
convolution process [12].
( ) ( ) ( ) ( ) ( )
where ( ) is the degraded image, ( ) is the uncorrupted original image, ( ) is the point
spread function that caused the degradation and ( ) is the additive noise in spatial domain.
In view of the fact that, convolution operations used in spatial domain is equivalent to the
multiplication in frequency domain, so image degradation model is
( ) ( ) ( ) ( ) ( )
Motion blur occurs in an image due to relative motion between image capturing device
and the object. Let the image to be acquired has a relative motion to the capturing device by a
regular velocity (vrelative) and makes an angle of α radians with the horizontal axis for the
duration of the exposure interval [0, texposure], the distortion is one dimensional. Expressing
motion length as the point spread function (PSF) for uniform motion blur
can be modeled as [12]:
( ) {
√
(3)
The defocus blur also known as out of focus blur is appears due to a system of circular
aperture. It can be modeled as a uniform disk as [13]:
( ) {
√
(4)
where R defines the radius of the disk.
Sometimes image contains co-existence of both blurs. In that case the blur model
becomes [14]:
( ) ( ) ( ) ( )
where ( ), ( ) are point spread functions for motion and defocus blur respectively and
is the convolution operator. The degradation process model equations (1) and (2) can be
expressed as (6) and (7) in spatial and frequency domain respectively:](https://image.slidesharecdn.com/0930mar176dec16270barcodeblurclassifcationedit-171224135223/85/A-Pattern-Classification-Based-approach-for-Blur-Classification-2-320.jpg)
![ ISSN: 2089-3272
IJEEI Vol. 5, No. 2, June 2017 : 162 – 173
164
( ) ( ) ( ) ( ) ( ) ( )
( ) ( ) ( ) ( ) ( ) ( )
3. Discrete Curvelet Transform
Curvelet Transform by Candes and Donoho [15, 16] was designed to overcome the
inherent limitations of traditional multiscale transforms like wavelet. Curvelet transform is a
multi-scale and multi-directional transform with needle shaped basis functions. Basis functions
of wavelet transform are isotropic and thus it requires large number of coefficients to represent
the curve singularities. Curvelet transform basis functions are needle shaped and have high
directional sensitivity and anisotropy. Curvelets obey parabolic scaling.The curvelet has a
frequency support in a parabolic wedge area due to the anisotropic scaling law as width =
length2.
The fast discrete curvelet transform was introduced by Candes et al. [17] in two forms,
the wrapping version and the unequally spaced FFT (USFFT) version. Since the wrapping
version is faster and invertible up to numerical precision, while the USFFT version is only
approximately invertible, we use only the wrapping version throughout this paper. The two
dimensional curvelet transform is given by
( ) ∑ ∑ [ ] [ ] ( )
where [ ] is the input 2-D image. ( ) are the discrete curvelet
coefficients, [ ] is the curvelet basis function at scale , orientation [ ]and location
[ ].
4. Feed Forward Neural Network
A successful pattern identification method depends significantly on the particular
selection of the classifier. An artificial neural network (ANN) is a system which can be seen as
an information-processing paradigm. ANN has been designed as generalizations of
mathematical models identical to human recognition system. They are collection of
interconnected processing units called neurons that perform as a unit. It can be used to
determine complex relationships among inputs and outputs by recognizing patterns in data. The
feed forward neural network refers to the neural network which contains a set of source nodes
which forms the input layer, one or more than one hidden layers, and single output layer. In
case of feed forward neural network input signals propagate in one direction only; from input to
output. There is no feedback path i.e. the output of one layer does not influence same layer.
One of the best known and broadly acceptable learning algorithms in training of multilayer feed
forward neural networks is Back-Propagation [18]. The back propagation is a type of supervised
learning algorithm, which means that it receives sample of the inputs and associated outputs to
train the network, and then the error (difference between real and expected results) is calculated
[19]. The idea of the back propagation algorithm is to minimize this error, until the neural
network learns the training data. This can be implemented by:
)()()1( nwOnw jipjpjji
(9)
where
is the learning rate, α is the momentum, pj
is the error and n is the number of
iteration.
5. Blur Classification Approach
Blur type can be identified in frequency domain notably. The motion blur, defocus blur
are appeared differently in frequency domain, and the blur categorization can be easily done
using these specific patterns. The frequency spectrum of motion blurred image has dominant](https://image.slidesharecdn.com/0930mar176dec16270barcodeblurclassifcationedit-171224135223/85/A-Pattern-Classification-Based-approach-for-Blur-Classification-3-320.jpg)
![IJEEI ISSN: 2089-3272
A Pattern Classification Based approach for Blur Classification (Shamik Tiwari)
165
dark parallel lines, which are orthogonal to the motion orientation with near zero values. On the
other hand, In case of defocus blur one can see appearance of some circular zero crossing
patterns and in case of coexistence of both blurs combined effect of both blurs become visible.
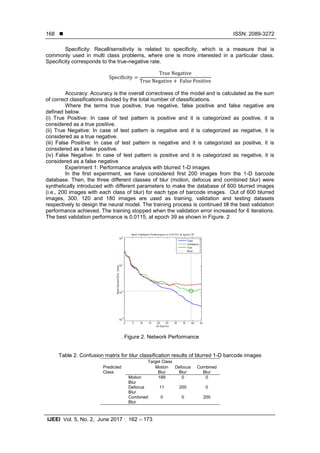
Figure 1 shows the effect of different blurs on the Fourier spectrum of original image. We can
consider these patterns in frequency domain as image itself for blur classification.
(a) (b) (c)
(d) (e) (f)
Figure 1(a) Original image containing QR code [18] (b) Motion blurred image
(c) Fourier spectrum of original image (d) Fourier spectrum of blurred image with motion
length 10 pixels and motion orientation 450 (e) Fourier spectrum of blurred image with defocus
blur of radius 5 and (f) Fourier spectrum of image with coexistence of both blurs
Main steps of the blur classification method are: image preprocessing, find logarithmic
frequency spectrum, feature extraction of blur patterns, designing of neural network classifier
system and result analysis.
In the initial step, we perform preprocessing on blurred images. Then we find the
logarithmic frequency spectrum of blurred and non blurred image to get the blur patterns. Once
the blur patterns acquired, the curvelet energy features have been calculated to prepare the
training and testing database. Finally with this feature database training and testing are
performed by using feed forward back propagation neural network.
5.1. Preprocessing
Blur classification requires a number of preprocessing steps. First, the color image
obtained by the digital camera is changed into an 8-bit grayscale image by averaging the color
channels.
The periodic transitions at the boundaries of an image often lead to high frequencies,
which are transformed into visible vertical and horizontal lines in the power spectrum. Since,
these lines may divert from or even superpose the stripes caused by the blur, they have to be
detached by applying a windowing function before transformation. The Hanning window gives a
fine trade-off between forming a smooth transition towards the image borders and keeping](https://image.slidesharecdn.com/0930mar176dec16270barcodeblurclassifcationedit-171224135223/85/A-Pattern-Classification-Based-approach-for-Blur-Classification-4-320.jpg)
![ ISSN: 2089-3272
IJEEI Vol. 5, No. 2, June 2017 : 162 – 173
166
adequate image information in power spectrum. A 2-D Hann window of size N X M defined as
the product of two 1-D Hann windows:
[ ] ( [ ]) ( [ ]) (10)
After that step, the windowed image is transformed to the frequency domain using
Fourier transform. Then, the power spectrum is achieved. However, as the coefficients of the
spectrum decrease rapidly from its centre to the borders, it is difficult to identify local differences
significantly. This fast drop off is reduced by considering the logarithm of the power spectrum. In
order to obtain a centered version of the spectrum, its quadrants have to be swapped
diagonally. A centered portion of size 256 X 256 is cropped to perform feature extraction, in
view of the fact that the significant features are around the centre of the spectrum,
5.2. Feature Extraction
Wrapping based discrete curvelet transform using Curvelab-2.1.2 is applied to a power
spectrum of barcode image to obtain its coefficients. These coefficients are then used to form
the features of blur patterns. After achieving the curvelet coefficients the mean and standard
deviation of the coefficients related with each subband is calculated at the coarsest and the
finest scale independently. The mean of a subband at scale and orientation is calculated as:
( )
( )
where is the size and ( ) is the energy of curvelet transformed image respectively at
scale and orientation Energy is calculated by the sum of absolute values of curvelet
coefficients.
( ) ∑ ∑| ( )| ( )
The standard deviation of a subband at can be shown as:
√∑ ∑ (| ( )| )
(13)
We have used 3 level discrete curvelet decomposition. Table 1 shows the subbands
division at each level of transform.
Table 1. Curvelet transform with 3 levels
Scale 1 2 3
Total No. of subbands 1 16 32
Only first half of the total subbands at a scale are considered for feature calculation
because in the frequency domain the curvelet at angle produces the similar coefficients as the
curvelet at angle ( ). Based on the subband division in table 1, (1+8+16) = 25 subbands of
curvelet coefficients are selected for calculation of mean and standard deviation. All these
features are arranged in a manner such that the standard deviations remain in the first half of
the feature vector and the means are arranged into the second half of the feature vector. So, we
obtain a feature vector consists of mean energies and standard deviations ( ) for
each of the power spectrum. Where first twenty five values are standard deviation and others
are mean energies. We use this feature vector to classify blur patterns](https://image.slidesharecdn.com/0930mar176dec16270barcodeblurclassifcationedit-171224135223/85/A-Pattern-Classification-Based-approach-for-Blur-Classification-5-320.jpg)
![IJEEI ISSN: 2089-3272
A Pattern Classification Based approach for Blur Classification (Shamik Tiwari)
167
6. Simulation Results
The performance of the proposed technique has been evaluated using camera based
barcode images. To simulate the blur classification algorithm, we have considered two different
barcode image databases. The first database WWU Muenster Barcode Database [20]
consisting of 1-D barcode images and the second one is the Brno Institute of Technology QR
code image database [21] captured by digital camera. This complete work is implemented using
neural network and image processing toolbox of Matlab 6.5.
Most of pattern recognition problems are too complex to be solved completely by non
automated algorithms, machine learning has always played a crucial role in this area. The
conventional way of identification is to split the recognizer into a feature extractor, and a
classifier. One of the main achievements of the neural network is to offer complex mapping in
high-dimensional spaces without requiring complicated hand-crafted features. This allows
designers to rely more on learning, and less on detailed engineering of feature extractors.
These features of neural network enforced to use as a classification tool in this work.
The classification is achieved using a feed forward neural network containing single
hidden layer fifty neurons. Back propagation is pertained as network training principle, where
the training dataset is designed by the extracted features of the blur patterns. The whole
training and testing features set is normalized into the range of [0, 1], whereas the output class
is assigned to zero for the lowest probability and one for the highest. In this work the transfer
functions of hidden layers are hyperbolic tangent sigmoid functions. The numbers of neurons
used in input layer are equal to the extracted features from image dataset which are fifty. The
neural classifier is trained with different number of hidden layers. The final architecture is
selected with single hidden layer of fifty neurons which gives best performance.
To design the neural network, the data is divided into training, validation and test sets in
a ratio of 50:20:30 respectively. Neural networks are known to be prone to overfitting, and
hence not performing well on previously-unseen data. In order to reduce the risk of overfitting, a
validation dataset was used to test each network periodically during training. When the
validation set error began to rise, training was terminated. Only at that point the network was
tested with the test data set in order to calculate the final accuracy. Three different partition sets
were created using random partition. Partitions satisfied cross-validation, meaning that each
target class (i.e. blur) was represented the same number of times in the training set, the same
number of times in the validation set and the same number of times in the test set. For each
partition, every pattern appeared in exactly one of the training, validation or test sets. Finally,
we used overall classification results to evaluate the blur classification model.
When referring to the performance of a classification model, we are interested in the
model’s ability to correctly predict or separate the classes. When looking at the errors made by
a classification model, the confusion matrix gives the full picture. In confusion matrix, the
diagonal cells show the number of instances that were correctly classified for each structural
class. The off-diagonal cells show the number of instances that were misclassified. To assess
the blur classification model, we have shown confusion matrix and used the four statistical
metrics as specified below.
Precision (Positive Predictive Value): Precision measures the fraction of samples that
truly turns out to be positive in the group the classifier has categorized as a positive class. The
higher the precision is, the lower the number of false positive errors committed by the classifier.
Sensitivity (Recall): It measures the actual members of the class which are accurately
recognized as such. It is also referred as true positive rate (TPR). It is defined as the fraction of
positive samples categorized accurately by the classification model. High sensitivity value
represents that low number of positive samples misclassified as the negative class.](https://image.slidesharecdn.com/0930mar176dec16270barcodeblurclassifcationedit-171224135223/85/A-Pattern-Classification-Based-approach-for-Blur-Classification-6-320.jpg)
![ ISSN: 2089-3272
IJEEI Vol. 5, No. 2, June 2017 : 162 – 173
172
Table 9. Blur Classification results for blurred and noisy 2-D barcode images
Blur Type Precision Recall Specificity
Motion Blur 95.1 98.0 97.5
Defocus Blur 96.4 92.5 98.3
Combined Blur 97.5 98.5 98.7
Accuracy 96.3
In Table 10 results of proposed method are also compared with another method which
uses statistical features for blur classification. It is obvious that proposed method gives better
results in comparison to this method.
Table 10. A comparison of blur classification results
Experiment Data Sets Statistical features based
method [12]
Proposed method using
curvelet energy features
1-D blurred images 96.7 98.2
1-D blurred and noisy images 95.0 94.2
2-D blurred images 98.0 98.7
2-D blurred and noisy images 95.2 96.3
7. Conclusion
In this paper, we have proposed a new blur classification scheme for barcode images
taken by digital cameras. The scheme makes use of the ability of curvelet features to
discriminate blur patterns appear in frequency spectrum of blurred images. This work identifies
blur type, which can further help to choose the appropriate blur parameter estimation approach
for blind restoration of barcode images. We have also show that in presence of low level noise,
performance of blur classification system is precise. The limitation of this method is that
presence of high level of noise causes disappearance of blur patterns in frequency spectrum,
which cause the poor performance. Further work extension can be made to improve the
performance of the classifier system with the high level of noise by incorporating the noise
filtering techniques.
Acknowledgment
We highly appreciate College of Engineering and Technology, Mody University of
Science & Technology, Lakashmangarh for providing facility to carry out this research work.
References
[1] Kato H, Tan KT. Pervasive 2D barcodes for camera phone applications. IEEE Pervasive Computing.
2007; 6(4): 76–85.
[2] Yang H, Alex C, Jiang X. Barization of low-quality barcode images captured by mobile phones using
local window of adaptive location and size. IEEE Trans. on Image Processing. 2012; 21(1): 418–425.
[3] Joseph E, Pavlidis T. Bar code waveform recognition using peak locations. Pattern Analysis and
Machine Intelligence. IEEE Transactions on. 1994; 16(6): 630-640.
[4] Selim E. Blind deconvolution of barcode signals. Inverse Prob. 2004; 20(1): 121– 135.
[5] Tiwari S, Shukla VP, Biradar SR, Singh AK. Review of motion blur estimation techniques. J Image
Graph. 2013; 1(4): 176-184.
[6] Aizenberg I, Aizenberg N, Bregin T, Butakov C, Farberov E, Merzlyakov N, and Milukova O. Blur
Recognition on the Neural Network based on Multi-Valued Neurons. Journal of Image and Graphics.
2000; 5: 127-130.
[7] Chong RM, Tanaka T. Image extrema analysis and blur detection with identification. IEEE
International Conference on Signal Image Technology and Internet Based Systems. 2008: 320-326.
[8] Liu R, Li Z, Jia J. Image partial blur detection and classification. In Proc. CVPR. 2008: 23–28.
[9] Aizenberg I, Paliy DV, Zurada JM, Astola JT. Blur identification by multilayer neural network based
on multivalued neurons. IEEE Transactions on Neural Networks. 2008; 19(5): 883-898.
[10] Yan R, Shao L. Image Blur classification and parameter identification using two-stage deep belief
networks. British Machine Vision Conference (BMVC), Bristol, UK. 2013: 1-11.](https://image.slidesharecdn.com/0930mar176dec16270barcodeblurclassifcationedit-171224135223/85/A-Pattern-Classification-Based-approach-for-Blur-Classification-11-320.jpg)
![IJEEI ISSN: 2089-3272
A Pattern Classification Based approach for Blur Classification (Shamik Tiwari)
173
[11] Tiwari S, Shukla VP, Sangappa Biradar AS. Texture Features based Blur Classification in Barcode
Images. 2013.
[12] Tiwari S, Shukla VP, Biradar SR, Singh AK. Blur Classification Using Wavelet Transform and Feed
Forward Neural Network. International Journal of Modern Education and Computer Science
(IJMECS). 2014; 6(4): 16.
[13] Tiwari S, Shukla VP, Biradar SR, Singh AK. Blind Restoration of Motion Blurred Barcode Images
using Ridgelet Transform and Radial Basis Function Neural Network. Electronic Letters on Computer
Vision and Image Analysis. 2014; 13(3): 63-80.
[14] Tiwari S, Shukla VP, Biradar SR, Singh AK. Defocus Blur Parameter Estimation in Barcode Images
using Fast Discrete Curvelet Transform. International Journal of Tomography & Simulation™. 2014;
27(3): 35-46.
[15] Tiwari S, Shukla VP, Biradar SR, Singh AK. Blur parameters identification for simultaneous defocus
and motion blur. CSI Transactions on ICT: 1-12.
[16] Candes EJ, Donoho DL. Curvelets. Manuscript. http://www.stat.stanford.edu/
∼donoho/Reports/1998/curvelets.zip. 1999.
[17] Candes EJ, Demanet L, Donoho DL, Ying L. Fast discrete curvelet transform. Technical report,
CalTech. 2005.
[18] Candès E, Demanet L, Donoho DL, Ying L. CurveLab-2.1. 2.2008-08-15. http://www.curvelet.org.
2008.
[19] Vasumathi G, P Subashini. Pixel Classification of SAR ice images using ANFIS-PSO
Classifier. Indonesian Journal of Electrical Engineering and Informatics (IJEEI) 4.4. 2016.
[20] Azriyenni A, Mustafa MW, Sukma DY, Dame ME. 2014. Backpropagation Neural Network Modeling
for Fault Location in Transmission Line 150 kV. Indonesian Journal of Electrical Engineering and
Informatics; 2(1): 1-12.
[21] Wachenfeld S, Terlunen S, Jiang X. 1-D barcode image database. http://cvpr.uni-muenster.de/
research/barcode. 2008.
[22] Szentandrási I, Dubská M, and Herout A. Fast detection and recognition of QR codes in high-
resolution images. Graph@FIT, Brno Institute of Technology. 2012.](https://image.slidesharecdn.com/0930mar176dec16270barcodeblurclassifcationedit-171224135223/85/A-Pattern-Classification-Based-approach-for-Blur-Classification-12-320.jpg)


![4.[23 28]image denoising using digital image curvelet](https://cdn.slidesharecdn.com/ss_thumbnails/4-23-28imagedenoisingusingdigitalimagecurvelet-111125091148-phpapp02-thumbnail.jpg?width=640&height=640&fit=bounds)
![4.[23 28]image denoising using digital image curvelet](https://cdn.slidesharecdn.com/ss_thumbnails/4-23-28imagedenoisingusingdigitalimagecurvelet-111203185018-phpapp02-thumbnail.jpg?width=640&height=640&fit=bounds)