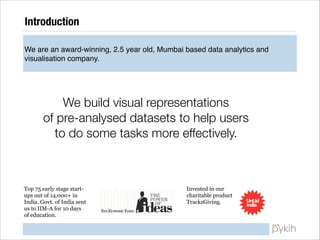
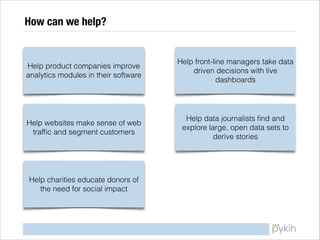
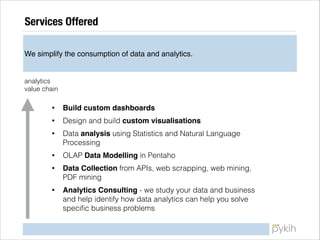
SlideShare a Scribd company logo
Data Visualisation

We simplify the consumption of data and analytics.

Ritvvij Parrikh,
Founder, www.pykih.com
!1
Introduction
We are an award-winning, 2.5 year old, Mumbai based data analytics and
visualisation company.

We build visual representations
of pre-analysed datasets to help users
to do some tasks more effectively.

Top 75 early stage startups out of 14,000+ in
India. Govt. of India sent
us to IIM-A for 10 days
of education.

Invested in our
charitable product
TracksGiving.
What clients are saying?
Pykih has satisfied customers in US, Germany, !
Canada, Australia, Kenya and India.

Over-delivered, on
time and on budget.
Great
communication and
end product.

Pykih seeks most
viable options from
business perspective
by always
considering what’s
best for our current
and future needs.

If pykih bids on your
project and say they
can do it, then you
would be crazy to
choose anybody else.
Can not recommend
more highly.

Pykih has deep
expertise in product
management and
enterprise design of
dashboard
technology.

http://www.pykih.com/testimonials
How can we help?

Help product companies improve
analytics modules in their software

Help front-line managers take data
driven decisions with live
dashboards

Help websites make sense of web
traffic and segment customers

Help data journalists find and
explore large, open data sets to
derive stories

Help charities educate donors of
the need for social impact
Services Offered
We simplify the consumption of data and analytics.

analytics
value chain
•

Build custom dashboards

•

Design and build custom visualisations

•

Data analysis using Statistics and Natural Language
Processing

•

OLAP Data Modelling in Pentaho

•

Data Collection from APIs, web scrapping, web mining,
PDF mining

•

Analytics Consulting - we study your data and business
and help identify how data analytics can help you solve
specific business problems
Portfolio of our work
Pykih has a diverse set of clients ranging from ERP software companies, media
analytics software companies, data journalism ventures, gaming companies, etc.
Visually query to find right employees for right job
The chart first loads
all employees with
each employee
rated in a skill set.

Choose your mouse
to select and the
chart tells you which
specific employees
meet the criteria.

http://www.pykih.com/linear-range-query
Hawk Eye Chart for cash flow management
A stacked bar chart that
categorises finances by
available funds and
overdue expenses.

Click on a month and it
opens a percentage
chart that breaks down
each expense by
various category heads.

Click on a percentage
and it opens a table that
lists each expense.
River Chart for analysing multi-channel funnel
A custom chart
specifically
designed for a
Canadian offline
advertisement to
e-commerce
tracking company.

Percentage view

http://www.pykih.com/river

See funnel for only one channel: Email
Data discovery dashboard on India Census

A dashboard on top of India Census data (a large data set) that allows data journalists to explore this open
data interactively to come up with data driven stories.
http://www.pykih.com/census
!10
TV dashboards

Businesses are removing paintings from offices and replacing them with TV dashboards that
broadcast analytics to subconsciously build a data-driven culture amongst their employees.
http://www.pykih.com/tv
Google Analytics data in Infographics format

Does your company send regular
presentations and updates to
your clients?

!

Replace the presentations with
automatically generated
infographics style reports. They
are easy to understand and
automatically generated.
http://www.pykih.com/web-traffic
Two level heat-maps to monitor nation-wide sales
If you have data with a geographic context, leverage maps to quickly identify which areas are performing
better than others.

See a heat map of the whole country.

On identifying which state needs your
attention, click on it and zoom in to see a heat
map of counties / districts to know which
specific counties are causing the problem.
Analytics for FMCG sales managers
pykih has developed a deep understanding of how analytics can be used by
FMCG / CPG companies to improve sales decisions.

Problem: Sales managers,
who are constantly on the
move, need to make sense of
vast amounts of data at their
disposal in MS Excel. This is
inherently inefficient, errorprone and adds lag in
decision making.

http://www.pykih.com/fmcg
Why pykih?
There are many out-of-the-box data visualisation tools in the market. Then why
should we choose pykih’s custom visualisation?

Generic Analytics and BI Product

Pykih

Target
audience

IT admins create reports for managers

Managers

Focus on

Technical flexibility

Giving the right analytics to the right manager
at the right time

Manager
sees

Sees one report at a time

Sees a bird's eye view of the whole business.

Implication

Manager must know what he is looking for
before he can see it.

Sees everything and then drills down

Visualization

They will throw standard pie, bar, column
charts or Excel pivots.

We focus on building multi-dimensional
custom visualizations that are specific to your
domain.
We simplify the consumption of data and analytics.

You can reach us at
rp@pykih.com

Fun fact: The word pykih
comes from five random
characters in a CAPTCHA
that we saw. We decided till
we do good work it does not
matter what we are called.

!16

More Related Content

What's hot

Sap brief the new digital economy
Sap brief the new digital economySap brief the new digital economy
Sap brief the new digital economy
Madeline ten Krooden
 
See Your Business Take Off with SAP® Leonardo
See Your Business Take Off with SAP® LeonardoSee Your Business Take Off with SAP® Leonardo
See Your Business Take Off with SAP® Leonardo
SAP Customer Experience
 
The IoT Imperative for Discrete Manufacturers - Automotive, Aerospace & Defen...
The IoT Imperative for Discrete Manufacturers - Automotive, Aerospace & Defen...The IoT Imperative for Discrete Manufacturers - Automotive, Aerospace & Defen...
The IoT Imperative for Discrete Manufacturers - Automotive, Aerospace & Defen...
SAP Technology
 
Top software development trends of 2021
Top software development trends of 2021Top software development trends of 2021
Top software development trends of 2021
*instinctools
 
Hub16: Why Bespoke Supply Chain Analytics?
Hub16: Why Bespoke Supply Chain Analytics?Hub16: Why Bespoke Supply Chain Analytics?
Hub16: Why Bespoke Supply Chain Analytics?
Anaplan
 
Data & Analytics: The Competitive Edge for Small and Midsize Businesses
Data & Analytics: The Competitive Edge for Small and Midsize BusinessesData & Analytics: The Competitive Edge for Small and Midsize Businesses
Data & Analytics: The Competitive Edge for Small and Midsize Businesses
SAP Analytics
 
Data Integration: Huntflow and PowerBI | Case Study | Software Development Co...
Data Integration: Huntflow and PowerBI | Case Study | Software Development Co...Data Integration: Huntflow and PowerBI | Case Study | Software Development Co...
Data Integration: Huntflow and PowerBI | Case Study | Software Development Co...
*instinctools
 
Raise your Brand's Analytics IQ with Salesforce Einstein
Raise your Brand's Analytics IQ with Salesforce EinsteinRaise your Brand's Analytics IQ with Salesforce Einstein
Raise your Brand's Analytics IQ with Salesforce Einstein
Gib Bassett
 
What's So Great About Embedded Analytics?
What's So Great About Embedded Analytics?What's So Great About Embedded Analytics?
What's So Great About Embedded Analytics?
GoodData
 
What's the ROI of Embedded Analytics?
What's the ROI of Embedded Analytics?What's the ROI of Embedded Analytics?
What's the ROI of Embedded Analytics?
GoodData
 
#askSAP Analytics Innovations Community Call – Bridging the Information Gap
#askSAP Analytics Innovations Community Call – Bridging the Information Gap#askSAP Analytics Innovations Community Call – Bridging the Information Gap
#askSAP Analytics Innovations Community Call – Bridging the Information Gap
SAP Analytics
 
Big Data in Cloud: Seize your Insight Like a Golden Snitch (Margaret Ostapchu...
Big Data in Cloud: Seize your Insight Like a Golden Snitch (Margaret Ostapchu...Big Data in Cloud: Seize your Insight Like a Golden Snitch (Margaret Ostapchu...
Big Data in Cloud: Seize your Insight Like a Golden Snitch (Margaret Ostapchu...
IT Arena
 
Rahat Yasir: Enterprise Data & AI Strategy & Platform Designing
Rahat Yasir: Enterprise Data & AI Strategy & Platform DesigningRahat Yasir: Enterprise Data & AI Strategy & Platform Designing
Rahat Yasir: Enterprise Data & AI Strategy & Platform Designing
Lviv Startup Club
 
Accelerate your digital transformation with ERP at its core
Accelerate your digital transformation with ERP at its coreAccelerate your digital transformation with ERP at its core
Accelerate your digital transformation with ERP at its core
Knoldus Inc.
 
Microsoft Dynamics by Muhammad Husayn Ace
Microsoft Dynamics by Muhammad Husayn AceMicrosoft Dynamics by Muhammad Husayn Ace
Microsoft Dynamics by Muhammad Husayn Ace
Muhammad Husayn
 
Digital economy infographic so africa
Digital economy infographic so africaDigital economy infographic so africa
Digital economy infographic so africa
Madeline ten Krooden
 
Towards connected planning for Supply Chain
Towards connected planning for Supply Chain Towards connected planning for Supply Chain
Towards connected planning for Supply Chain
Bluecrux
 
Personalization through Contextual Marketing
Personalization through Contextual MarketingPersonalization through Contextual Marketing
Personalization through Contextual Marketing
SAP Customer Experience
 
Optimize Business Intelligence Efforts With Embedded, Application-Driven Anal...
Optimize Business Intelligence Efforts With Embedded, Application-Driven Anal...Optimize Business Intelligence Efforts With Embedded, Application-Driven Anal...
Optimize Business Intelligence Efforts With Embedded, Application-Driven Anal...
SAP Analytics
 
About MAIA Intelligence Company Profile
About MAIA Intelligence Company ProfileAbout MAIA Intelligence Company Profile
About MAIA Intelligence Company Profile
Sanjay Mehta
 

What's hot (20)

Sap brief the new digital economy
Sap brief the new digital economySap brief the new digital economy
Sap brief the new digital economy
 
See Your Business Take Off with SAP® Leonardo
See Your Business Take Off with SAP® LeonardoSee Your Business Take Off with SAP® Leonardo
See Your Business Take Off with SAP® Leonardo
 
The IoT Imperative for Discrete Manufacturers - Automotive, Aerospace & Defen...
The IoT Imperative for Discrete Manufacturers - Automotive, Aerospace & Defen...The IoT Imperative for Discrete Manufacturers - Automotive, Aerospace & Defen...
The IoT Imperative for Discrete Manufacturers - Automotive, Aerospace & Defen...
 
Top software development trends of 2021
Top software development trends of 2021Top software development trends of 2021
Top software development trends of 2021
 
Hub16: Why Bespoke Supply Chain Analytics?
Hub16: Why Bespoke Supply Chain Analytics?Hub16: Why Bespoke Supply Chain Analytics?
Hub16: Why Bespoke Supply Chain Analytics?
 
Data & Analytics: The Competitive Edge for Small and Midsize Businesses
Data & Analytics: The Competitive Edge for Small and Midsize BusinessesData & Analytics: The Competitive Edge for Small and Midsize Businesses
Data & Analytics: The Competitive Edge for Small and Midsize Businesses
 
Data Integration: Huntflow and PowerBI | Case Study | Software Development Co...
Data Integration: Huntflow and PowerBI | Case Study | Software Development Co...Data Integration: Huntflow and PowerBI | Case Study | Software Development Co...
Data Integration: Huntflow and PowerBI | Case Study | Software Development Co...
 
Raise your Brand's Analytics IQ with Salesforce Einstein
Raise your Brand's Analytics IQ with Salesforce EinsteinRaise your Brand's Analytics IQ with Salesforce Einstein
Raise your Brand's Analytics IQ with Salesforce Einstein
 
What's So Great About Embedded Analytics?
What's So Great About Embedded Analytics?What's So Great About Embedded Analytics?
What's So Great About Embedded Analytics?
 
What's the ROI of Embedded Analytics?
What's the ROI of Embedded Analytics?What's the ROI of Embedded Analytics?
What's the ROI of Embedded Analytics?
 
#askSAP Analytics Innovations Community Call – Bridging the Information Gap
#askSAP Analytics Innovations Community Call – Bridging the Information Gap#askSAP Analytics Innovations Community Call – Bridging the Information Gap
#askSAP Analytics Innovations Community Call – Bridging the Information Gap
 
Big Data in Cloud: Seize your Insight Like a Golden Snitch (Margaret Ostapchu...
Big Data in Cloud: Seize your Insight Like a Golden Snitch (Margaret Ostapchu...Big Data in Cloud: Seize your Insight Like a Golden Snitch (Margaret Ostapchu...
Big Data in Cloud: Seize your Insight Like a Golden Snitch (Margaret Ostapchu...
 
Rahat Yasir: Enterprise Data & AI Strategy & Platform Designing
Rahat Yasir: Enterprise Data & AI Strategy & Platform DesigningRahat Yasir: Enterprise Data & AI Strategy & Platform Designing
Rahat Yasir: Enterprise Data & AI Strategy & Platform Designing
 
Accelerate your digital transformation with ERP at its core
Accelerate your digital transformation with ERP at its coreAccelerate your digital transformation with ERP at its core
Accelerate your digital transformation with ERP at its core
 
Microsoft Dynamics by Muhammad Husayn Ace
Microsoft Dynamics by Muhammad Husayn AceMicrosoft Dynamics by Muhammad Husayn Ace
Microsoft Dynamics by Muhammad Husayn Ace
 
Digital economy infographic so africa
Digital economy infographic so africaDigital economy infographic so africa
Digital economy infographic so africa
 
Towards connected planning for Supply Chain
Towards connected planning for Supply Chain Towards connected planning for Supply Chain
Towards connected planning for Supply Chain
 
Personalization through Contextual Marketing
Personalization through Contextual MarketingPersonalization through Contextual Marketing
Personalization through Contextual Marketing
 
Optimize Business Intelligence Efforts With Embedded, Application-Driven Anal...
Optimize Business Intelligence Efforts With Embedded, Application-Driven Anal...Optimize Business Intelligence Efforts With Embedded, Application-Driven Anal...
Optimize Business Intelligence Efforts With Embedded, Application-Driven Anal...
 
About MAIA Intelligence Company Profile
About MAIA Intelligence Company ProfileAbout MAIA Intelligence Company Profile
About MAIA Intelligence Company Profile
 

Similar to Company presentation

JARVIS:BI for FMCG Sales Managers
JARVIS:BI for FMCG Sales ManagersJARVIS:BI for FMCG Sales Managers
JARVIS:BI for FMCG Sales Managers
Ritvvij Parrikh
 
Bite-Analytics
Bite-AnalyticsBite-Analytics
Bite-Analytics
Bussiness Intelligence
 
Revenue Operations Analytics: A Strategic Blueprint
Revenue Operations Analytics: A Strategic BlueprintRevenue Operations Analytics: A Strategic Blueprint
Revenue Operations Analytics: A Strategic Blueprint
Kwanzoo Inc
 
Improvado
ImprovadoImprovado
Improvado
Team2080
 
Systematix_Credential_Presentation_latest (1)
Systematix_Credential_Presentation_latest (1)Systematix_Credential_Presentation_latest (1)
Systematix_Credential_Presentation_latest (1)
Alex Hunt
 
Improvado Pitch Deck
Improvado Pitch DeckImprovado Pitch Deck
Improvado Pitch Deck
Improvado.io
 
How data visualization helps cpg industry
How data visualization helps cpg industryHow data visualization helps cpg industry
How data visualization helps cpg industry
Polestarsolutions
 
Business Intelligence Services | BI Tools
Business Intelligence Services | BI ToolsBusiness Intelligence Services | BI Tools
Business Intelligence Services | BI Tools
eLuminous Technologies Pvt. Ltd.
 
Delivering Business Intelligence: Empowering users to Automate, Streamline, A...
Delivering Business Intelligence: Empowering users to Automate, Streamline, A...Delivering Business Intelligence: Empowering users to Automate, Streamline, A...
Delivering Business Intelligence: Empowering users to Automate, Streamline, A...
Christian Ofori-Boateng
 
Startup Sales Stack Report 2017
Startup Sales Stack Report 2017Startup Sales Stack Report 2017
Startup Sales Stack Report 2017
Nic Poulos
 
BVDs and Your Data - Combined to Drive Success
BVDs and Your Data - Combined to Drive SuccessBVDs and Your Data - Combined to Drive Success
BVDs and Your Data - Combined to Drive Success
ResultsPositive Business Technology Solutions
 
FACTis-Business Intelligence Presentation
FACTis-Business Intelligence PresentationFACTis-Business Intelligence Presentation
FACTis-Business Intelligence Presentation
Euthenics IT Service - Business Intelligence Solution
 
Developing a cult of analytics
Developing a cult of analyticsDeveloping a cult of analytics
Developing a cult of analytics
Steve Jackson
 
Business intelligence an introduction
Business intelligence an introductionBusiness intelligence an introduction
Business intelligence an introduction
Isaac Victor
 
Meltwater enterprise solutions
Meltwater enterprise solutions Meltwater enterprise solutions
Meltwater enterprise solutions
Ajay Khari
 
Analytics
Analytics Analytics
Analytics
Pivotal CRM
 
How and Why: Embedded Analytics Interfaces For Your SaaS Product
How and Why: Embedded Analytics Interfaces For Your SaaS ProductHow and Why: Embedded Analytics Interfaces For Your SaaS Product
How and Why: Embedded Analytics Interfaces For Your SaaS Product
Aggregage
 
Modern Product Data Workflows: How and Why: Embedded Analytics Interfaces For...
Modern Product Data Workflows: How and Why: Embedded Analytics Interfaces For...Modern Product Data Workflows: How and Why: Embedded Analytics Interfaces For...
Modern Product Data Workflows: How and Why: Embedded Analytics Interfaces For...
Hannah Flynn
 
Content marketing analytics: how to make your data work harder for your business
Content marketing analytics: how to make your data work harder for your businessContent marketing analytics: how to make your data work harder for your business
Content marketing analytics: how to make your data work harder for your business
Daniel Smulevich
 
What are actionable insights? (Introduction to Operational Analytics Software)
What are actionable insights? (Introduction to Operational Analytics Software)What are actionable insights? (Introduction to Operational Analytics Software)
What are actionable insights? (Introduction to Operational Analytics Software)
Newton Day Uploads
 

Similar to Company presentation (20)

JARVIS:BI for FMCG Sales Managers
JARVIS:BI for FMCG Sales ManagersJARVIS:BI for FMCG Sales Managers
JARVIS:BI for FMCG Sales Managers
 
Bite-Analytics
Bite-AnalyticsBite-Analytics
Bite-Analytics
 
Revenue Operations Analytics: A Strategic Blueprint
Revenue Operations Analytics: A Strategic BlueprintRevenue Operations Analytics: A Strategic Blueprint
Revenue Operations Analytics: A Strategic Blueprint
 
Improvado
ImprovadoImprovado
Improvado
 
Systematix_Credential_Presentation_latest (1)
Systematix_Credential_Presentation_latest (1)Systematix_Credential_Presentation_latest (1)
Systematix_Credential_Presentation_latest (1)
 
Improvado Pitch Deck
Improvado Pitch DeckImprovado Pitch Deck
Improvado Pitch Deck
 
How data visualization helps cpg industry
How data visualization helps cpg industryHow data visualization helps cpg industry
How data visualization helps cpg industry
 
Business Intelligence Services | BI Tools
Business Intelligence Services | BI ToolsBusiness Intelligence Services | BI Tools
Business Intelligence Services | BI Tools
 
Delivering Business Intelligence: Empowering users to Automate, Streamline, A...
Delivering Business Intelligence: Empowering users to Automate, Streamline, A...Delivering Business Intelligence: Empowering users to Automate, Streamline, A...
Delivering Business Intelligence: Empowering users to Automate, Streamline, A...
 
Startup Sales Stack Report 2017
Startup Sales Stack Report 2017Startup Sales Stack Report 2017
Startup Sales Stack Report 2017
 
BVDs and Your Data - Combined to Drive Success
BVDs and Your Data - Combined to Drive SuccessBVDs and Your Data - Combined to Drive Success
BVDs and Your Data - Combined to Drive Success
 
FACTis-Business Intelligence Presentation
FACTis-Business Intelligence PresentationFACTis-Business Intelligence Presentation
FACTis-Business Intelligence Presentation
 
Developing a cult of analytics
Developing a cult of analyticsDeveloping a cult of analytics
Developing a cult of analytics
 
Business intelligence an introduction
Business intelligence an introductionBusiness intelligence an introduction
Business intelligence an introduction
 
Meltwater enterprise solutions
Meltwater enterprise solutions Meltwater enterprise solutions
Meltwater enterprise solutions
 
Analytics
Analytics Analytics
Analytics
 
How and Why: Embedded Analytics Interfaces For Your SaaS Product
How and Why: Embedded Analytics Interfaces For Your SaaS ProductHow and Why: Embedded Analytics Interfaces For Your SaaS Product
How and Why: Embedded Analytics Interfaces For Your SaaS Product
 
Modern Product Data Workflows: How and Why: Embedded Analytics Interfaces For...
Modern Product Data Workflows: How and Why: Embedded Analytics Interfaces For...Modern Product Data Workflows: How and Why: Embedded Analytics Interfaces For...
Modern Product Data Workflows: How and Why: Embedded Analytics Interfaces For...
 
Content marketing analytics: how to make your data work harder for your business
Content marketing analytics: how to make your data work harder for your businessContent marketing analytics: how to make your data work harder for your business
Content marketing analytics: how to make your data work harder for your business
 
What are actionable insights? (Introduction to Operational Analytics Software)
What are actionable insights? (Introduction to Operational Analytics Software)What are actionable insights? (Introduction to Operational Analytics Software)
What are actionable insights? (Introduction to Operational Analytics Software)
 

More from Ritvvij Parrikh

Introduction to Pykih's Services
Introduction to Pykih's ServicesIntroduction to Pykih's Services
Introduction to Pykih's Services
Ritvvij Parrikh
 
PykQuery.js
PykQuery.jsPykQuery.js
PykQuery.js
Ritvvij Parrikh
 
"A primer for custom data visualization" - An approach towards getting starte...
"A primer for custom data visualization" - An approach towards getting starte..."A primer for custom data visualization" - An approach towards getting starte...
"A primer for custom data visualization" - An approach towards getting starte...
Ritvvij Parrikh
 
Taxonomy of charts
Taxonomy of chartsTaxonomy of charts
Taxonomy of charts
Ritvvij Parrikh
 
DataMeet 4: Data cleaning & census data
DataMeet 4: Data cleaning & census dataDataMeet 4: Data cleaning & census data
DataMeet 4: Data cleaning & census data
Ritvvij Parrikh
 
Getting comfortable with Data
Getting comfortable with DataGetting comfortable with Data
Getting comfortable with Data
Ritvvij Parrikh
 
Visualizing Data Journalism (HasGeek Fifth Elephant)
Visualizing Data Journalism (HasGeek Fifth Elephant)Visualizing Data Journalism (HasGeek Fifth Elephant)
Visualizing Data Journalism (HasGeek Fifth Elephant)
Ritvvij Parrikh
 
Talk at eChai, EDI, Ahmedabad
Talk at eChai, EDI, AhmedabadTalk at eChai, EDI, Ahmedabad
Talk at eChai, EDI, Ahmedabad
Ritvvij Parrikh
 
Offline Advertisements Analytics Dashboard
Offline Advertisements Analytics DashboardOffline Advertisements Analytics Dashboard
Offline Advertisements Analytics DashboardRitvvij Parrikh
 
Google Analytics Dashboard Design
Google Analytics Dashboard DesignGoogle Analytics Dashboard Design
Google Analytics Dashboard DesignRitvvij Parrikh
 
Google Analytics Dashboard designed as an Infographic
Google Analytics Dashboard designed as an InfographicGoogle Analytics Dashboard designed as an Infographic
Google Analytics Dashboard designed as an InfographicRitvvij Parrikh
 
Payroll Giving Management with TracksGiving
Payroll Giving Management with TracksGivingPayroll Giving Management with TracksGiving
Payroll Giving Management with TracksGiving
Ritvvij Parrikh
 
9 ways how cause marketing can help you achieve your marketing objectives.
9 ways how cause marketing can help you achieve your marketing objectives.9 ways how cause marketing can help you achieve your marketing objectives.
9 ways how cause marketing can help you achieve your marketing objectives.
Ritvvij Parrikh
 
How TracksGiving can help you implement your campaigning software up quicker ...
How TracksGiving can help you implement your campaigning software up quicker ...How TracksGiving can help you implement your campaigning software up quicker ...
How TracksGiving can help you implement your campaigning software up quicker ...
Ritvvij Parrikh
 

More from Ritvvij Parrikh (15)

Introduction to Pykih's Services
Introduction to Pykih's ServicesIntroduction to Pykih's Services
Introduction to Pykih's Services
 
PykQuery.js
PykQuery.jsPykQuery.js
PykQuery.js
 
"A primer for custom data visualization" - An approach towards getting starte...
"A primer for custom data visualization" - An approach towards getting starte..."A primer for custom data visualization" - An approach towards getting starte...
"A primer for custom data visualization" - An approach towards getting starte...
 
Taxonomy of charts
Taxonomy of chartsTaxonomy of charts
Taxonomy of charts
 
DataMeet 4: Data cleaning & census data
DataMeet 4: Data cleaning & census dataDataMeet 4: Data cleaning & census data
DataMeet 4: Data cleaning & census data
 
Getting comfortable with Data
Getting comfortable with DataGetting comfortable with Data
Getting comfortable with Data
 
Visualizing Data Journalism (HasGeek Fifth Elephant)
Visualizing Data Journalism (HasGeek Fifth Elephant)Visualizing Data Journalism (HasGeek Fifth Elephant)
Visualizing Data Journalism (HasGeek Fifth Elephant)
 
Talk at eChai, EDI, Ahmedabad
Talk at eChai, EDI, AhmedabadTalk at eChai, EDI, Ahmedabad
Talk at eChai, EDI, Ahmedabad
 
Offline Advertisements Analytics Dashboard
Offline Advertisements Analytics DashboardOffline Advertisements Analytics Dashboard
Offline Advertisements Analytics Dashboard
 
Google Analytics Dashboard Design
Google Analytics Dashboard DesignGoogle Analytics Dashboard Design
Google Analytics Dashboard Design
 
Dashboard fhub
Dashboard fhubDashboard fhub
Dashboard fhub
 
Google Analytics Dashboard designed as an Infographic
Google Analytics Dashboard designed as an InfographicGoogle Analytics Dashboard designed as an Infographic
Google Analytics Dashboard designed as an Infographic
 
Payroll Giving Management with TracksGiving
Payroll Giving Management with TracksGivingPayroll Giving Management with TracksGiving
Payroll Giving Management with TracksGiving
 
9 ways how cause marketing can help you achieve your marketing objectives.
9 ways how cause marketing can help you achieve your marketing objectives.9 ways how cause marketing can help you achieve your marketing objectives.
9 ways how cause marketing can help you achieve your marketing objectives.
 
How TracksGiving can help you implement your campaigning software up quicker ...
How TracksGiving can help you implement your campaigning software up quicker ...How TracksGiving can help you implement your campaigning software up quicker ...
How TracksGiving can help you implement your campaigning software up quicker ...
 

Recently uploaded

Introduction to CHERI technology - Cybersecurity
Introduction to CHERI technology - CybersecurityIntroduction to CHERI technology - Cybersecurity
Introduction to CHERI technology - Cybersecurity
mikeeftimakis1
 
20240607 QFM018 Elixir Reading List May 2024
20240607 QFM018 Elixir Reading List May 202420240607 QFM018 Elixir Reading List May 2024
20240607 QFM018 Elixir Reading List May 2024
Matthew Sinclair
 
Infrastructure Challenges in Scaling RAG with Custom AI models
Infrastructure Challenges in Scaling RAG with Custom AI modelsInfrastructure Challenges in Scaling RAG with Custom AI models
Infrastructure Challenges in Scaling RAG with Custom AI models
Zilliz
 
Cosa hanno in comune un mattoncino Lego e la backdoor XZ?
Cosa hanno in comune un mattoncino Lego e la backdoor XZ?Cosa hanno in comune un mattoncino Lego e la backdoor XZ?
Cosa hanno in comune un mattoncino Lego e la backdoor XZ?
Speck&Tech
 
Uni Systems Copilot event_05062024_C.Vlachos.pdf
Uni Systems Copilot event_05062024_C.Vlachos.pdfUni Systems Copilot event_05062024_C.Vlachos.pdf
Uni Systems Copilot event_05062024_C.Vlachos.pdf
Uni Systems S.M.S.A.
 
Video Streaming: Then, Now, and in the Future
Video Streaming: Then, Now, and in the FutureVideo Streaming: Then, Now, and in the Future
Video Streaming: Then, Now, and in the Future
Alpen-Adria-Universität
 
Removing Uninteresting Bytes in Software Fuzzing
Removing Uninteresting Bytes in Software FuzzingRemoving Uninteresting Bytes in Software Fuzzing
Removing Uninteresting Bytes in Software Fuzzing
Aftab Hussain
 
Mariano G Tinti - Decoding SpaceX
Mariano G Tinti - Decoding SpaceXMariano G Tinti - Decoding SpaceX
Mariano G Tinti - Decoding SpaceX
Mariano Tinti
 
Artificial Intelligence for XMLDevelopment
Artificial Intelligence for XMLDevelopmentArtificial Intelligence for XMLDevelopment
Artificial Intelligence for XMLDevelopment
Octavian Nadolu
 
Programming Foundation Models with DSPy - Meetup Slides
Programming Foundation Models with DSPy - Meetup SlidesProgramming Foundation Models with DSPy - Meetup Slides
Programming Foundation Models with DSPy - Meetup Slides
Zilliz
 
Presentation of the OECD Artificial Intelligence Review of Germany
Presentation of the OECD Artificial Intelligence Review of GermanyPresentation of the OECD Artificial Intelligence Review of Germany
Presentation of the OECD Artificial Intelligence Review of Germany
innovationoecd
 
How to use Firebase Data Connect For Flutter
How to use Firebase Data Connect For FlutterHow to use Firebase Data Connect For Flutter
How to use Firebase Data Connect For Flutter
Daiki Mogmet Ito
 
Essentials of Automations: The Art of Triggers and Actions in FME
Essentials of Automations: The Art of Triggers and Actions in FMEEssentials of Automations: The Art of Triggers and Actions in FME
Essentials of Automations: The Art of Triggers and Actions in FME
Safe Software
 
GraphSummit Singapore | The Art of the Possible with Graph - Q2 2024
GraphSummit Singapore | The Art of the  Possible with Graph - Q2 2024GraphSummit Singapore | The Art of the  Possible with Graph - Q2 2024
GraphSummit Singapore | The Art of the Possible with Graph - Q2 2024
Neo4j
 
Best 20 SEO Techniques To Improve Website Visibility In SERP
Best 20 SEO Techniques To Improve Website Visibility In SERPBest 20 SEO Techniques To Improve Website Visibility In SERP
Best 20 SEO Techniques To Improve Website Visibility In SERP
Pixlogix Infotech
 
GraphSummit Singapore | Graphing Success: Revolutionising Organisational Stru...
GraphSummit Singapore | Graphing Success: Revolutionising Organisational Stru...GraphSummit Singapore | Graphing Success: Revolutionising Organisational Stru...
GraphSummit Singapore | Graphing Success: Revolutionising Organisational Stru...
Neo4j
 
GraphSummit Singapore | Enhancing Changi Airport Group's Passenger Experience...
GraphSummit Singapore | Enhancing Changi Airport Group's Passenger Experience...GraphSummit Singapore | Enhancing Changi Airport Group's Passenger Experience...
GraphSummit Singapore | Enhancing Changi Airport Group's Passenger Experience...
Neo4j
 
Goodbye Windows 11: Make Way for Nitrux Linux 3.5.0!
Goodbye Windows 11: Make Way for Nitrux Linux 3.5.0!Goodbye Windows 11: Make Way for Nitrux Linux 3.5.0!
Goodbye Windows 11: Make Way for Nitrux Linux 3.5.0!
SOFTTECHHUB
 
みなさんこんにちはこれ何文字まで入るの?40文字以下不可とか本当に意味わからないけどこれ限界文字数書いてないからマジでやばい文字数いけるんじゃないの?えこ...
みなさんこんにちはこれ何文字まで入るの?40文字以下不可とか本当に意味わからないけどこれ限界文字数書いてないからマジでやばい文字数いけるんじゃないの?えこ...みなさんこんにちはこれ何文字まで入るの?40文字以下不可とか本当に意味わからないけどこれ限界文字数書いてないからマジでやばい文字数いけるんじゃないの?えこ...
みなさんこんにちはこれ何文字まで入るの?40文字以下不可とか本当に意味わからないけどこれ限界文字数書いてないからマジでやばい文字数いけるんじゃないの?えこ...
名前 です男
 
Communications Mining Series - Zero to Hero - Session 1
Communications Mining Series - Zero to Hero - Session 1Communications Mining Series - Zero to Hero - Session 1
Communications Mining Series - Zero to Hero - Session 1
DianaGray10
 

Recently uploaded (20)

Introduction to CHERI technology - Cybersecurity
Introduction to CHERI technology - CybersecurityIntroduction to CHERI technology - Cybersecurity
Introduction to CHERI technology - Cybersecurity
 
20240607 QFM018 Elixir Reading List May 2024
20240607 QFM018 Elixir Reading List May 202420240607 QFM018 Elixir Reading List May 2024
20240607 QFM018 Elixir Reading List May 2024
 
Infrastructure Challenges in Scaling RAG with Custom AI models
Infrastructure Challenges in Scaling RAG with Custom AI modelsInfrastructure Challenges in Scaling RAG with Custom AI models
Infrastructure Challenges in Scaling RAG with Custom AI models
 
Cosa hanno in comune un mattoncino Lego e la backdoor XZ?
Cosa hanno in comune un mattoncino Lego e la backdoor XZ?Cosa hanno in comune un mattoncino Lego e la backdoor XZ?
Cosa hanno in comune un mattoncino Lego e la backdoor XZ?
 
Uni Systems Copilot event_05062024_C.Vlachos.pdf
Uni Systems Copilot event_05062024_C.Vlachos.pdfUni Systems Copilot event_05062024_C.Vlachos.pdf
Uni Systems Copilot event_05062024_C.Vlachos.pdf
 
Video Streaming: Then, Now, and in the Future
Video Streaming: Then, Now, and in the FutureVideo Streaming: Then, Now, and in the Future
Video Streaming: Then, Now, and in the Future
 
Removing Uninteresting Bytes in Software Fuzzing
Removing Uninteresting Bytes in Software FuzzingRemoving Uninteresting Bytes in Software Fuzzing
Removing Uninteresting Bytes in Software Fuzzing
 
Mariano G Tinti - Decoding SpaceX
Mariano G Tinti - Decoding SpaceXMariano G Tinti - Decoding SpaceX
Mariano G Tinti - Decoding SpaceX
 
Artificial Intelligence for XMLDevelopment
Artificial Intelligence for XMLDevelopmentArtificial Intelligence for XMLDevelopment
Artificial Intelligence for XMLDevelopment
 
Programming Foundation Models with DSPy - Meetup Slides
Programming Foundation Models with DSPy - Meetup SlidesProgramming Foundation Models with DSPy - Meetup Slides
Programming Foundation Models with DSPy - Meetup Slides
 
Presentation of the OECD Artificial Intelligence Review of Germany
Presentation of the OECD Artificial Intelligence Review of GermanyPresentation of the OECD Artificial Intelligence Review of Germany
Presentation of the OECD Artificial Intelligence Review of Germany
 
How to use Firebase Data Connect For Flutter
How to use Firebase Data Connect For FlutterHow to use Firebase Data Connect For Flutter
How to use Firebase Data Connect For Flutter
 
Essentials of Automations: The Art of Triggers and Actions in FME
Essentials of Automations: The Art of Triggers and Actions in FMEEssentials of Automations: The Art of Triggers and Actions in FME
Essentials of Automations: The Art of Triggers and Actions in FME
 
GraphSummit Singapore | The Art of the Possible with Graph - Q2 2024
GraphSummit Singapore | The Art of the  Possible with Graph - Q2 2024GraphSummit Singapore | The Art of the  Possible with Graph - Q2 2024
GraphSummit Singapore | The Art of the Possible with Graph - Q2 2024
 
Best 20 SEO Techniques To Improve Website Visibility In SERP
Best 20 SEO Techniques To Improve Website Visibility In SERPBest 20 SEO Techniques To Improve Website Visibility In SERP
Best 20 SEO Techniques To Improve Website Visibility In SERP
 
GraphSummit Singapore | Graphing Success: Revolutionising Organisational Stru...
GraphSummit Singapore | Graphing Success: Revolutionising Organisational Stru...GraphSummit Singapore | Graphing Success: Revolutionising Organisational Stru...
GraphSummit Singapore | Graphing Success: Revolutionising Organisational Stru...
 
GraphSummit Singapore | Enhancing Changi Airport Group's Passenger Experience...
GraphSummit Singapore | Enhancing Changi Airport Group's Passenger Experience...GraphSummit Singapore | Enhancing Changi Airport Group's Passenger Experience...
GraphSummit Singapore | Enhancing Changi Airport Group's Passenger Experience...
 
Goodbye Windows 11: Make Way for Nitrux Linux 3.5.0!
Goodbye Windows 11: Make Way for Nitrux Linux 3.5.0!Goodbye Windows 11: Make Way for Nitrux Linux 3.5.0!
Goodbye Windows 11: Make Way for Nitrux Linux 3.5.0!
 
みなさんこんにちはこれ何文字まで入るの?40文字以下不可とか本当に意味わからないけどこれ限界文字数書いてないからマジでやばい文字数いけるんじゃないの?えこ...
みなさんこんにちはこれ何文字まで入るの?40文字以下不可とか本当に意味わからないけどこれ限界文字数書いてないからマジでやばい文字数いけるんじゃないの?えこ...みなさんこんにちはこれ何文字まで入るの?40文字以下不可とか本当に意味わからないけどこれ限界文字数書いてないからマジでやばい文字数いけるんじゃないの?えこ...
みなさんこんにちはこれ何文字まで入るの?40文字以下不可とか本当に意味わからないけどこれ限界文字数書いてないからマジでやばい文字数いけるんじゃないの?えこ...
 
Communications Mining Series - Zero to Hero - Session 1
Communications Mining Series - Zero to Hero - Session 1Communications Mining Series - Zero to Hero - Session 1
Communications Mining Series - Zero to Hero - Session 1
 

Company presentation

  • 1. Data Visualisation We simplify the consumption of data and analytics. Ritvvij Parrikh, Founder, www.pykih.com !1
  • 2. Introduction We are an award-winning, 2.5 year old, Mumbai based data analytics and visualisation company. We build visual representations of pre-analysed datasets to help users to do some tasks more effectively. Top 75 early stage startups out of 14,000+ in India. Govt. of India sent us to IIM-A for 10 days of education. Invested in our charitable product TracksGiving.
  • 3. What clients are saying? Pykih has satisfied customers in US, Germany, ! Canada, Australia, Kenya and India. Over-delivered, on time and on budget. Great communication and end product. Pykih seeks most viable options from business perspective by always considering what’s best for our current and future needs. If pykih bids on your project and say they can do it, then you would be crazy to choose anybody else. Can not recommend more highly. Pykih has deep expertise in product management and enterprise design of dashboard technology. http://www.pykih.com/testimonials
  • 4. How can we help? Help product companies improve analytics modules in their software Help front-line managers take data driven decisions with live dashboards Help websites make sense of web traffic and segment customers Help data journalists find and explore large, open data sets to derive stories Help charities educate donors of the need for social impact
  • 5. Services Offered We simplify the consumption of data and analytics. analytics value chain • Build custom dashboards • Design and build custom visualisations • Data analysis using Statistics and Natural Language Processing • OLAP Data Modelling in Pentaho • Data Collection from APIs, web scrapping, web mining, PDF mining • Analytics Consulting - we study your data and business and help identify how data analytics can help you solve specific business problems
  • 6. Portfolio of our work Pykih has a diverse set of clients ranging from ERP software companies, media analytics software companies, data journalism ventures, gaming companies, etc.
  • 7. Visually query to find right employees for right job The chart first loads all employees with each employee rated in a skill set. Choose your mouse to select and the chart tells you which specific employees meet the criteria. http://www.pykih.com/linear-range-query
  • 8. Hawk Eye Chart for cash flow management A stacked bar chart that categorises finances by available funds and overdue expenses. Click on a month and it opens a percentage chart that breaks down each expense by various category heads. Click on a percentage and it opens a table that lists each expense.
  • 9. River Chart for analysing multi-channel funnel A custom chart specifically designed for a Canadian offline advertisement to e-commerce tracking company. Percentage view http://www.pykih.com/river See funnel for only one channel: Email
  • 10. Data discovery dashboard on India Census A dashboard on top of India Census data (a large data set) that allows data journalists to explore this open data interactively to come up with data driven stories. http://www.pykih.com/census !10
  • 11. TV dashboards Businesses are removing paintings from offices and replacing them with TV dashboards that broadcast analytics to subconsciously build a data-driven culture amongst their employees. http://www.pykih.com/tv
  • 12. Google Analytics data in Infographics format Does your company send regular presentations and updates to your clients? ! Replace the presentations with automatically generated infographics style reports. They are easy to understand and automatically generated. http://www.pykih.com/web-traffic
  • 13. Two level heat-maps to monitor nation-wide sales If you have data with a geographic context, leverage maps to quickly identify which areas are performing better than others. See a heat map of the whole country. On identifying which state needs your attention, click on it and zoom in to see a heat map of counties / districts to know which specific counties are causing the problem.
  • 14. Analytics for FMCG sales managers pykih has developed a deep understanding of how analytics can be used by FMCG / CPG companies to improve sales decisions. Problem: Sales managers, who are constantly on the move, need to make sense of vast amounts of data at their disposal in MS Excel. This is inherently inefficient, errorprone and adds lag in decision making. http://www.pykih.com/fmcg
  • 15. Why pykih? There are many out-of-the-box data visualisation tools in the market. Then why should we choose pykih’s custom visualisation? Generic Analytics and BI Product Pykih Target audience IT admins create reports for managers Managers Focus on Technical flexibility Giving the right analytics to the right manager at the right time Manager sees Sees one report at a time Sees a bird's eye view of the whole business. Implication Manager must know what he is looking for before he can see it. Sees everything and then drills down Visualization They will throw standard pie, bar, column charts or Excel pivots. We focus on building multi-dimensional custom visualizations that are specific to your domain.
  • 16. We simplify the consumption of data and analytics. You can reach us at rp@pykih.com Fun fact: The word pykih comes from five random characters in a CAPTCHA that we saw. We decided till we do good work it does not matter what we are called. !16