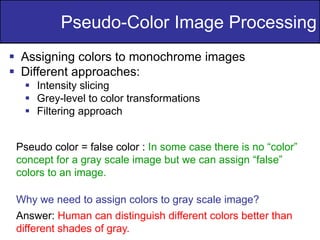
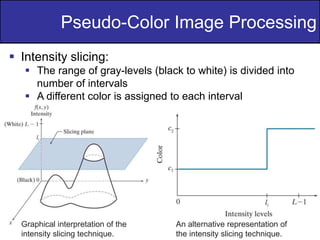
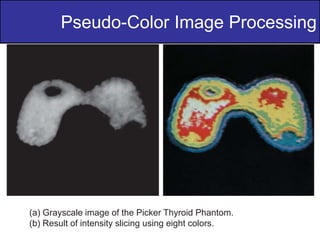
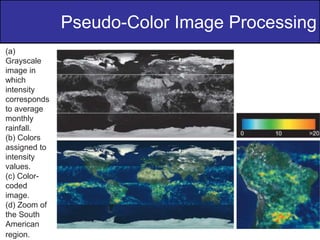
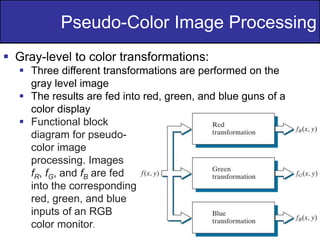
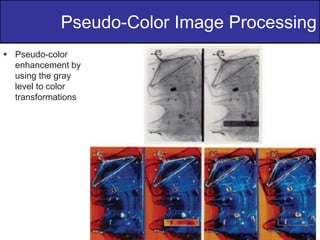
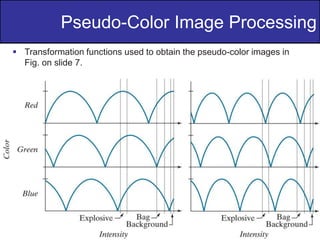
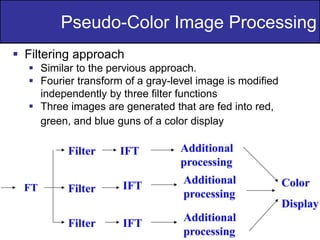
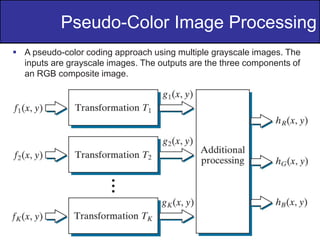
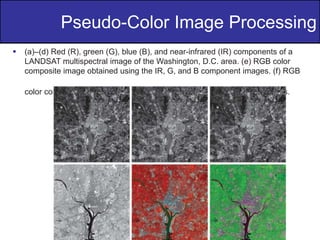
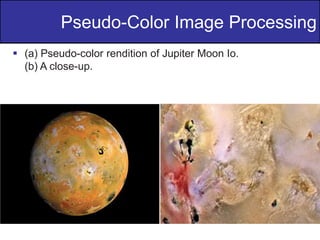
Digital Image Processing
Dr. M. Ilyas Fakhir
Lecture-13
2
of
36
Pseudo-Color Image Processing
 Assigning colors to monochrome images
 Different approaches:
 Intensity slicing
 Grey-level to color transformations
 Filtering approach
Pseudo color = false color : In some case there is no “color”
concept for a gray scale image but we can assign “false”
colors to an image.
Why we need to assign colors to gray scale image?
Answer: Human can distinguish different colors better than
different shades of gray.
3
of
36
Pseudo-Color Image Processing
 Intensity slicing:
 The range of gray-levels (black to white) is divided into
number of intervals
 A different color is assigned to each interval
Graphical interpretation of the
intensity slicing technique.
An alternative representation of
the intensity slicing technique.
4
of
36
Pseudo-Color Image Processing
(a) Grayscale image of the Picker Thyroid Phantom.
(b) Result of intensity slicing using eight colors.
5
of
36
Pseudo-Color Image Processing
(a)
Grayscale
image in
which
intensity
corresponds
to average
monthly
rainfall.
(b) Colors
assigned to
intensity
values.
(c) Color-
coded
image.
(d) Zoom of
the South
American
region.
6
of
36
Pseudo-Color Image Processing
 Gray-level to color transformations:
 Three different transformations are performed on the
gray level image
 The results are fed into red, green, and blue guns of a
color display
 Functional block
diagram for pseudo-
color image
processing. Images
fR, fG, and fB are fed
into the corresponding
red, green, and blue
inputs of an RGB
color monitor.
7
of
36
Pseudo-Color Image Processing
 Pseudo-color
enhancement by
using the gray
level to color
transformations
8
of
36
Pseudo-Color Image Processing
 Transformation functions used to obtain the pseudo-color images in
Fig. on slide 7.
9
of
36
Pseudo-Color Image Processing
 Filtering approach
 Similar to the pervious approach.
 Fourier transform of a gray-level image is modified
independently by three filter functions
 Three images are generated that are fed into red,
green, and blue guns of a color display
FT
10
of
36
Pseudo-Color Image Processing
 A pseudo-color coding approach using multiple grayscale images. The
inputs are grayscale images. The outputs are the three components of
an RGB composite image.
11
of
36
Pseudo-Color Image Processing
 (a)–(d) Red (R), green (G), blue (B), and near-infrared (IR) components of a
LANDSAT multispectral image of the Washington, D.C. area. (e) RGB color
composite image obtained using the IR, G, and B component images. (f) RGB
color composite image obtained using the R, IR, and B component images.
12
of
36
Pseudo-Color Image Processing
 (a) Pseudo-color rendition of Jupiter Moon Io.
(b) A close-up.
13
of
36
Basic of Full-Color Image Processing
 Two methods:
 Per-color-component processing: process each
component separately.
 Vector processing: treat each pixel as a vector to be
processed.
 Let c represent an arbitrary vector in RGB color space:
 For an image of size M × N , there areMN such vectors, c(x, y), for
x = 0 1 2 , , , , … M - 1 and y = 0 1 2 , , , , . … N - 1
14
of
36
Basic of Full-Color Image Processing
 Spatial neighborhoods for grayscale and RGB color images. Observe in (b) that
a single pair of spatial coordinates, (x, y), addresses the same spatial location in
all three images.
 The points have more than two components, we call them voxels.
15
of
36
Basic of Full-Color Image Processing
 A full-color image and its
various color-space
components.
16
of
36
Color Transformations
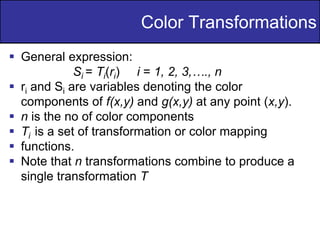
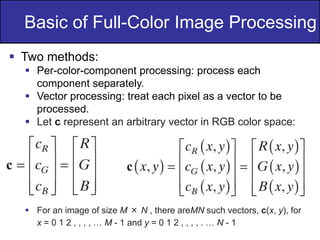
 Color transformation can be represented by the
expression:
g(x,y)=T[f(x,y)]
 f(x,y): input image
 g(x,y): processed (output) image
 T[*]: an operator on f defined over neighborhood
of (x,y).
 The pixel values here are triplets or quartets (i.e
group of 3 or 4 values)
17
of
36
Color Transformations
 General expression:
Si = Ti(ri) i = 1, 2, 3,…., n
 ri and Si are variables denoting the color
components of f(x,y) and g(x,y) at any point (x,y).
 n is the no of color components
 Ti is a set of transformation or color mapping
 functions.
 Note that n transformations combine to produce a
single transformation T
18
of
36
Color Transformations
 The color space chosen determine the value of n.
 If RGB color space is selected then n = 3 & r1,r2,r3
denotes the red, blue and green components of the
image.
 If CMYK color space is selected then n = 4 &
r1,r2,r3,r4 denotes the cyan, hue, magenta and black
components of the image.
 Suppose we want to modify the intensity of the
given image
 using g(x,y) = k*f(x,y) where 0 < k < 1
19
of
36
Color Transformations
 In HSI color space this can be done with the simple
transformation
s3=k*r3
where s1=r1 and s2=r2
Only intensity component r3 is modified.
 In RGB color space 3 components must be
transformed:
si=k*ri i=1,2,3.
 In CMY color space 3 components must be
transformed:
si=k*ri + (1-k) i=1,2,3.
 Using k=0.7 the intensity of an image is decreased
by 30%.
20
of
36
Color Transformations
 Adjusting the intensity of an image using color transformations. (a) Original image.
(b) Result of decreasing its intensity by 30% (i.e., letting k = 0.7). (c) The required
RGB mapping function. (d)–(e) The required CMYK mapping functions.
(f) The required CMY mapping function. (g)–(h) The required HSI mapping functions
21
of
36
Color Complements
 The hues directly opposite one another on the color circle
are called complements
 Color complements are useful for enhancing detail that is
embedded in dark regions of a color image
22
of
36
Color Complements
 Color complement
transformations.
(a) Original image.
(b) Complement
transformation
functions.
(c) Complement of
(a) based on the
RGB mapping
functions. (d) An
approximation of
the RGB
complement using
HSI transformations.
23
of
36
 Highlighting a specific range of colors in an image is
useful for separating object from their surrounding.
 The simplest way to “slice” a color image is to map
the colors outside some range of interest to a non-
prominent neutral color (e.g., (R, G, B)=(0.5, 0.5,
0.5)). If the colors of interest are enclosed by a cube
(or hypercube for n>3) of width W and centered at a
average color with component the necessary set of
transformation is:
Color Slicing
24
of
36
 If a sphere is used to specify the colors of interest
then
 Forcing all other colors to the mid point of the
reference color space.
 In RGB color space, the neural color is (0.5, 0.5,
0.5)
Color Slicing
25
of
36
 Color-slicing transformations that detect (a) reds within an RGB cube of
width W = 0.2549 centered at (0.6863, 0.1608, 0.1922), and (b) reds
within an RGB sphere of radius 0.1765 centered at the same point. Pixels
outside the cube and sphere were replaced by color (0.5, 0.5, 0.5).
Color Slicing
26
of
36
 Tonal corrections for flat,
light (high key), and dark
(low key) color images.
Adjusting the red, green,
and blue components
equally does not always
alter the image hues
significantly.
Tone and Color Corrections
27
of
36
 Color balancing a CMYK
image.
Tone and Color Corrections
28
of
36
 Equalized the histogram of each component will
results in error color.
 Spread the color intensity (I) uniformly, leaving
the color themselves (hues) unchanged.
 Equalizating the intensity histogram affects the
relative appearance of colors in an image.
 Increasing the image’s saturation component
after the intensity histogram equalization.
Histogram Processing
29
of
36
 Histogram
equalization
(followed by
saturation
adjustment) in
the HSI color
space.
Histogram Processing
30
of
36
 Let Sxy denote the set of coordinates defining a
neighborhood centered at (x, y)in an RGB color space.
Color Image Smoothing
31
of
36
 (a) RGB image.
(b) Red
component image.
(c)Green
component.
(d) Blue
component.
Color Image Smoothing
32
of
36
 HSI components of the RGB color image in Fig. 6.36(a). (a)
Hue. (b) Saturation. (c) Intensity.
Color Image Smoothing
33
of
36
 The Laplacian of vector c is
Color Image Sharpening
34
of
36
 Image smoothing with a 5 × 5 averaging kernel. (a) Result
of processing each RGB component image. (b) Result of
processing the intensity component of the HSI image and
converting to RGB. (c) Difference between the two results.
Color Image Sharpening
35
of
36
 Color is conveniently represented in the hue image.
 Saturation is used as a masking image to isolate
further regions of interest in the hue image.
 The intensity image is used less frequently for
segmentation of color images because it carries no
color information.
Color Image Segmentation in HSI
36
of
36
 Image segmentation in HSI
space. (a) Original. (b) Hue.
(c) Saturation.
(d) Intensity. (e) Binary
saturation mask (black = 0).
(f) Product of (b) and (e).
(g) Histogram of (f). (h)
Segmentation of red
components from (a).
Color Image Segmentation in HSI
37
of
36
 Segmentation in RGB color space
 The measurement of color similarity is the Euclidean
distance between two colors z, and a,
 A generalization of distance measure is
 Where C is the covariance matrix of the samples
representative of the color we want to segment.
Color Image Segmentation in RGB
38
of
36
 Three approaches for enclosing data regions for RGB vector
segmentation.
Color Image Segmentation in RGB
39
of
36
 Segmentation in RGB space.
(a) Original image with colors of
interest shown enclosed by a
rectangle. (b) Result of
segmentation in RGB vector
space.
Color Image Segmentation in RGB
40
of
36
 The gradient operators introduced is effective for
scalar image.
 Compute the gradient on individual images and
then using the results to form a color image will lead
to erroneous results.
Color Edge Detection
41
of
36
 (a)–(c) R, G, and B component images, and (d) resulting
RGB color image. (e)–(g) R, G, and B component images,
and (h) resulting RGB color image.
Color Edge Detection
42
of
36
 (a) RGB image.
(b) Gradient
computed in RGB
color vector space.
(c) Gradient image
formed by the
elementwise
sum of three
individual gradient
images, each
computed using the
Sobel operators.
(d) Difference
between (b) and
(c).
Color Edge Detection
43
of
36
 Component gradient images of the color image in Fig. on
slide 42 (a) Red component, (b) green component, and (c)
blue component.
Color Edge Detection
44
of
36
 The noise content of a color image has the same
characteristics in each color channel.
 It is possible for color channels to be affected
differently by noise.
Noise in Color Image
45
of
36
 (a)–(c) Red, green,
and blue 8-bit
component images
corrupted by
additive Gaussian
noise of mean 0
and standard
deviation of 28
intensity levels.
(d) Resulting RGB
image.
Noise in Color Image
46
of
36
 (a) RGB image
with green plane
corrupted by salt-
and-pepper noise.
(b) Hue
component of
HSI image.
(c) Saturation
component.
(d) Intensity
component.
Noise in Color Image
47
of
36
 Color image
compression.
(a) Original RGB
image.
(b) Result of
compressing, then
decompressing
the image in (a)
Noise in Color Image

Color Image Processing,Digital Image processing

  • 1.
    Digital Image Processing Dr.M. Ilyas Fakhir Lecture-13
  • 2.
    2 of 36 Pseudo-Color Image Processing Assigning colors to monochrome images  Different approaches:  Intensity slicing  Grey-level to color transformations  Filtering approach Pseudo color = false color : In some case there is no “color” concept for a gray scale image but we can assign “false” colors to an image. Why we need to assign colors to gray scale image? Answer: Human can distinguish different colors better than different shades of gray.
  • 3.
    3 of 36 Pseudo-Color Image Processing Intensity slicing:  The range of gray-levels (black to white) is divided into number of intervals  A different color is assigned to each interval Graphical interpretation of the intensity slicing technique. An alternative representation of the intensity slicing technique.
  • 4.
    4 of 36 Pseudo-Color Image Processing (a)Grayscale image of the Picker Thyroid Phantom. (b) Result of intensity slicing using eight colors.
  • 5.
    5 of 36 Pseudo-Color Image Processing (a) Grayscale imagein which intensity corresponds to average monthly rainfall. (b) Colors assigned to intensity values. (c) Color- coded image. (d) Zoom of the South American region.
  • 6.
    6 of 36 Pseudo-Color Image Processing Gray-level to color transformations:  Three different transformations are performed on the gray level image  The results are fed into red, green, and blue guns of a color display  Functional block diagram for pseudo- color image processing. Images fR, fG, and fB are fed into the corresponding red, green, and blue inputs of an RGB color monitor.
  • 7.
    7 of 36 Pseudo-Color Image Processing Pseudo-color enhancement by using the gray level to color transformations
  • 8.
    8 of 36 Pseudo-Color Image Processing Transformation functions used to obtain the pseudo-color images in Fig. on slide 7.
  • 9.
    9 of 36 Pseudo-Color Image Processing Filtering approach  Similar to the pervious approach.  Fourier transform of a gray-level image is modified independently by three filter functions  Three images are generated that are fed into red, green, and blue guns of a color display FT
  • 10.
    10 of 36 Pseudo-Color Image Processing A pseudo-color coding approach using multiple grayscale images. The inputs are grayscale images. The outputs are the three components of an RGB composite image.
  • 11.
    11 of 36 Pseudo-Color Image Processing (a)–(d) Red (R), green (G), blue (B), and near-infrared (IR) components of a LANDSAT multispectral image of the Washington, D.C. area. (e) RGB color composite image obtained using the IR, G, and B component images. (f) RGB color composite image obtained using the R, IR, and B component images.
  • 12.
    12 of 36 Pseudo-Color Image Processing (a) Pseudo-color rendition of Jupiter Moon Io. (b) A close-up.
  • 13.
    13 of 36 Basic of Full-ColorImage Processing  Two methods:  Per-color-component processing: process each component separately.  Vector processing: treat each pixel as a vector to be processed.  Let c represent an arbitrary vector in RGB color space:  For an image of size M × N , there areMN such vectors, c(x, y), for x = 0 1 2 , , , , … M - 1 and y = 0 1 2 , , , , . … N - 1
  • 14.
    14 of 36 Basic of Full-ColorImage Processing  Spatial neighborhoods for grayscale and RGB color images. Observe in (b) that a single pair of spatial coordinates, (x, y), addresses the same spatial location in all three images.  The points have more than two components, we call them voxels.
  • 15.
    15 of 36 Basic of Full-ColorImage Processing  A full-color image and its various color-space components.
  • 16.
    16 of 36 Color Transformations  Colortransformation can be represented by the expression: g(x,y)=T[f(x,y)]  f(x,y): input image  g(x,y): processed (output) image  T[*]: an operator on f defined over neighborhood of (x,y).  The pixel values here are triplets or quartets (i.e group of 3 or 4 values)
  • 17.
    17 of 36 Color Transformations  Generalexpression: Si = Ti(ri) i = 1, 2, 3,…., n  ri and Si are variables denoting the color components of f(x,y) and g(x,y) at any point (x,y).  n is the no of color components  Ti is a set of transformation or color mapping  functions.  Note that n transformations combine to produce a single transformation T
  • 18.
    18 of 36 Color Transformations  Thecolor space chosen determine the value of n.  If RGB color space is selected then n = 3 & r1,r2,r3 denotes the red, blue and green components of the image.  If CMYK color space is selected then n = 4 & r1,r2,r3,r4 denotes the cyan, hue, magenta and black components of the image.  Suppose we want to modify the intensity of the given image  using g(x,y) = k*f(x,y) where 0 < k < 1
  • 19.
    19 of 36 Color Transformations  InHSI color space this can be done with the simple transformation s3=k*r3 where s1=r1 and s2=r2 Only intensity component r3 is modified.  In RGB color space 3 components must be transformed: si=k*ri i=1,2,3.  In CMY color space 3 components must be transformed: si=k*ri + (1-k) i=1,2,3.  Using k=0.7 the intensity of an image is decreased by 30%.
  • 20.
    20 of 36 Color Transformations  Adjustingthe intensity of an image using color transformations. (a) Original image. (b) Result of decreasing its intensity by 30% (i.e., letting k = 0.7). (c) The required RGB mapping function. (d)–(e) The required CMYK mapping functions. (f) The required CMY mapping function. (g)–(h) The required HSI mapping functions
  • 21.
    21 of 36 Color Complements  Thehues directly opposite one another on the color circle are called complements  Color complements are useful for enhancing detail that is embedded in dark regions of a color image
  • 22.
    22 of 36 Color Complements  Colorcomplement transformations. (a) Original image. (b) Complement transformation functions. (c) Complement of (a) based on the RGB mapping functions. (d) An approximation of the RGB complement using HSI transformations.
  • 23.
    23 of 36  Highlighting aspecific range of colors in an image is useful for separating object from their surrounding.  The simplest way to “slice” a color image is to map the colors outside some range of interest to a non- prominent neutral color (e.g., (R, G, B)=(0.5, 0.5, 0.5)). If the colors of interest are enclosed by a cube (or hypercube for n>3) of width W and centered at a average color with component the necessary set of transformation is: Color Slicing
  • 24.
    24 of 36  If asphere is used to specify the colors of interest then  Forcing all other colors to the mid point of the reference color space.  In RGB color space, the neural color is (0.5, 0.5, 0.5) Color Slicing
  • 25.
    25 of 36  Color-slicing transformationsthat detect (a) reds within an RGB cube of width W = 0.2549 centered at (0.6863, 0.1608, 0.1922), and (b) reds within an RGB sphere of radius 0.1765 centered at the same point. Pixels outside the cube and sphere were replaced by color (0.5, 0.5, 0.5). Color Slicing
  • 26.
    26 of 36  Tonal correctionsfor flat, light (high key), and dark (low key) color images. Adjusting the red, green, and blue components equally does not always alter the image hues significantly. Tone and Color Corrections
  • 27.
    27 of 36  Color balancinga CMYK image. Tone and Color Corrections
  • 28.
    28 of 36  Equalized thehistogram of each component will results in error color.  Spread the color intensity (I) uniformly, leaving the color themselves (hues) unchanged.  Equalizating the intensity histogram affects the relative appearance of colors in an image.  Increasing the image’s saturation component after the intensity histogram equalization. Histogram Processing
  • 29.
  • 30.
    30 of 36  Let Sxydenote the set of coordinates defining a neighborhood centered at (x, y)in an RGB color space. Color Image Smoothing
  • 31.
    31 of 36  (a) RGBimage. (b) Red component image. (c)Green component. (d) Blue component. Color Image Smoothing
  • 32.
    32 of 36  HSI componentsof the RGB color image in Fig. 6.36(a). (a) Hue. (b) Saturation. (c) Intensity. Color Image Smoothing
  • 33.
    33 of 36  The Laplacianof vector c is Color Image Sharpening
  • 34.
    34 of 36  Image smoothingwith a 5 × 5 averaging kernel. (a) Result of processing each RGB component image. (b) Result of processing the intensity component of the HSI image and converting to RGB. (c) Difference between the two results. Color Image Sharpening
  • 35.
    35 of 36  Color isconveniently represented in the hue image.  Saturation is used as a masking image to isolate further regions of interest in the hue image.  The intensity image is used less frequently for segmentation of color images because it carries no color information. Color Image Segmentation in HSI
  • 36.
    36 of 36  Image segmentationin HSI space. (a) Original. (b) Hue. (c) Saturation. (d) Intensity. (e) Binary saturation mask (black = 0). (f) Product of (b) and (e). (g) Histogram of (f). (h) Segmentation of red components from (a). Color Image Segmentation in HSI
  • 37.
    37 of 36  Segmentation inRGB color space  The measurement of color similarity is the Euclidean distance between two colors z, and a,  A generalization of distance measure is  Where C is the covariance matrix of the samples representative of the color we want to segment. Color Image Segmentation in RGB
  • 38.
    38 of 36  Three approachesfor enclosing data regions for RGB vector segmentation. Color Image Segmentation in RGB
  • 39.
    39 of 36  Segmentation inRGB space. (a) Original image with colors of interest shown enclosed by a rectangle. (b) Result of segmentation in RGB vector space. Color Image Segmentation in RGB
  • 40.
    40 of 36  The gradientoperators introduced is effective for scalar image.  Compute the gradient on individual images and then using the results to form a color image will lead to erroneous results. Color Edge Detection
  • 41.
    41 of 36  (a)–(c) R,G, and B component images, and (d) resulting RGB color image. (e)–(g) R, G, and B component images, and (h) resulting RGB color image. Color Edge Detection
  • 42.
    42 of 36  (a) RGBimage. (b) Gradient computed in RGB color vector space. (c) Gradient image formed by the elementwise sum of three individual gradient images, each computed using the Sobel operators. (d) Difference between (b) and (c). Color Edge Detection
  • 43.
    43 of 36  Component gradientimages of the color image in Fig. on slide 42 (a) Red component, (b) green component, and (c) blue component. Color Edge Detection
  • 44.
    44 of 36  The noisecontent of a color image has the same characteristics in each color channel.  It is possible for color channels to be affected differently by noise. Noise in Color Image
  • 45.
    45 of 36  (a)–(c) Red,green, and blue 8-bit component images corrupted by additive Gaussian noise of mean 0 and standard deviation of 28 intensity levels. (d) Resulting RGB image. Noise in Color Image
  • 46.
    46 of 36  (a) RGBimage with green plane corrupted by salt- and-pepper noise. (b) Hue component of HSI image. (c) Saturation component. (d) Intensity component. Noise in Color Image
  • 47.
    47 of 36  Color image compression. (a)Original RGB image. (b) Result of compressing, then decompressing the image in (a) Noise in Color Image