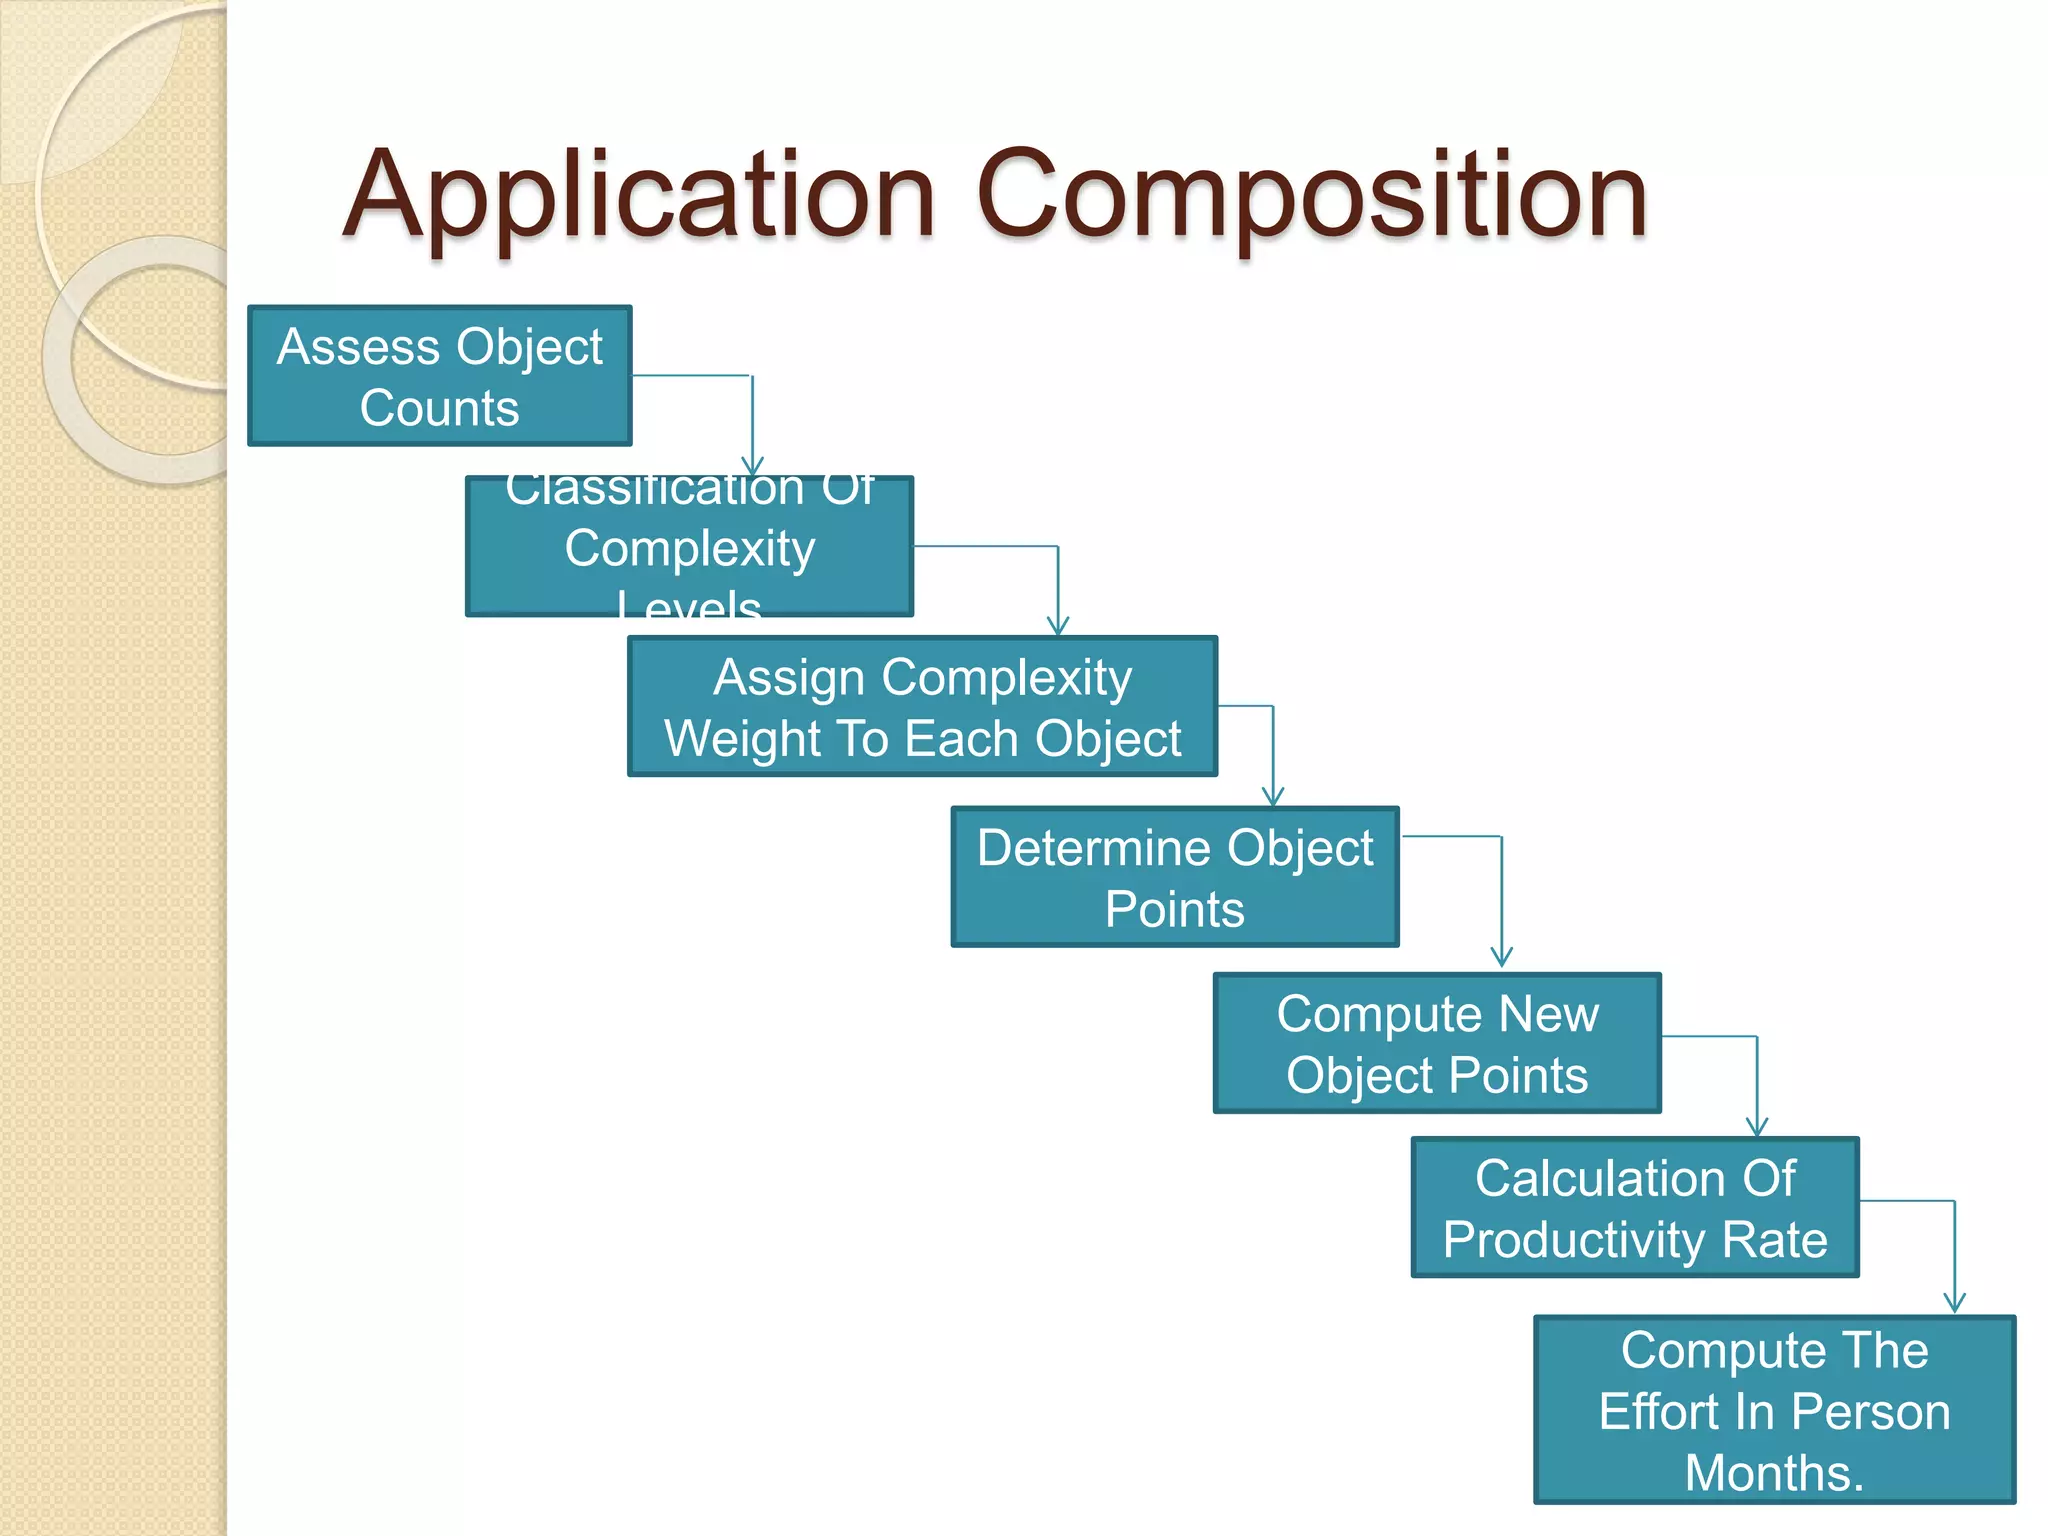
This document summarizes LOC (lines of code), function points, COCOMO I and COCOMO II cost estimation models. It defines LOC and function points for measuring software size. It then describes the Basic, Intermediate and Detailed COCOMO models, which use regression formulas to estimate software development effort based on project size and characteristics. COCOMO II models include Application Composition, Early Design and Post Architecture models. An example calculation is provided for each model.


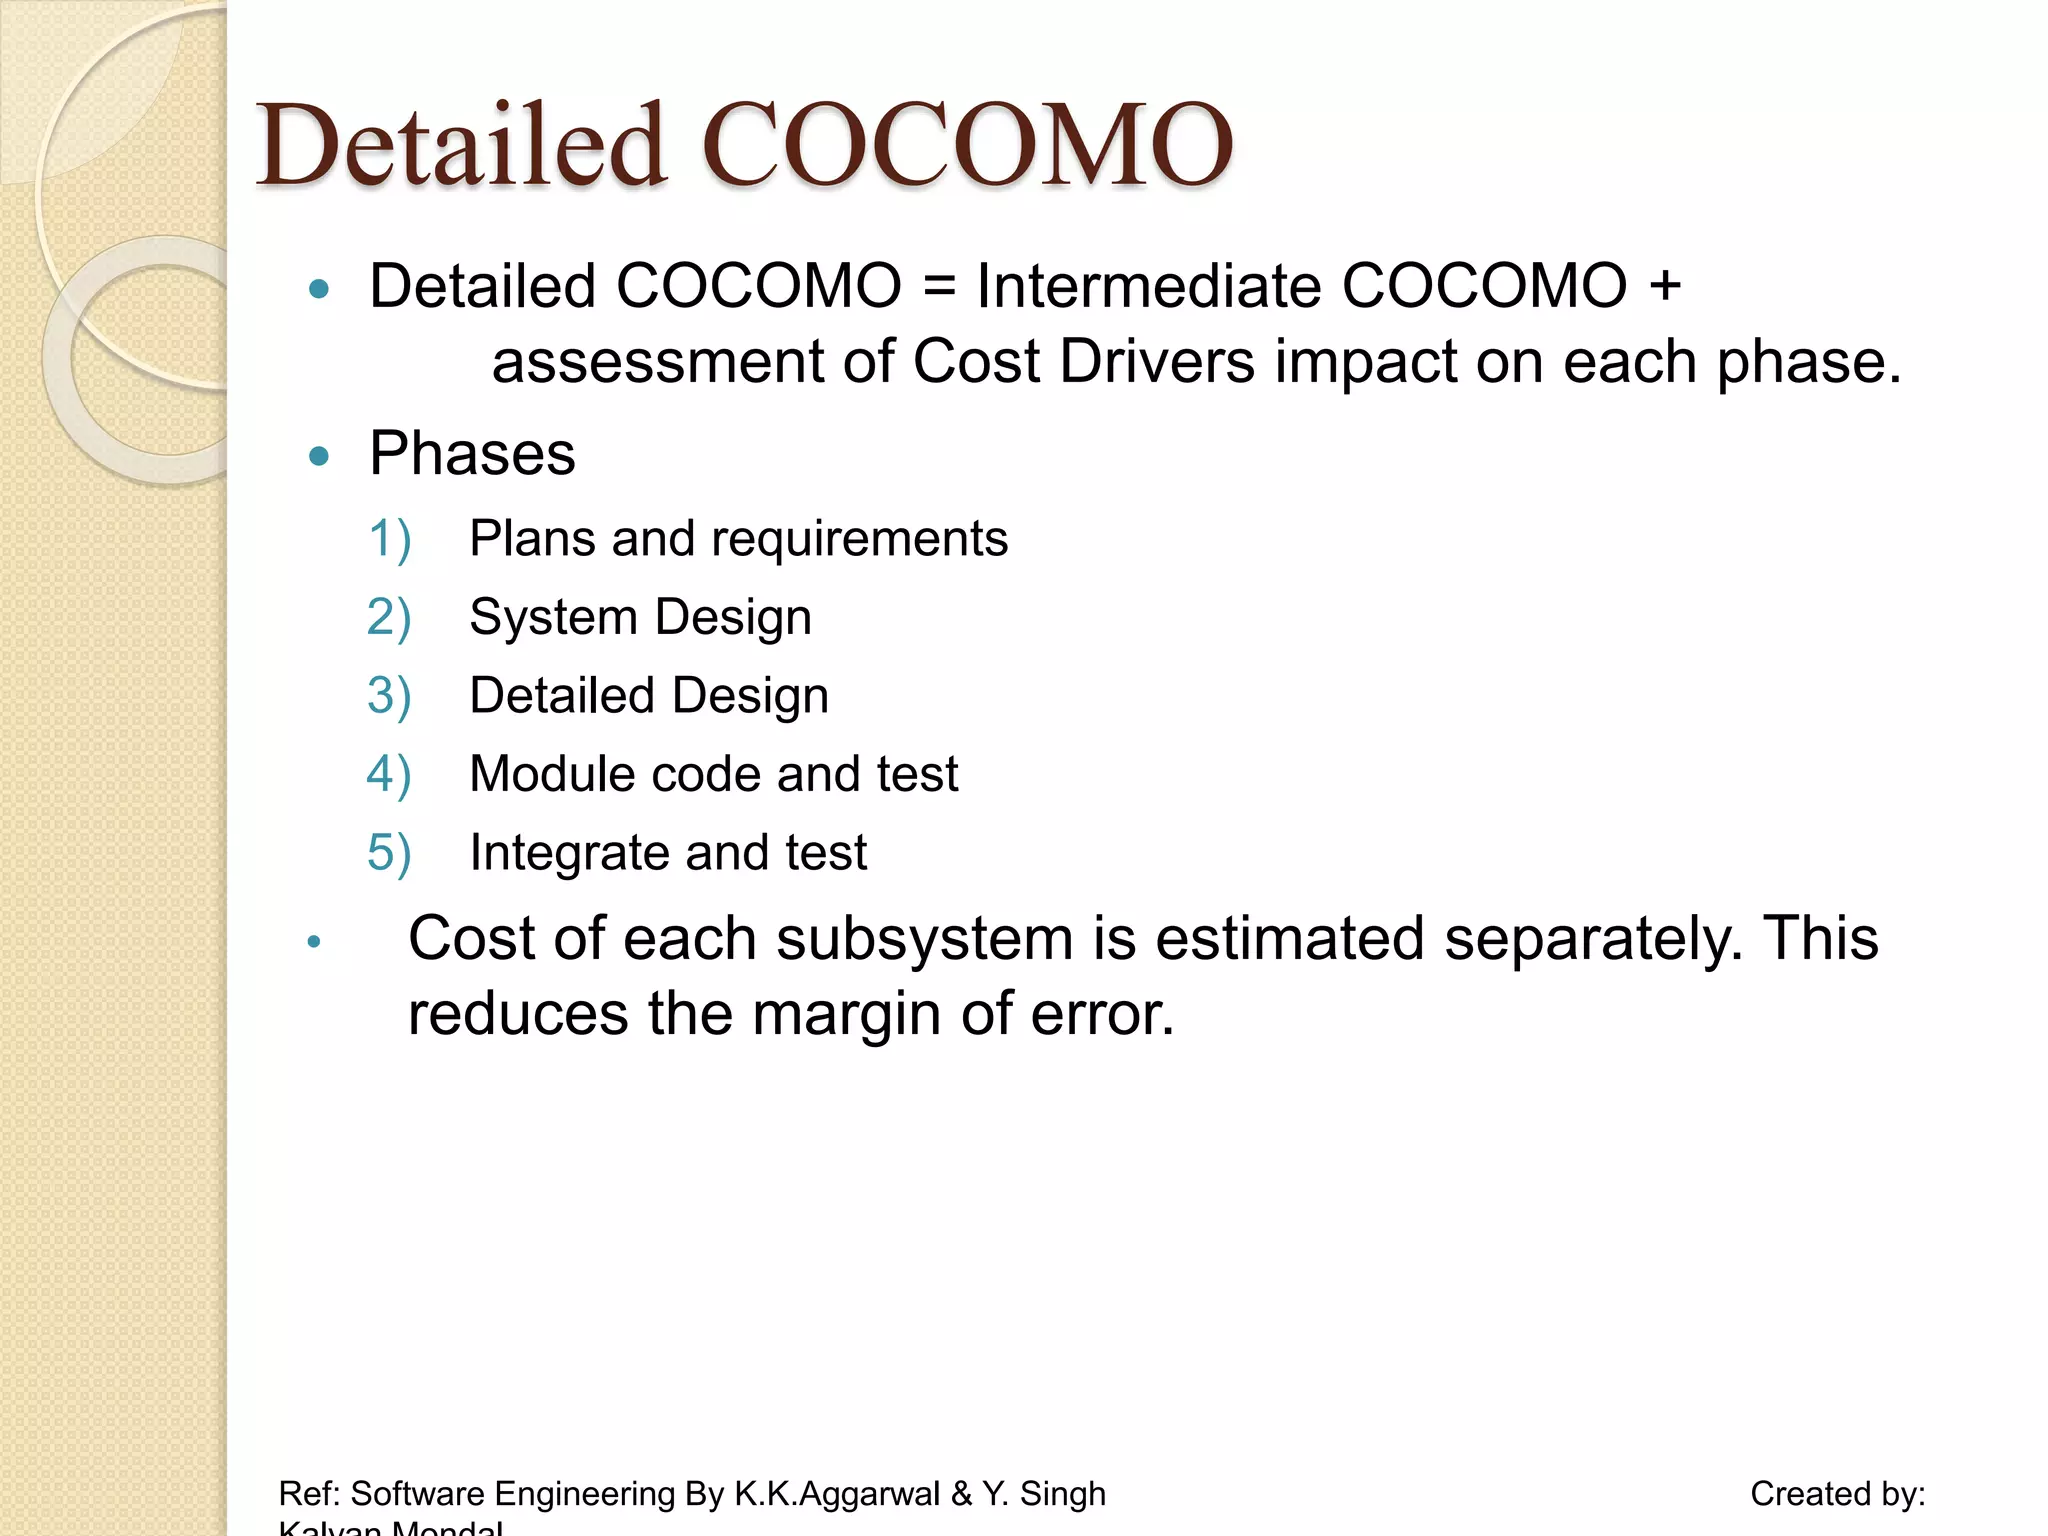
![Detailed COCOMO : Example
Consider a project to develop a full screen editor. The major
components identified and their sizes are (i) Screen Edit – 4K (ii)
Command Lang Interpreter – 2K (iii) File Input and Output – 1K (iv)
Cursor movement – 2K (v) Screen Movement – 3K. Assume the
Required software reliability is high, product complexity is high,
analyst capability is high & programming language experience is
low. Use COCOMO model to estimate cost and time for different
phases.
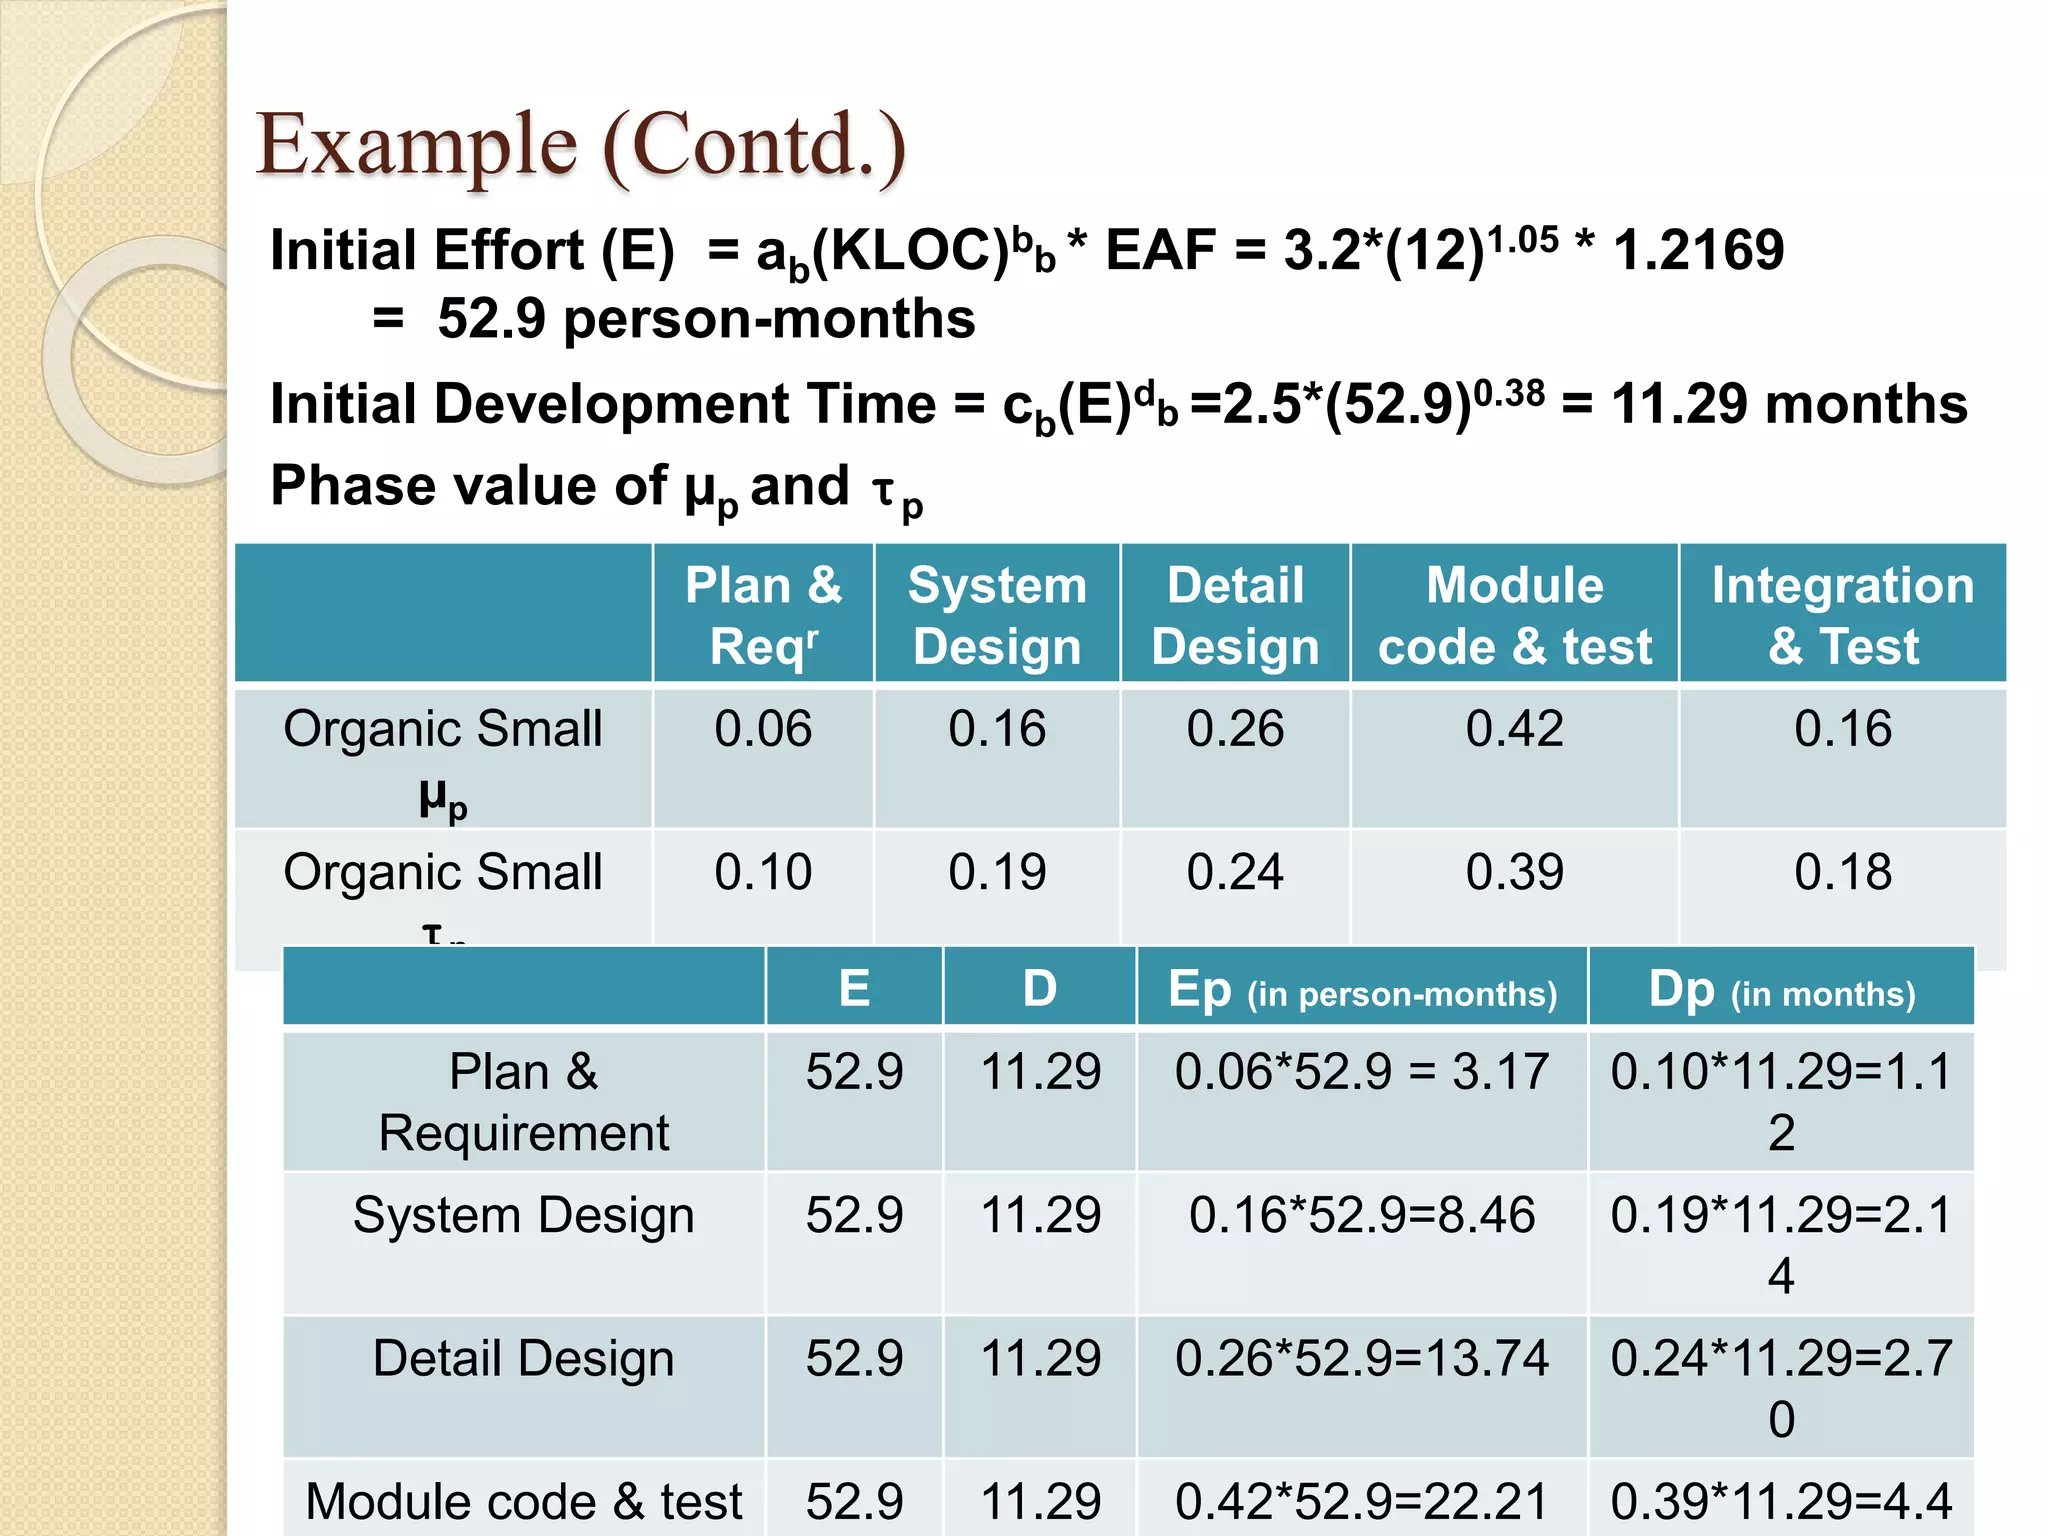
Size of modules : 4 + 2 + 1 + 2 + 3 = 13 KLOC [Organic]
EAF = 1.15 * 1.15 * 0.86 * 1.07 = 1.2169
Cost
Drivers
Very
Low
Low Nominal High Very
High
Extra High
RELY 0.75 0.88 1.00 1.15 1.40 --
CPLX 0.70 0.85 1.00 1.15 1.30 1.65
ACAP 1.46 1.19 1.00 0.86 0.71
LEXP 1.14 1.07 1.00 0.95 -- --
Ref: Software Engineering By K.K.Aggarwal & Y. Singh Created by:](https://image.slidesharecdn.com/4911115-221119090821-07f28156/75/Cocomo-model-20-2048.jpg)


![B = 0.91 + 0.01 * (Sum of rating on scaling factors for the
project)
= 0.91 + 0.01 * (4.96 + 2.03 + 4.24 + 4.38 + 4.68)
= 0.91 + 0.01(20.29)=1.1129
= 2.5 * (50)1.1129 = 194.41 Person-months
here A=2.5 (for COCOMO II.2000) predefined
The 7 cost drivers are:
PDIF = high (1.29) PERS = high (0.83)
RCPX = nominal (1.0) RUSE = nominal (1.0)
PREX = nominal (1.0) FCIL = nominal (1.0)
SCEO = nominal (1.0)
Solution :
= 194.41 * [1.29 x 0.83]
= 194.41 x 1.07
= 208.155 Person months
37
Created by- Karishma Gupta (2012CA55) Ref: Software Engineering By K.K. Aggarwal &
Yogesh Singh](https://image.slidesharecdn.com/4911115-221119090821-07f28156/75/Cocomo-model-37-2048.jpg)