The document contains 12 trigonometric identities to verify. The identities involve trigonometric functions like sine, cosine, tangent, cotangent, secant, and cosecant. They include standard identities like (1 - cos^2(y))(1 + cot^2(y)) = 1 as well as less common identities like tan(β) + cot(β) = sec(β)csc(β). The goal is to practice verifying various trigonometric identities.
El documento presenta una breve descripción de diferentes épocas históricas, incluyendo la Prehistoria (Paleolítico y Neolítico), la Edad Antigua (Egipto y Roma), la Edad Media (Feudalismo), la Edad Moderna (Descubrimiento de América), y la Edad Contemporánea. Cada época se ilustra con imágenes que muestran características clave como pinturas rupestres, utensilios, pirámides, el Coliseo Romano, castillos, barcos de vela,
This document provides a map of Mexico City's metro system. The map shows the metro lines as colored routes across the city and labels over 50 metro station names. Key areas of the city served by metro include Centro Histórico, Polanco, Condesa, Roma, Coyoacán, San Ángel, and others. The metro connects all parts of the massive city and is the primary mode of public transportation.
Estratégias Executivas de Comunicação - Aula 1Thiago Costa
Aula 1 da disciplina Estratégias Executivas de Comunicação, do curso de Publicidade e Propaganda da FAAP. Conteúdo: Introdução à Teoria Geral da Administração
Este documento lista 11 estudiantes y su delegada, y registra su asistencia a 4 tareas de clase y su progreso en 3 proyectos. Proporciona un resumen cuantitativo de la participación de cada estudiante en las actividades del curso.
El documento discute el impacto del Internet en los jóvenes universitarios. Explica que el Internet se ha integrado en la vida cotidiana de los jóvenes y les proporciona recursos educativos y de comunicación. Sin embargo, también plantea algunos riesgos como la exposición a contenidos inadecuados y la adicción. El documento argumenta que el uso excesivo del Internet puede aislar a los jóvenes y reemplazar las interacciones cara a cara, por lo que se debe fomentar un uso moderado y responsable de la tecnolog
This document provides stock market index data from December 10, 2009. It includes performance summaries for major US indexes such as the S&P 500, Nasdaq 100, and Russell 1000 and 3000. Most indexes were up over the past day, week and months. The majority of constituent stocks for each index closed above their short-term and long-term moving averages.
The document appears to be analyzing the short term, intermediate term, and long term technical indicators and trends for various stock market indexes and commodities. In the short term, most indexes are showing bearish trends and positioning, with the S&P 500, Nasdaq, and Dow all bearing short. In the intermediate term, some indexes are showing bullish trends like the Nasdaq, while others like gold remain bearish. In the long term, trends are more mixed with several commodities like oil and gold remaining in bearish trends while indexes like the Nasdaq and small caps show bullish positioning long term.
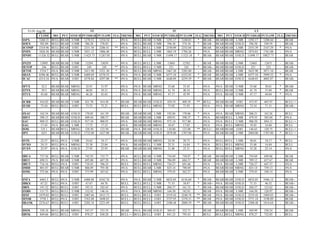
The document provides market index data from several US stock market indices as of Wednesday, December 9th, 2009. It includes data on the S&P 100, Nasdaq 100, S&P 500, Russell 1000, Russell 2000, and Russell 3000 indices, showing statistics such as price changes, moving averages, highs and lows, and other performance metrics. The indices showed price increases ranging from 2.26% to 29% compared to previous levels.
The document appears to be analyzing the short term, intermediate term, and long term technical indicators and trends for various stock market indexes and commodities. In the short term, most indexes are showing bearish trends and stochastic indicators in oversold territory. In the intermediate term, some indexes and commodities are showing bullish trends and moving averages in bullish territory. In the long term, several indexes and commodities have bearish trends and stochastic indicators in oversold territory again.
This document provides a map of Mexico City's metro system. The map shows the metro lines as colored routes across the city and labels over 50 metro station names. Key areas of the city served by metro include Centro Histórico, Polanco, Condesa, Roma, Coyoacán, San Ángel, and others. The metro connects all parts of the massive city and is the primary mode of public transportation.
Estratégias Executivas de Comunicação - Aula 1Thiago Costa
Aula 1 da disciplina Estratégias Executivas de Comunicação, do curso de Publicidade e Propaganda da FAAP. Conteúdo: Introdução à Teoria Geral da Administração
Este documento lista 11 estudiantes y su delegada, y registra su asistencia a 4 tareas de clase y su progreso en 3 proyectos. Proporciona un resumen cuantitativo de la participación de cada estudiante en las actividades del curso.
El documento discute el impacto del Internet en los jóvenes universitarios. Explica que el Internet se ha integrado en la vida cotidiana de los jóvenes y les proporciona recursos educativos y de comunicación. Sin embargo, también plantea algunos riesgos como la exposición a contenidos inadecuados y la adicción. El documento argumenta que el uso excesivo del Internet puede aislar a los jóvenes y reemplazar las interacciones cara a cara, por lo que se debe fomentar un uso moderado y responsable de la tecnolog
This document provides stock market index data from December 10, 2009. It includes performance summaries for major US indexes such as the S&P 500, Nasdaq 100, and Russell 1000 and 3000. Most indexes were up over the past day, week and months. The majority of constituent stocks for each index closed above their short-term and long-term moving averages.
The document appears to be analyzing the short term, intermediate term, and long term technical indicators and trends for various stock market indexes and commodities. In the short term, most indexes are showing bearish trends and positioning, with the S&P 500, Nasdaq, and Dow all bearing short. In the intermediate term, some indexes are showing bullish trends like the Nasdaq, while others like gold remain bearish. In the long term, trends are more mixed with several commodities like oil and gold remaining in bearish trends while indexes like the Nasdaq and small caps show bullish positioning long term.
The document provides market index data from several US stock market indices as of Wednesday, December 9th, 2009. It includes data on the S&P 100, Nasdaq 100, S&P 500, Russell 1000, Russell 2000, and Russell 3000 indices, showing statistics such as price changes, moving averages, highs and lows, and other performance metrics. The indices showed price increases ranging from 2.26% to 29% compared to previous levels.
The document appears to be analyzing the short term, intermediate term, and long term technical indicators and trends for various stock market indexes and commodities. In the short term, most indexes are showing bearish trends and stochastic indicators in oversold territory. In the intermediate term, some indexes and commodities are showing bullish trends and moving averages in bullish territory. In the long term, several indexes and commodities have bearish trends and stochastic indicators in oversold territory again.
The document appears to be a market analysis report that provides technical indicators for various stock market indexes and commodities across short, medium, and long-term timeframes. It lists the closing price, momentum, position, stochastic, high/low values and trend indicators. Most indexes and commodities are shown to be in a bearish position in the short-term, with some turning bullish in the medium and long-term according to the indicators.
The document provides market index data from several US stock market indices as of Wednesday, December 9th, 2009. It includes data on the S&P 100, Nasdaq 100, S&P 500, Russell 1000, Russell 2000, and Russell 3000 indices, showing statistics such as price changes, moving averages, highs and lows, and advancing vs declining stocks. All indices showed price increases from 26-29% over the past year except the Russell 2000 which was up only 2.26%.
The document appears to be a market analysis report that provides technical indicators for various stock market indexes and commodities across short, medium, and long-term timeframes. It lists the closing price, momentum, position, stochastic, high/low values and trend indicators. Most indexes and commodities are shown to be in a bearish position in the short-term, with some turning bullish in the medium and long-term according to the indicators.
The document provides market index data and statistics for several US stock market indices as of Tue 08-Dec-09. It includes details on the S&P 100, Nasdaq 100, S&P 500, Russell 1000, Russell 2000, and Russell 3000 indices such as price changes, percentage of advancers and decliners, moving average positions, and high/low breakouts. The statistics indicate overall declines across the indices compared to the prior period.
The document provides stock market index data from various US stock exchanges. It shows that on December 7th, 2009, most major indexes were down between 8-15% and trading volumes were also down significantly, between 40-70% lower than normal levels. The S&P 500 fell the least at 8.4% while the Nasdaq 100 dropped the most with a 15% decline. Most indexes had over 50% of their components trading below their moving averages.
The document provides technical analysis data for various stock market indexes and commodities. It includes the closing price, momentum, position, stochastic readings, potential high and low values, and trend indicators for short, intermediate, and long term timeframes. Overall the data suggests bearish momentum in the short term that could turn bullish in the intermediate to long term for many of the assets according to the indicators.
This document provides technical analysis indicators for various stock market indexes and commodities for short-term (ST), intermediate-term (IT), and long-term (LT) time frames as of December 4, 2009. It lists the closing price, momentum, private comments on the stochastic indicator, and other technical analysis metrics. Most indexes and commodities are shown to be in bullish trends for the IT and LT time frames.
This document provides market index data for several US stock market indices as of Friday, December 4th, 2009. It includes data on the S&P 100, Nasdaq 100, S&P 500, Russell 1000, Russell 2000, and Russell 3000 indices such as price changes, percentage of stocks trading above or below moving averages, high and low prices, and breakout statistics. Overall, the indices showed strong gains over various periods with many component stocks trading above common technical indicators.
The document provides market index data for several US stock market indices as of Thursday, December 3, 2009. It includes daily and weekly statistics on price movement, trading volume, and percentages of stocks within each index that are above or below moving averages. The S&P 500 and other major indices saw price declines of around 60% compared to the prior day/week, with most individual stocks also lower. Trading volume was up modestly for most indices.
The document provides stock market index data from various US stock exchanges as of Wednesday, December 2nd, 2009. It includes performance summaries and statistics for the S&P 100, Nasdaq 100, S&P 500, Russell 1000, Russell 2000, and Russell 3000 indexes. The indexes were up or down modestly for the day and week, with various percentages of constituent stocks trading above or below moving averages.
The document provides stock market index data for several major US stock indexes as of December 1, 2009. It includes daily and weekly performance statistics as well as information on moving averages and highs/lows for indexes such as the S&P 500, Nasdaq 100, Russell 1000 and 2000, and S&P 100 over various periods from 3 days to over 200 weeks. All indexes showed strong positive performance over the past week and month according to the data presented.
The document provides stock market data and analysis for various indices and sectors. It includes closing prices, momentum indicators, and short-term, intermediate-term, and long-term outlooks. Most indices and sectors are shown to be in bullish trends in the short-term and intermediate-term with neutral or bearish signals in some cases in the long-term.
This document provides technical analysis data for various stock market indexes and commodities. It includes the closing price, momentum, private analysis of short-term, intermediate-term and long-term trends including whether the trend is bullish, bearish or neutral. Most indexes and commodities were in a bearish short-term trend as of the date listed at the top (Nov 30, 2009).
The document provides stock market index data for several major US stock indices including the S&P 100, Nasdaq 100, S&P 500, Russell 1000, Russell 2000, and Russell 3000. It includes daily and weekly statistics such as price changes, moving averages, highs and lows, and breakouts for each index. The data shows most indices experiencing large negative price changes and high percentages of stocks trading below moving averages and breaking below previous lows.
The document provides technical analysis data for various stock market indexes and commodities. It analyzes the short-term (ST), intermediate-term (IT), and long-term (LT) trends as well as momentum, position, and other indicators. Most markets are showing bearish short-term trends according to the data, though some indexes and commodities related to gold and silver are bullish in the short or intermediate-term.
The document provides market index data from November 25, 2009. It includes performance summaries for major US stock indexes such as the S&P 500, Nasdaq 100, Russell 1000 and Russell 2000. The indexes showed mixed performance for the day, week and period averages, with some up over 50% for the year and others down nearly 30%. Moving averages and technical indicators are also given for each index.
How to Setup Default Value for a Field in Odoo 17Celine George
In Odoo, we can set a default value for a field during the creation of a record for a model. We have many methods in odoo for setting a default value to the field.
How to Manage Reception Report in Odoo 17Celine George
A business may deal with both sales and purchases occasionally. They buy things from vendors and then sell them to their customers. Such dealings can be confusing at times. Because multiple clients may inquire about the same product at the same time, after purchasing those products, customers must be assigned to them. Odoo has a tool called Reception Report that can be used to complete this assignment. By enabling this, a reception report comes automatically after confirming a receipt, from which we can assign products to orders.
CapTechTalks Webinar Slides June 2024 Donovan Wright.pptxCapitolTechU
Slides from a Capitol Technology University webinar held June 20, 2024. The webinar featured Dr. Donovan Wright, presenting on the Department of Defense Digital Transformation.
This document provides an overview of wound healing, its functions, stages, mechanisms, factors affecting it, and complications.
A wound is a break in the integrity of the skin or tissues, which may be associated with disruption of the structure and function.
Healing is the body’s response to injury in an attempt to restore normal structure and functions.
Healing can occur in two ways: Regeneration and Repair
There are 4 phases of wound healing: hemostasis, inflammation, proliferation, and remodeling. This document also describes the mechanism of wound healing. Factors that affect healing include infection, uncontrolled diabetes, poor nutrition, age, anemia, the presence of foreign bodies, etc.
Complications of wound healing like infection, hyperpigmentation of scar, contractures, and keloid formation.
Temple of Asclepius in Thrace. Excavation resultsKrassimira Luka
The temple and the sanctuary around were dedicated to Asklepios Zmidrenus. This name has been known since 1875 when an inscription dedicated to him was discovered in Rome. The inscription is dated in 227 AD and was left by soldiers originating from the city of Philippopolis (modern Plovdiv).
🔥🔥🔥🔥🔥🔥🔥🔥🔥
إضغ بين إيديكم من أقوى الملازم التي صممتها
ملزمة تشريح الجهاز الهيكلي (نظري 3)
💀💀💀💀💀💀💀💀💀💀
تتميز هذهِ الملزمة بعِدة مُميزات :
1- مُترجمة ترجمة تُناسب جميع المستويات
2- تحتوي على 78 رسم توضيحي لكل كلمة موجودة بالملزمة (لكل كلمة !!!!)
#فهم_ماكو_درخ
3- دقة الكتابة والصور عالية جداً جداً جداً
4- هُنالك بعض المعلومات تم توضيحها بشكل تفصيلي جداً (تُعتبر لدى الطالب أو الطالبة بإنها معلومات مُبهمة ومع ذلك تم توضيح هذهِ المعلومات المُبهمة بشكل تفصيلي جداً
5- الملزمة تشرح نفسها ب نفسها بس تكلك تعال اقراني
6- تحتوي الملزمة في اول سلايد على خارطة تتضمن جميع تفرُعات معلومات الجهاز الهيكلي المذكورة في هذهِ الملزمة
واخيراً هذهِ الملزمة حلالٌ عليكم وإتمنى منكم إن تدعولي بالخير والصحة والعافية فقط
كل التوفيق زملائي وزميلاتي ، زميلكم محمد الذهبي 💊💊
🔥🔥🔥🔥🔥🔥🔥🔥🔥
A Free 200-Page eBook ~ Brain and Mind Exercise.pptxOH TEIK BIN
(A Free eBook comprising 3 Sets of Presentation of a selection of Puzzles, Brain Teasers and Thinking Problems to exercise both the mind and the Right and Left Brain. To help keep the mind and brain fit and healthy. Good for both the young and old alike.
Answers are given for all the puzzles and problems.)
With Metta,
Bro. Oh Teik Bin 🙏🤓🤔🥰