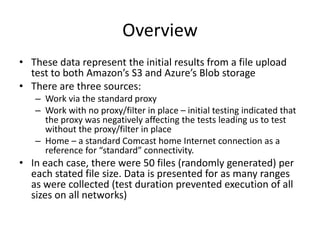
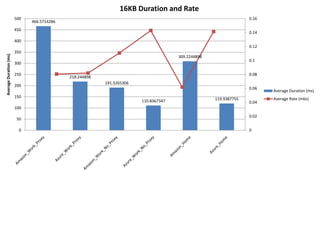
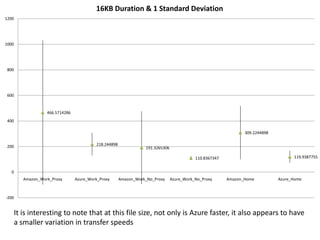
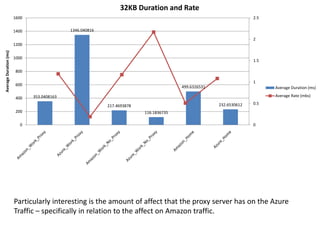
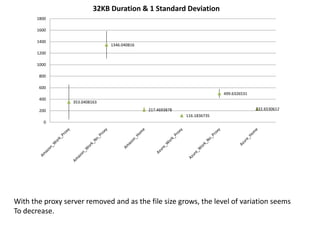
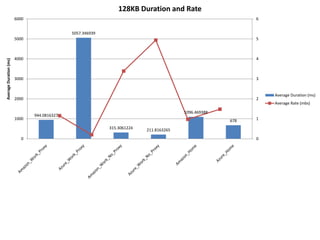
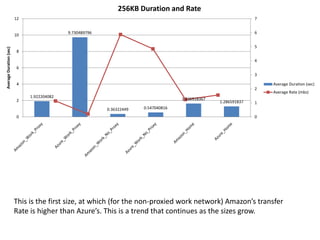
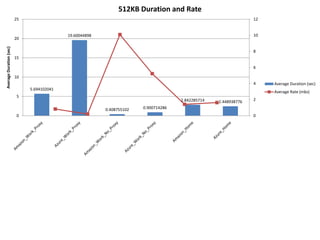
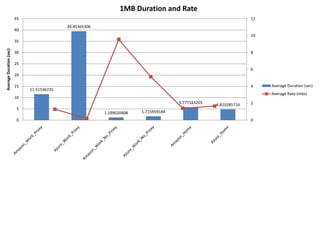
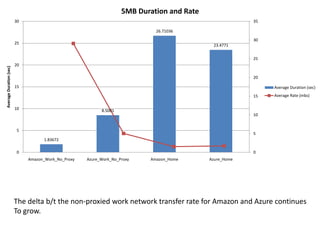
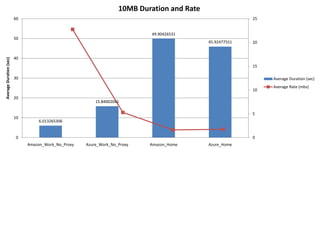
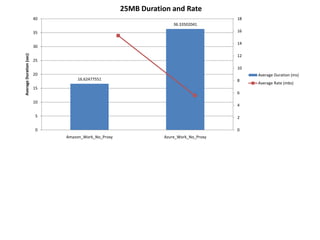
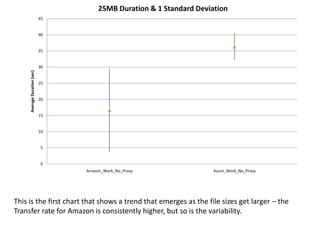
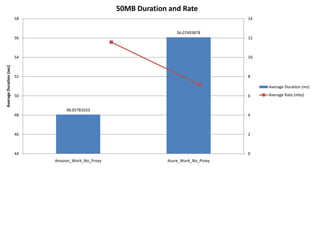
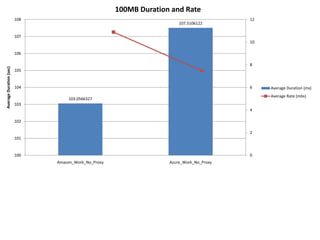
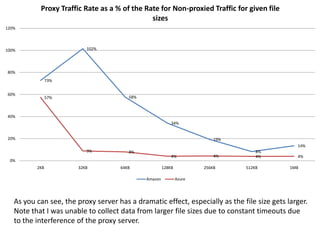
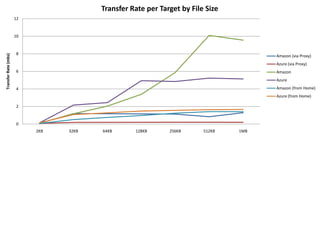
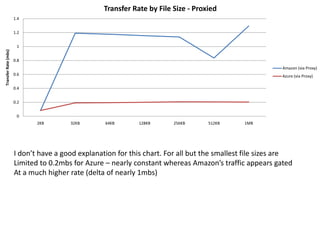
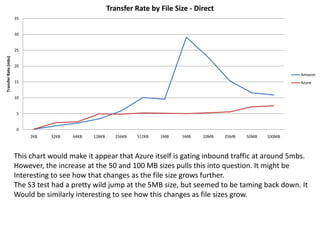
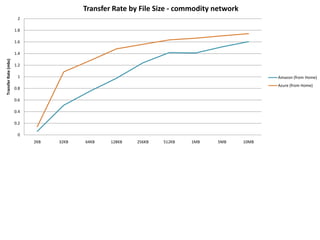
Initial Cloud Upload TestsRandomly-generated files 50 tests per data point
OverviewThese data represent the initial results from a file upload test to both Amazon’s S3 and Azure’s Blob storageThere are three sources:Work via the standard proxyWork with no proxy/filter in place – initial testing indicated that the proxy was negatively affecting the tests leading us to test without the proxy/filter in placeHome – a standard Comcast home Internet connection as a reference for “standard” connectivity.In each case, there were 50 files (randomly generated) per each stated file size. Data is presented for as many ranges as were collected (test duration prevented execution of all sizes on all networks)
It is interesting to note that at this file size, not only is Azure faster, it also appears to havea smaller variation in transfer speeds
Particularly interesting is the amount of affect that the proxy server has on the Azuretraffic – specifically in relation to the affect on Amazon traffic.
With the proxy server removed and as the file size grows, the level of variation seemsto decrease.
Continued indication of a specific hit on the Azure platform by the proxy server
This is the first size, at which (for the non-proxied work network) Amazon’s transfer rate is higher than Azure’s. This is a trend that continues as the sizes grow.
The delta b/t the non-proxied work network transfer rate for Amazon and Azure continuesto grow.
This is the first chart that shows a trend that emerges as the file sizes get larger – the transfer rate for Amazon is consistently higher, but so is the variability.
In this case, you see that the variability in the rate for Amazon makes it less interesting dueto the fact that even though the average is better than Azure, the upper bound of the firststandard deviation is significantly worse than the same for Azure.
Similar to the case for the 50MB size. The average for Amazon is higher, but the variationband is significantly broader.
As you can see, the proxy server has a dramatic effect, especially as the file size gets larger.Note that I was unable to collect data from larger file sizes due to constant timeouts due to the interference of the proxy server.
I don’t have a good explanation for this chart. For all but the smallest file sizes are limited to 0.2mbs for Azure – nearly constant whereas Amazon’s traffic appears gated at a much higher rate (delta of nearly 1mbs)
This chart would make it appear that Azure itself is gating inbound traffic at around 5mbs.However, the increase at the 50 and 100 MB sizes pulls this into question. It might be interesting to see how that changes as the file size grows further.The S3 test had a pretty wild jump at the 5MB size, but seemed to be taming back down. Itwould be similarly interesting to see how this changes as file sizes grow.
Cloud Storage Cross Test

Cloud Storage Cross Test

  • 1.
    Initial Cloud UploadTestsRandomly-generated files 50 tests per data point
  • 2.
    OverviewThese data representthe initial results from a file upload test to both Amazon’s S3 and Azure’s Blob storageThere are three sources:Work via the standard proxyWork with no proxy/filter in place – initial testing indicated that the proxy was negatively affecting the tests leading us to test without the proxy/filter in placeHome – a standard Comcast home Internet connection as a reference for “standard” connectivity.In each case, there were 50 files (randomly generated) per each stated file size. Data is presented for as many ranges as were collected (test duration prevented execution of all sizes on all networks)
  • 4.
    It is interestingto note that at this file size, not only is Azure faster, it also appears to havea smaller variation in transfer speeds
  • 5.
    Particularly interesting isthe amount of affect that the proxy server has on the Azuretraffic – specifically in relation to the affect on Amazon traffic.
  • 6.
    With the proxyserver removed and as the file size grows, the level of variation seemsto decrease.
  • 7.
    Continued indication ofa specific hit on the Azure platform by the proxy server
  • 11.
    This is thefirst size, at which (for the non-proxied work network) Amazon’s transfer rate is higher than Azure’s. This is a trend that continues as the sizes grow.
  • 17.
    The delta b/tthe non-proxied work network transfer rate for Amazon and Azure continuesto grow.
  • 22.
    This is thefirst chart that shows a trend that emerges as the file sizes get larger – the transfer rate for Amazon is consistently higher, but so is the variability.
  • 24.
    In this case,you see that the variability in the rate for Amazon makes it less interesting dueto the fact that even though the average is better than Azure, the upper bound of the firststandard deviation is significantly worse than the same for Azure.
  • 26.
    Similar to thecase for the 50MB size. The average for Amazon is higher, but the variationband is significantly broader.
  • 27.
    As you cansee, the proxy server has a dramatic effect, especially as the file size gets larger.Note that I was unable to collect data from larger file sizes due to constant timeouts due to the interference of the proxy server.
  • 29.
    I don’t havea good explanation for this chart. For all but the smallest file sizes are limited to 0.2mbs for Azure – nearly constant whereas Amazon’s traffic appears gated at a much higher rate (delta of nearly 1mbs)
  • 30.
    This chart wouldmake it appear that Azure itself is gating inbound traffic at around 5mbs.However, the increase at the 50 and 100 MB sizes pulls this into question. It might be interesting to see how that changes as the file size grows further.The S3 test had a pretty wild jump at the 5MB size, but seemed to be taming back down. Itwould be similarly interesting to see how this changes as file sizes grow.