![05561 Cloud Transfer Tests Research Institution Test 01 Local Connection: Research Networks Started: Feb 8, 2010 Finished: Feb 16, 2010 Origination Point: Oak Ridge, TN Data collected/assembled by Rob Gillen, Computer Science Research Group, Oak Ridge National Laboratory, Oak Ridge TN. Questions should be directed to [email_address]](https://image.slidesharecdn.com/05561xfer-research01-100216154847-phpapp01/85/05561-Xfer-Research-01-1-320.jpg)


![Data collected/assembled by Rob Gillen, Computer Science Research Group, Oak Ridge National Laboratory, Oak Ridge TN. Questions should be directed to [email_address]](https://image.slidesharecdn.com/05561xfer-research01-100216154847-phpapp01/85/05561-Xfer-Research-01-173-320.jpg)

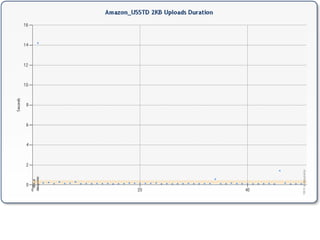
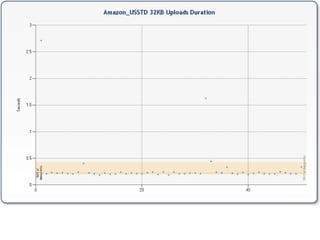
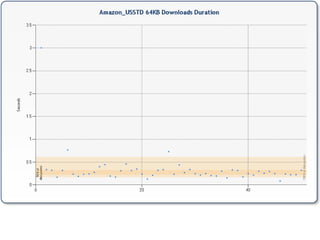
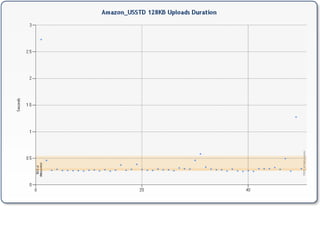
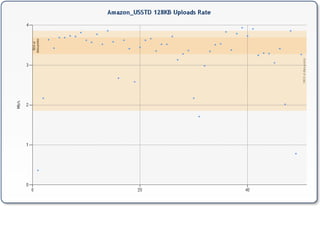
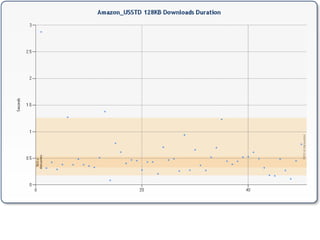
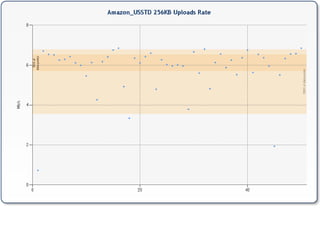
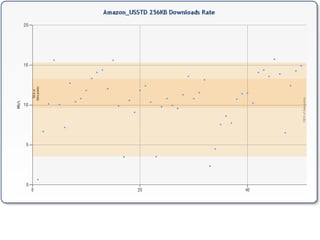
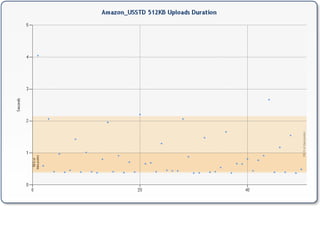
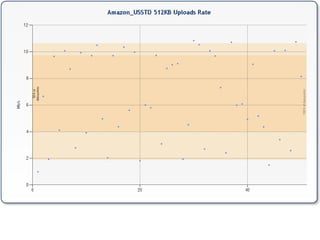
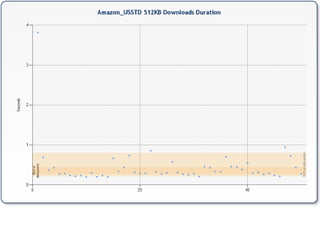
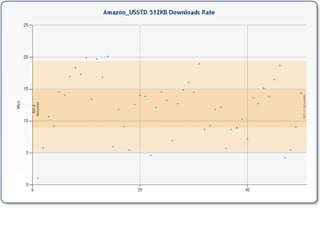
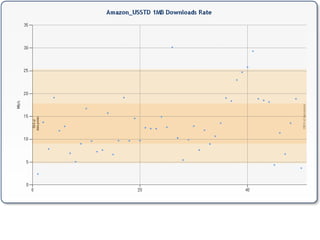
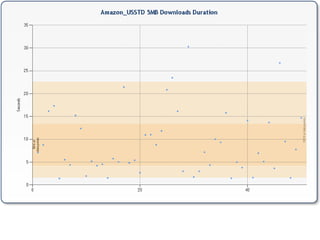
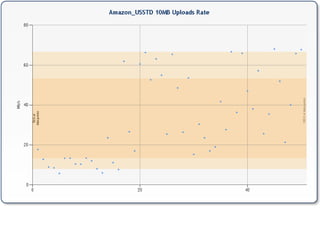
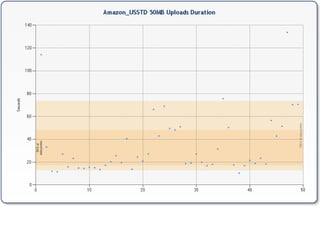
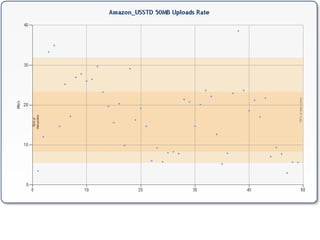
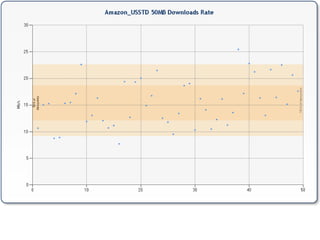
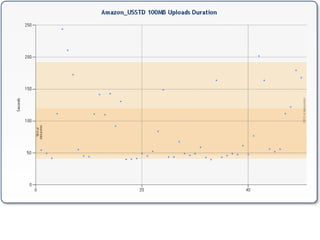
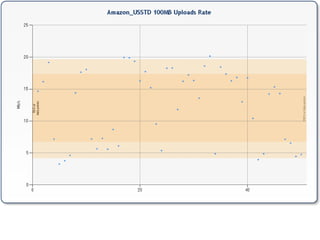
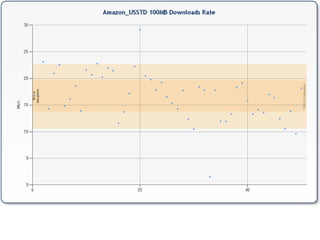
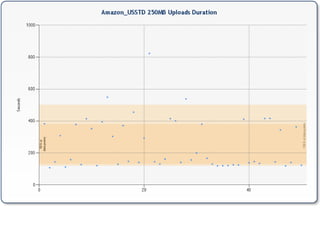
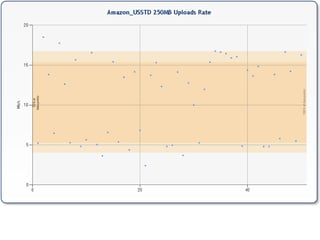
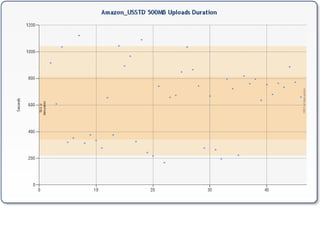
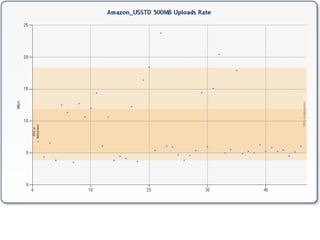
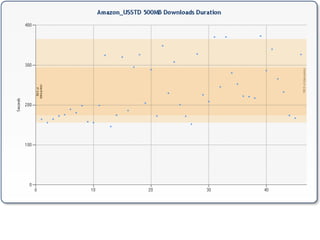
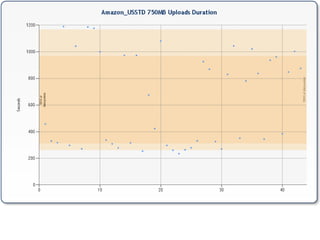
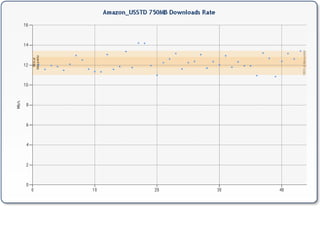
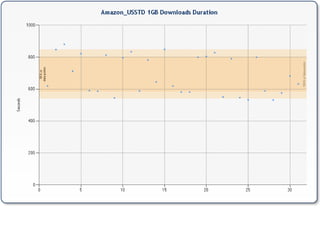
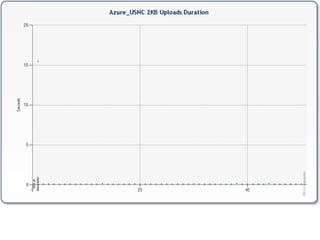
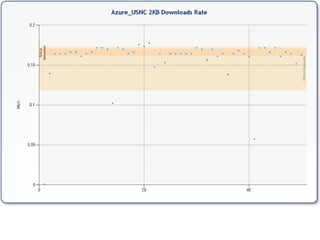
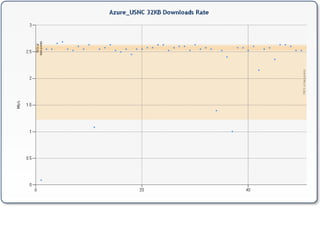
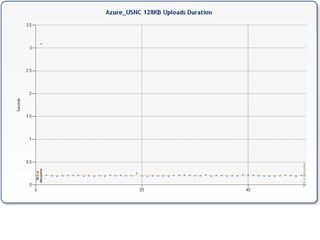
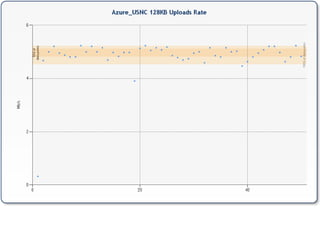
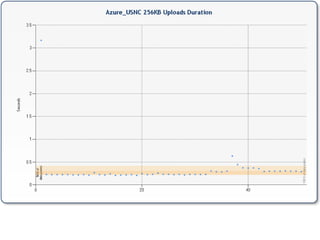
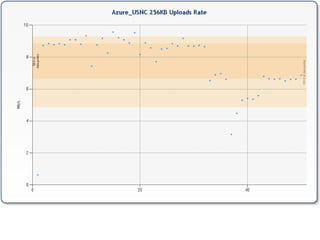
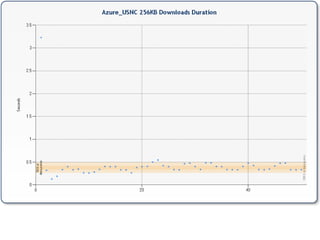
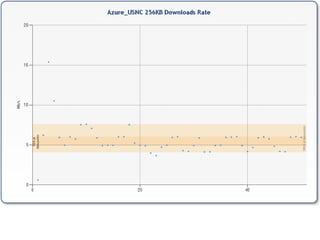
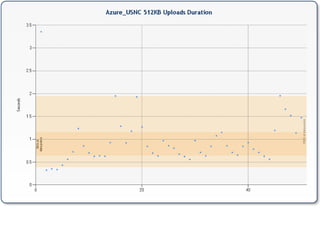
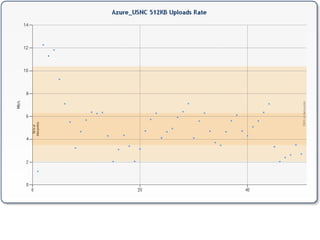
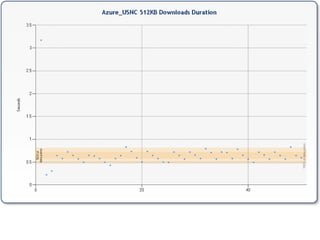
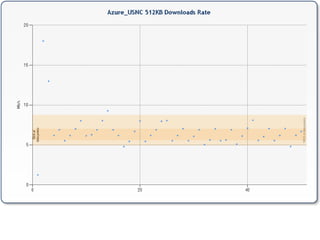
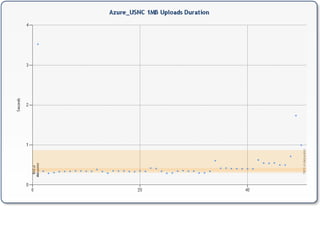
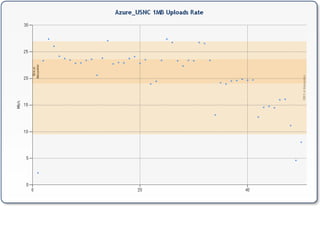
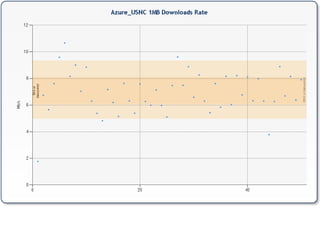
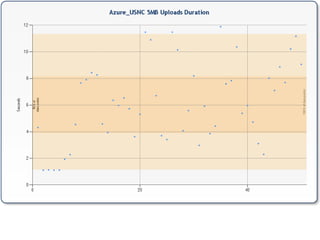
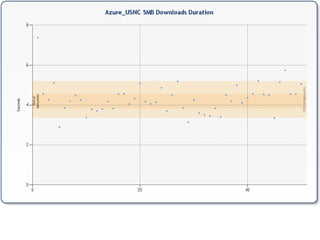
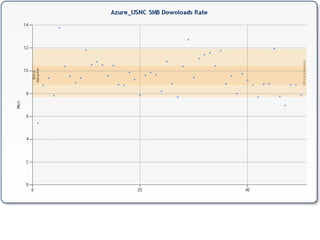
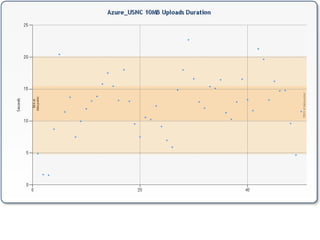
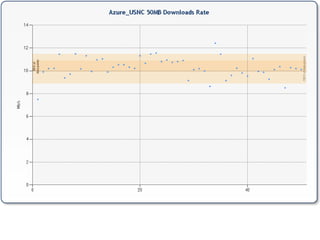
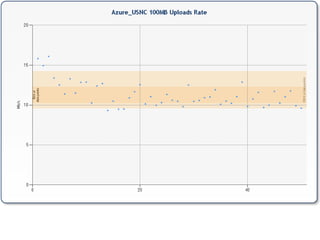
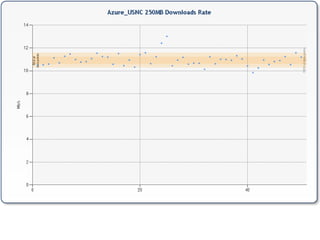
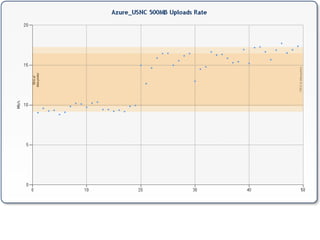
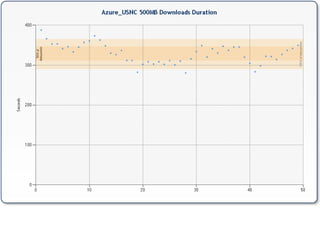
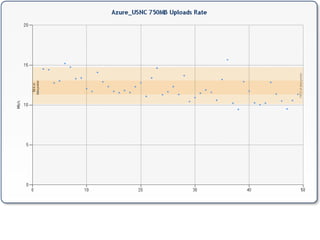
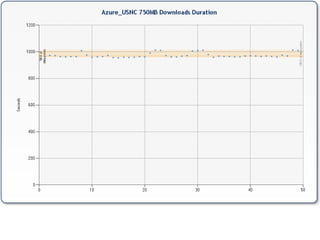
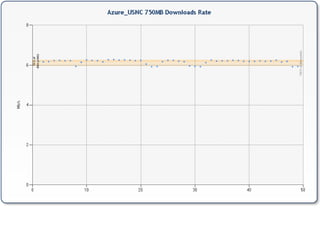
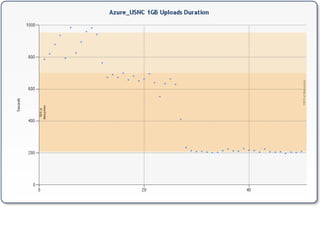
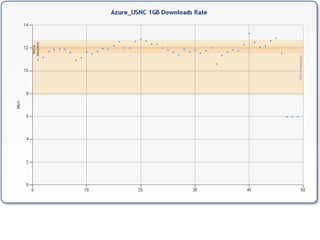
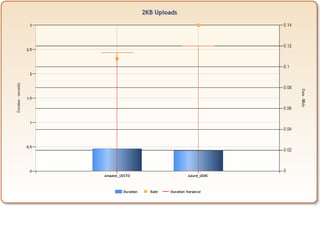
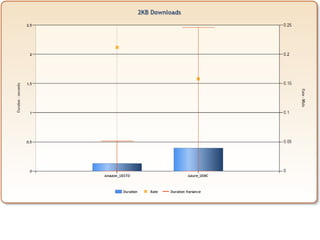
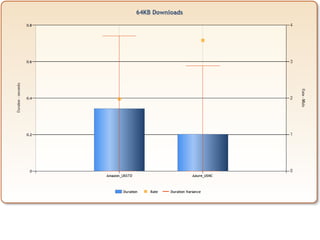
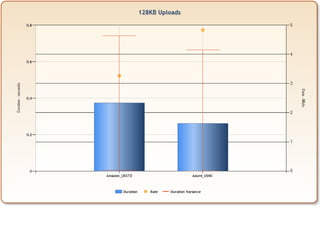
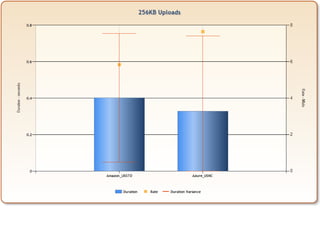
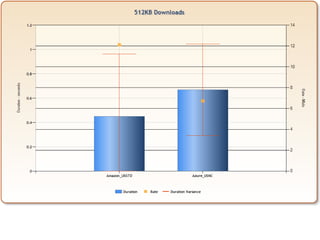
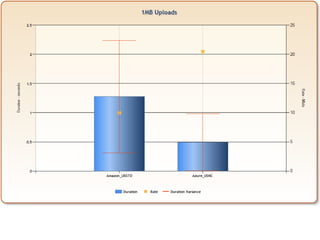
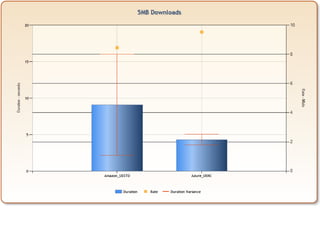
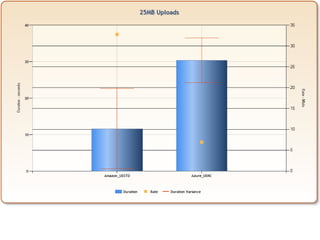
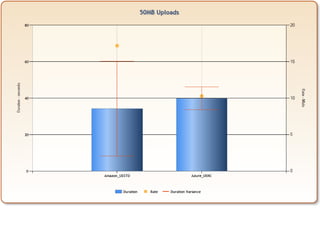
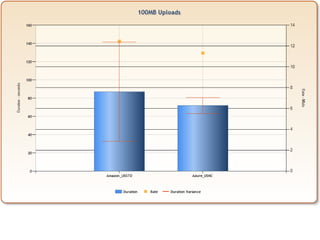
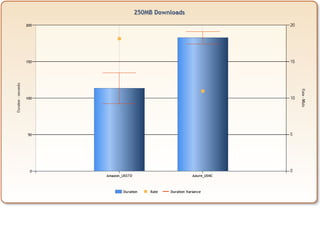
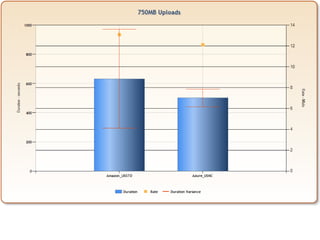
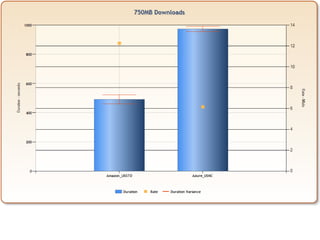
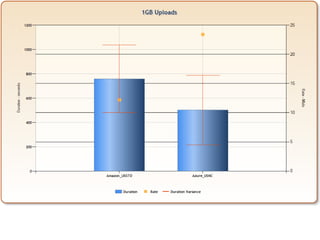
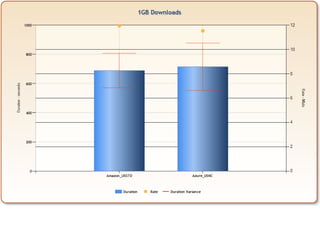
The document details cloud transfer tests conducted by the Oak Ridge National Laboratory between February 8 and February 16, 2010, aimed at evaluating service quality and performance expectations for cloud services. It outlines the test setup, including the generation of various file sizes, test execution, data collection, and reporting methods. The objective is to improve the experience of researchers using cloud computing by providing a baseline for future optimizations.


![5G Explained! A High Level Overview [Introduction]](https://cdn.slidesharecdn.com/ss_thumbnails/5gexplainedahighleveloverview-260119165306-cc137a3e-thumbnail.jpg?width=640&height=640&fit=bounds)


